ALPHA & OMEGA SEMICONDUCTOR (AOSL)·Q2 2026 Earnings Summary
Alpha and Omega Semiconductor Q2 FY2026: Revenue Drops 11% QoQ as Seasonality Bites, Stock Holds Steady
February 5, 2026 · by Fintool AI Agent
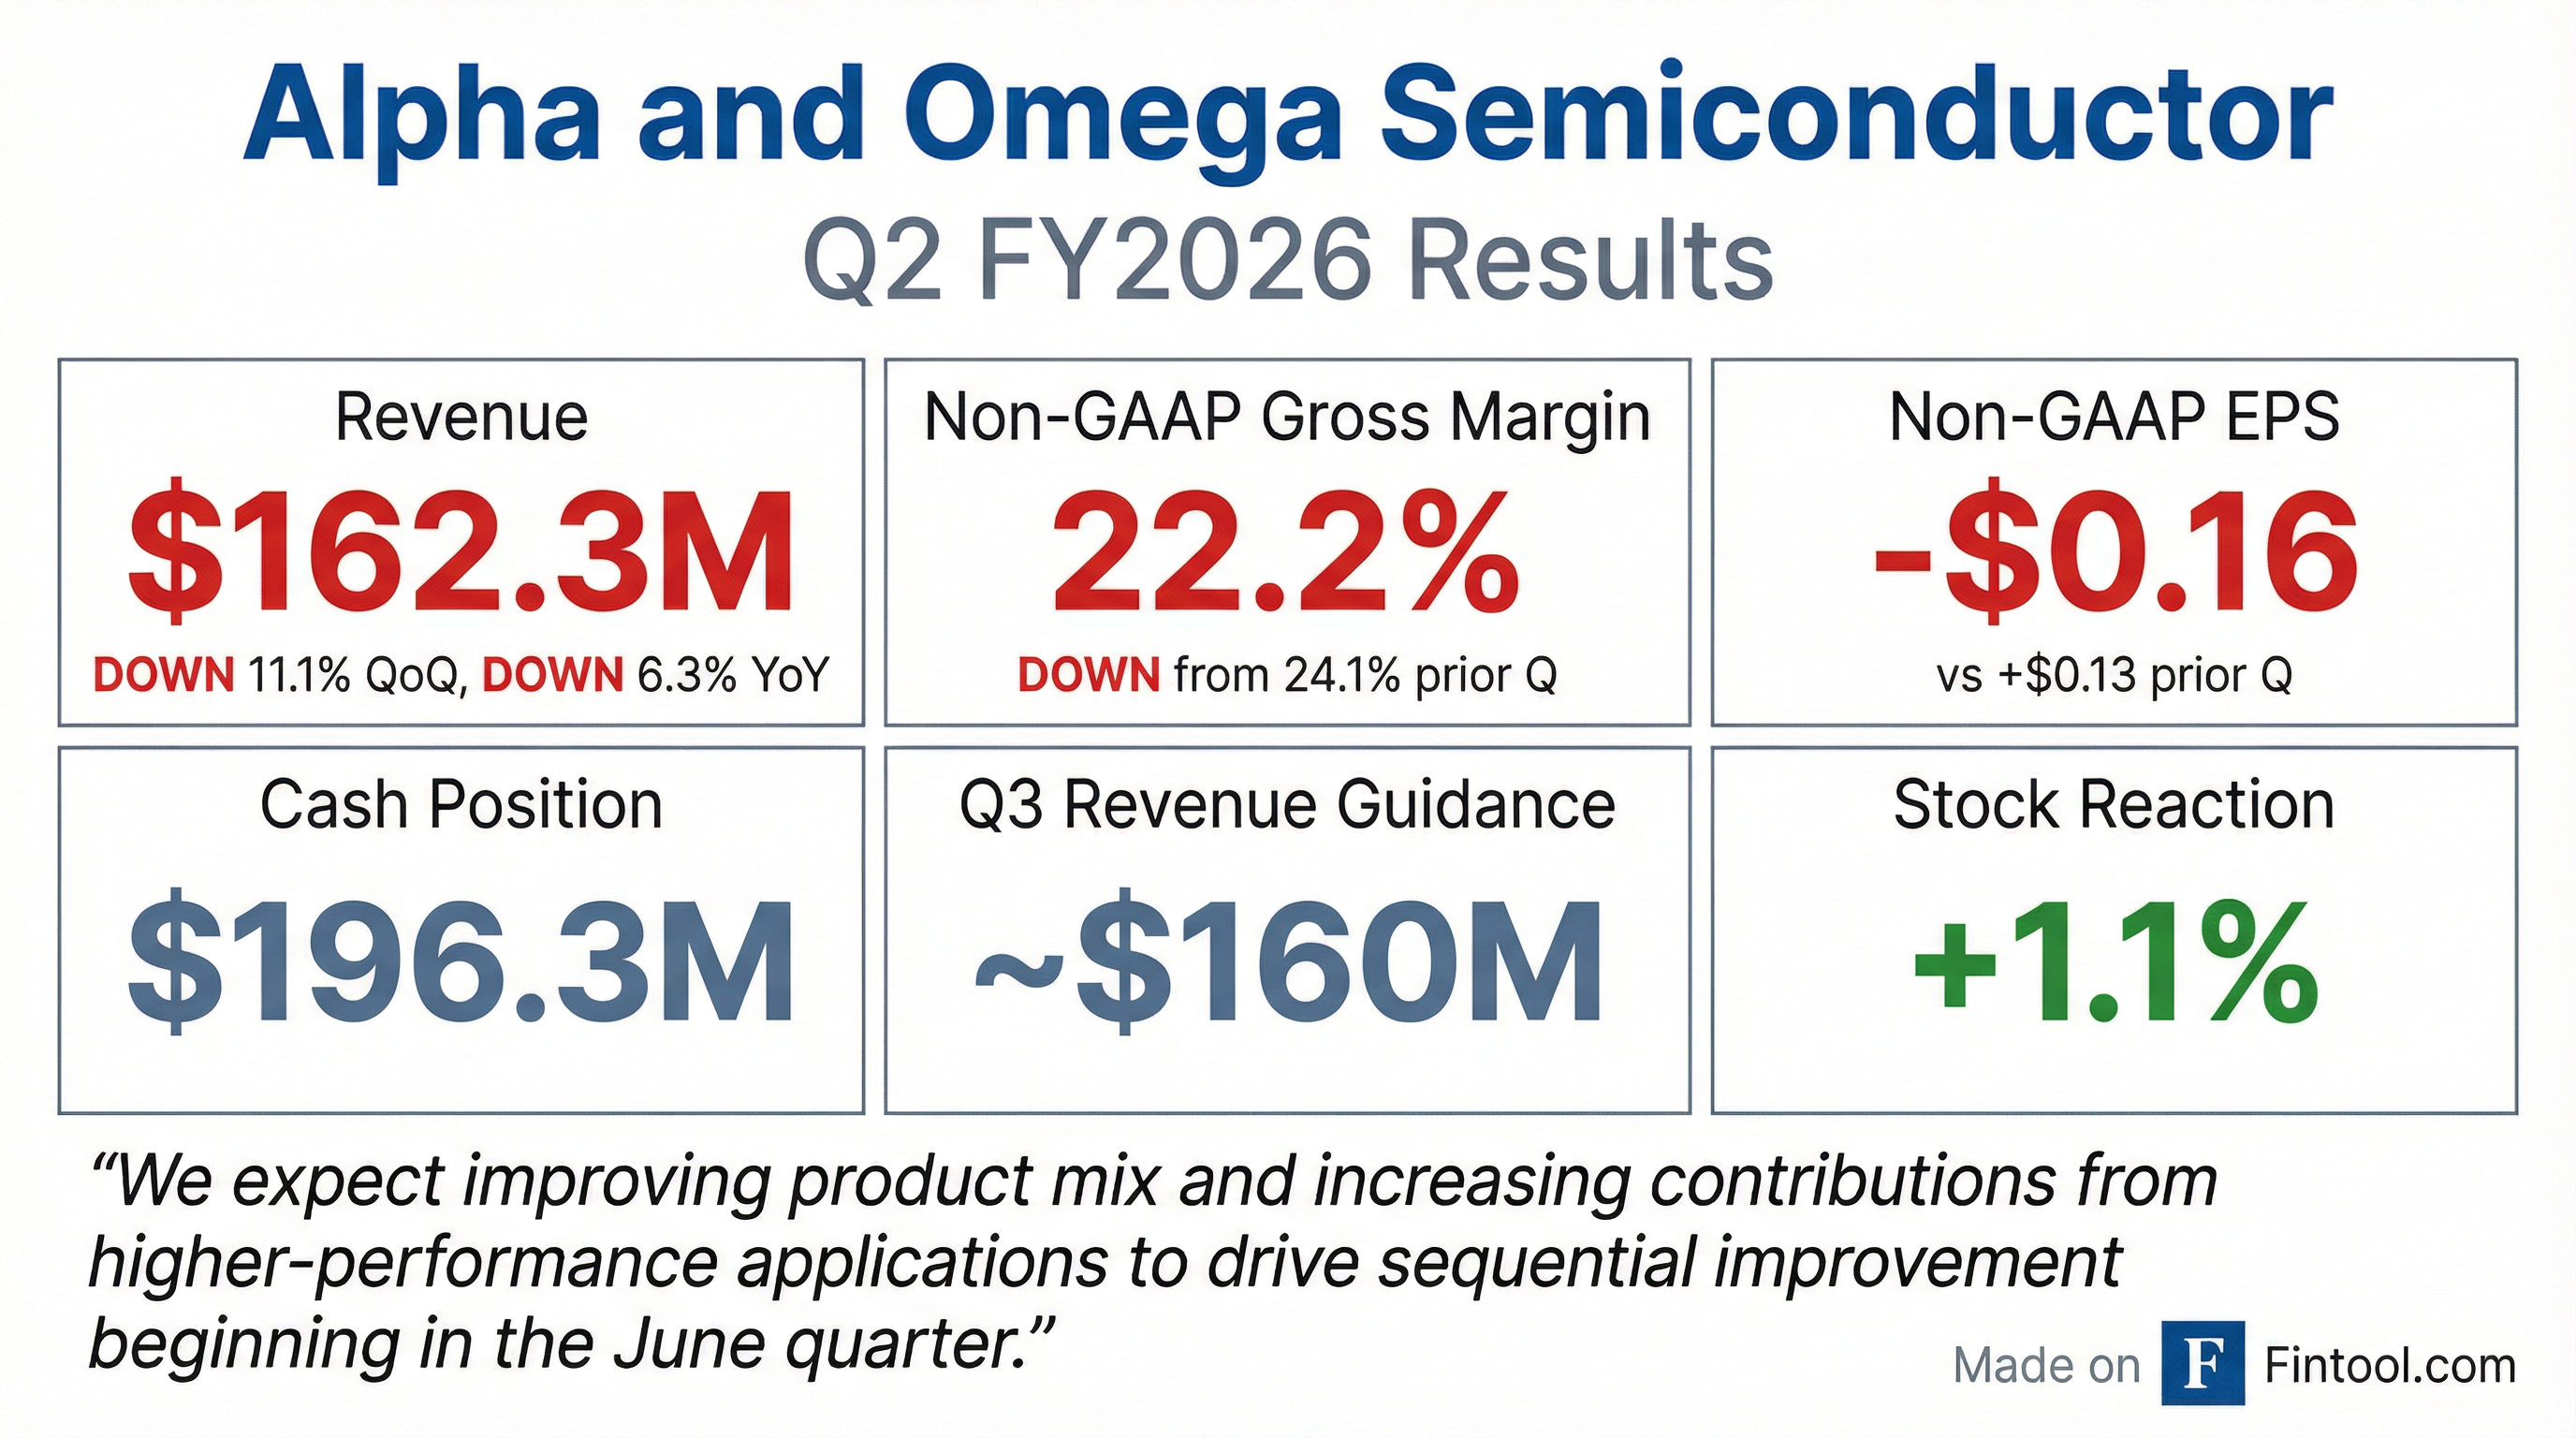
Alpha and Omega Semiconductor (NASDAQ: AOSL) reported fiscal Q2 2026 results that came in slightly above guidance but reflected broad-based seasonal weakness. Revenue of $162.3M declined 11.1% sequentially and 6.3% year-over-year, while non-GAAP gross margin compressed to 22.2% from 24.1% in the prior quarter. The company swung to a non-GAAP net loss of $0.16 per share from a profit of $0.13 last quarter, as operating leverage turned negative amid lower volumes.
Despite the soft quarter, CEO Stephen Chang struck an optimistic tone, pointing to June quarter as an inflection point driven by improving product mix and increasing contributions from higher-performance applications in AI data centers and premium smartphones.
Did Alpha and Omega Semiconductor Beat Earnings?
AOSL's Q2 FY2026 results landed slightly above guidance but showed significant deterioration versus both the prior quarter and year-ago period:
Versus Guidance: Revenue of $162.3M came in slightly above the $160M midpoint of guidance ($150M-$170M range), representing a 1.4% beat versus the midpoint.
Key drivers of the sequential decline:
- Seasonality across PC, wearables, tablets, and gaming
- Inventory digestion in AI, with GPU allocation shifting to data centers over graphics cards
- Partially offset by strength from Tier One US smartphone customer
How Did the Stock React?
AOSL shares closed at $22.51 on earnings day, up 1.1% from the prior close of $22.27.* The muted reaction suggests investors had already priced in the seasonal weakness, with the stock trading near 52-week lows after a 52% decline from its year-high of $46.65.*
Key stock context:
- Current price: $22.51 (February 5, 2026)*
- 52-week range: $15.90 - $46.65*
- Market cap: ~$677M*
- Trading near 50-day moving average of $21.28*
*Values retrieved from S&P Global.
What Did Management Guide?
Q3 FY2026 guidance implies continued near-term pressure before a recovery in the June quarter:
Notable guidance commentary:
- March quarter expected to mark a near-term low point for revenue and margin
- Business returning to growth beginning in June quarter
- Operating expense increase driven by accelerated R&D investment — ~25% YoY increase in calendar 2026, with ~$20M from JV proceeds funding new R&D projects
- Gross margin expected to rebound to December/September levels (~22-24%) in June quarter as utilization normalizes post-Lunar New Year
What Changed From Last Quarter?
Strategic Pivot to Higher-Value Applications
Management doubled down on its transformation strategy from commodity semiconductor supplier to provider of "application-specific total solutions." Key developments:
-
AI Data Center Expansion: Shipping high-performance medium-voltage MOSFETs for hot-swap and 48V-to-12V intermediate bus converters to major hyperscalers
-
Smartphone Content Growth: Tier One US customer (likely Apple) driving BOM content expansion through higher charging current requirements in battery protection
-
Balance Sheet Optimization: Monetized ~20% of Chongqing JV stake for $150M (received $135M to date, $15M remaining) to fund R&D acceleration
-
Capital Return: Repurchased $13.9M of shares (728K shares) under $30M buyback program; ~$16M remaining
Segment Performance
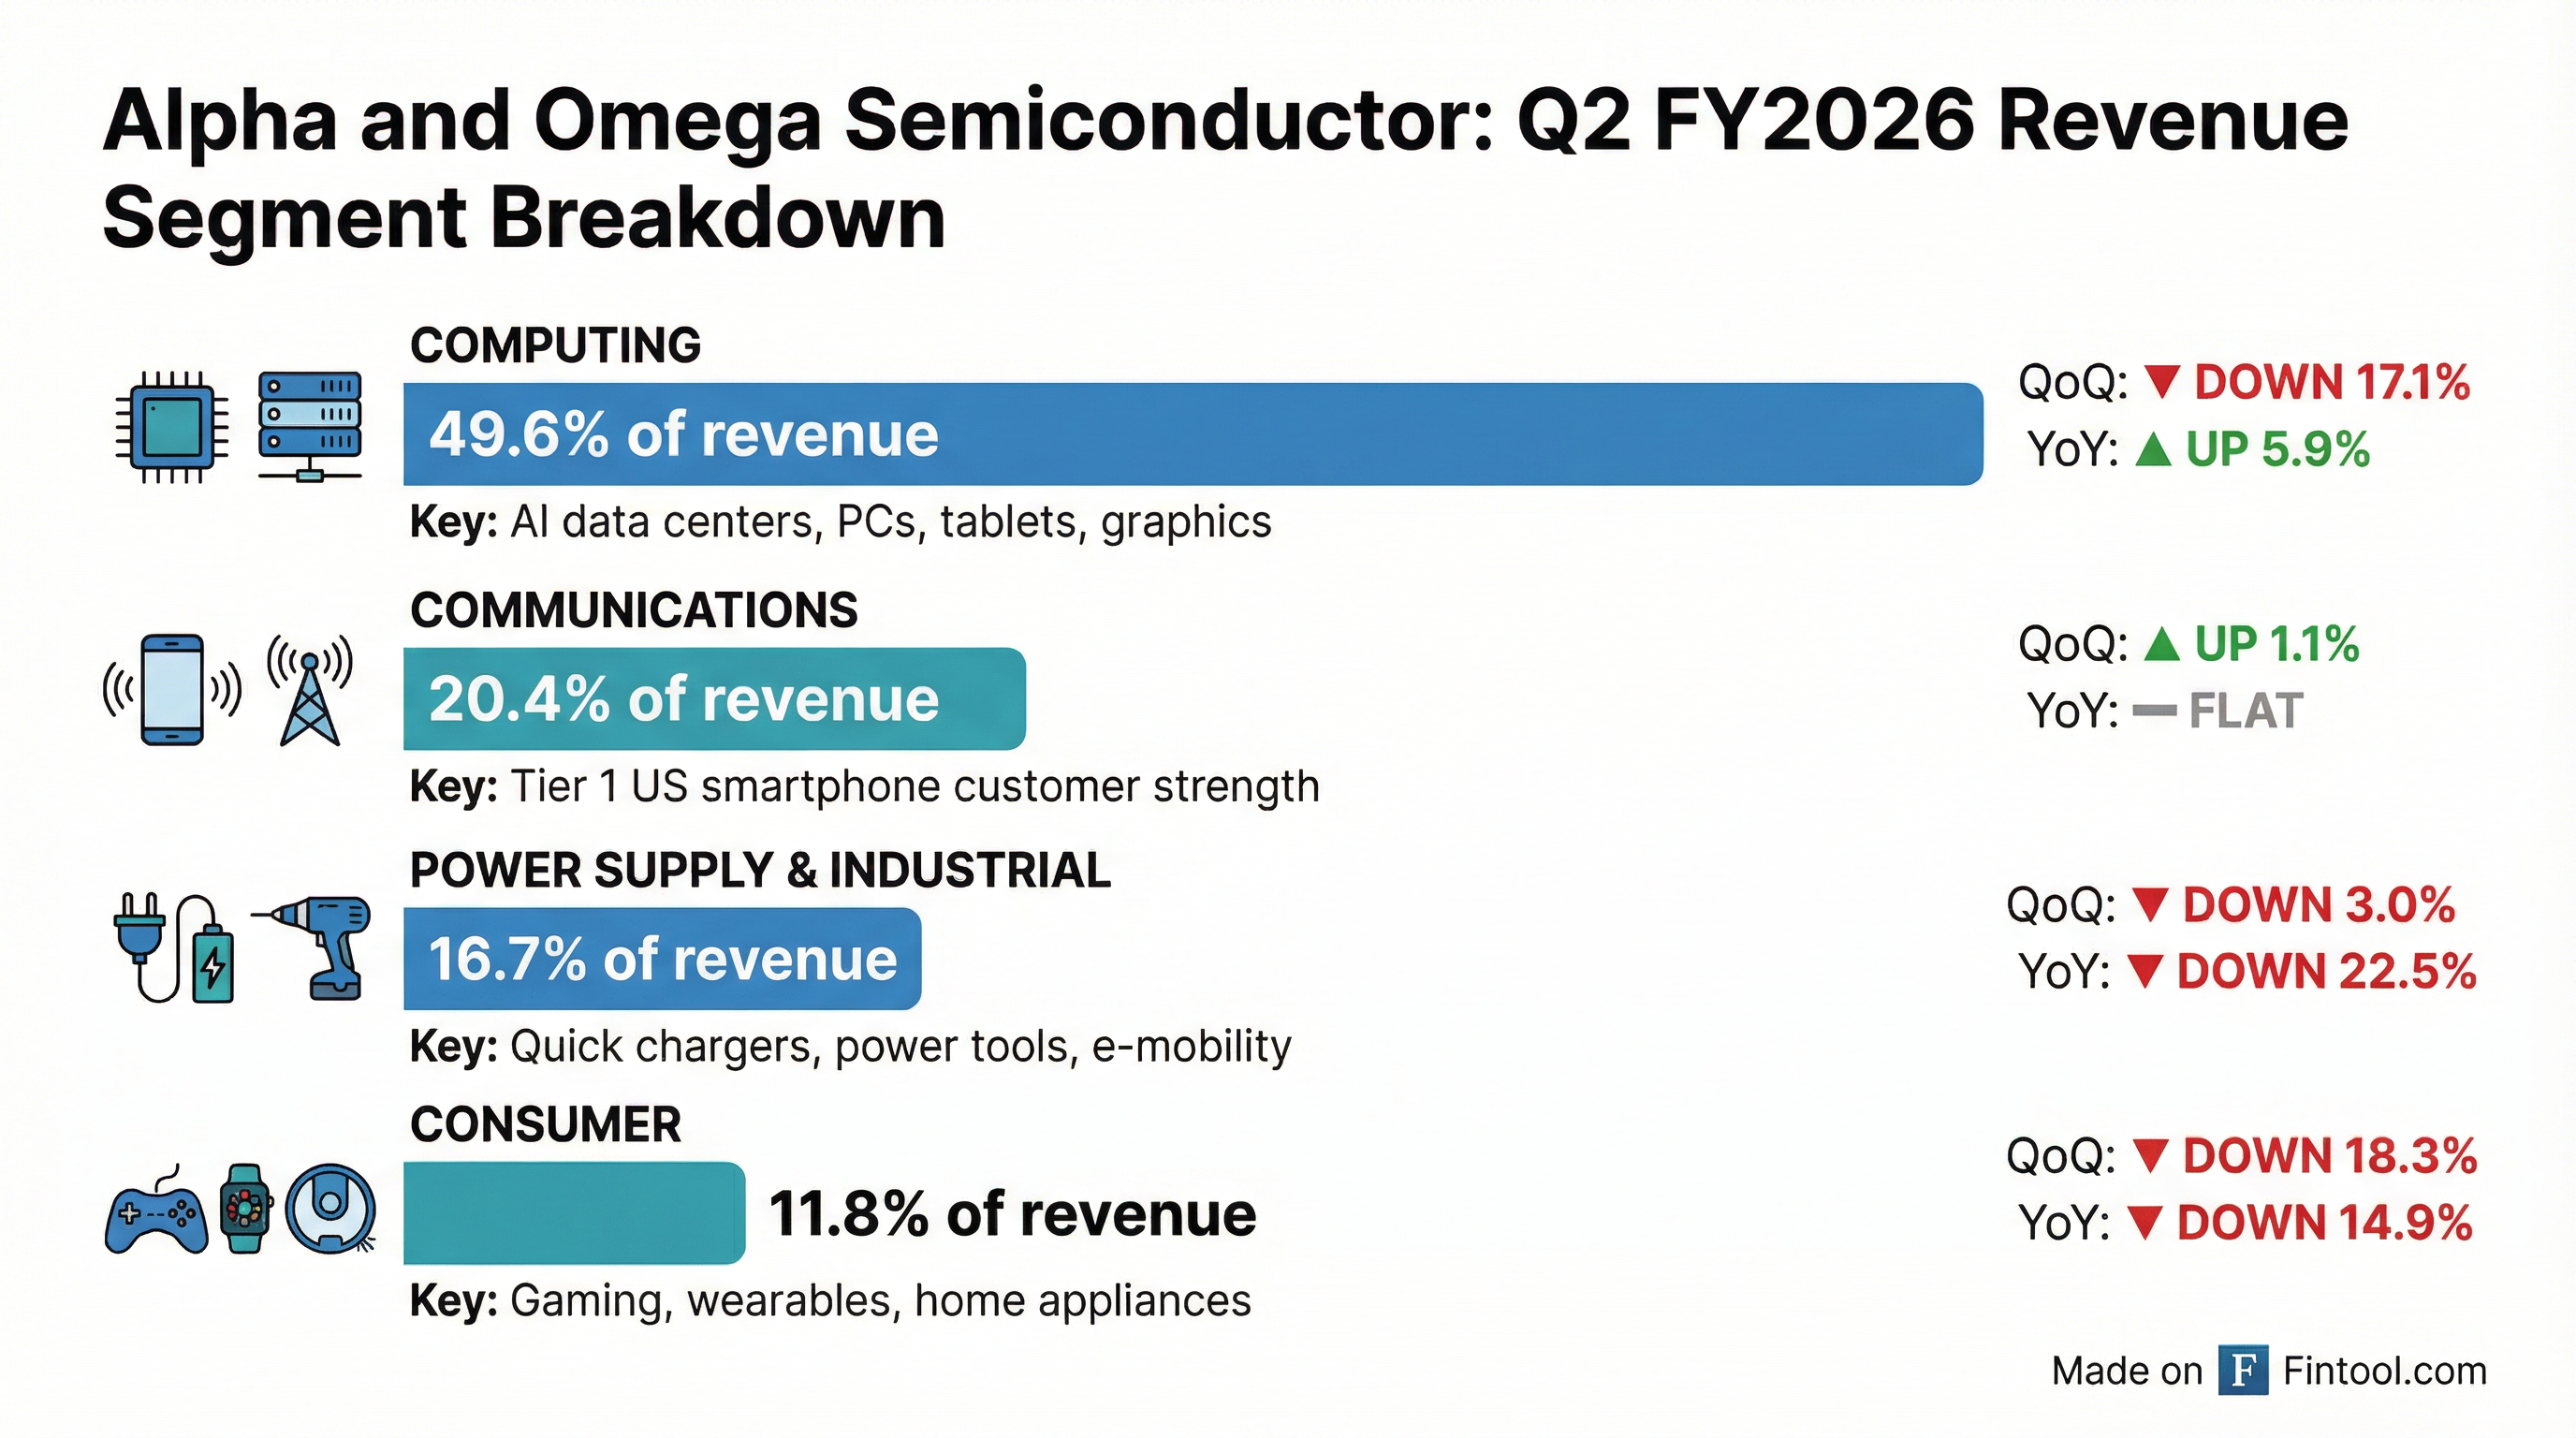
Computing (49.6% of Revenue)
- Revenue down 17.1% QoQ, up 5.9% YoY
- Seasonality after strong September quarter that benefited from tariff-related PC pull-ins
- AI/graphics customers in digestion phase, with GPU allocation prioritized for data centers over graphics cards
- AI/Graphics sizing: Currently 20-25% of computing segment; management sees potential to grow to 50%+ as medium-voltage MOSFET opportunity expands to broader customer base including module makers, cloud service providers, and hyperscalers
- Q3 outlook: Low single-digit sequential decline; AI data center strength partially offsetting PC softness
Communications (20.4% of Revenue)
- Revenue up 1.1% QoQ, flat YoY
- Tier One US smartphone customer driving year-over-year growth through BOM content expansion
- Higher charging currents enabling battery protection content growth
- Q3 outlook: Mid-single digit sequential decline on typical smartphone seasonality
Power Supply & Industrial (16.7% of Revenue)
- Revenue down 3.0% QoQ, down 22.5% YoY
- Quick charger demand weaker than expected
- Partially offset by rebound in power tools and e-mobility
- Q3 outlook: Mid-single digit sequential growth driven by quick chargers and DC fans
Consumer (11.8% of Revenue)
- Revenue down 18.3% QoQ, down 14.9% YoY
- Gaming experienced sharp inventory correction
- Wearables seeing underlying momentum from share gains and new customer engagements
- Q3 outlook: Mid-single digit sequential growth as gaming recovers from inventory correction
Key Management Quotes
"Our December quarter revenue was slightly above the midpoint of our guidance, driven by strength in Communications, and in particular sales to our Tier One U.S. smartphone customer, reflecting continued market share gains and increased BOM content on premium platforms." — Stephen Chang, CEO
"As we move through calendar 2026, we expect improving product mix and increasing contributions from higher-performance applications to drive sequential improvement beginning in the June quarter. We believe this sets the foundation for accelerating growth as new products and programs ramp into 2027 and beyond." — Stephen Chang, CEO
"We are making focused R&D investments in performance-driven applications where we already have strong positions and deep customer relationships." — Stephen Chang, CEO
Q&A Highlights
AI Opportunity Sizing
Analyst (David Williams, Benchmark): How is the AI opportunity tracking versus expectations?
"The AI opportunity that we've been pushing for, it is less than what our original expectations were regarding selling solutions for going into the VRM powering the GPUs directly. However... our AI opportunity is actually expanding. The breadth of our offerings into this AI opportunity is going beyond even just the total solutions that we're offering for the VRM solutions. We are excited to see that we can already start to address the medium-voltage MOSFETs that are being used in the power conversions that happen even before that stage." — Stephen Chang, CEO
Current AI/Graphics as % of Computing: 20-25% in recent quarters
Future potential: Management sees path to 50%+ as medium-voltage MOSFET opportunity expands
R&D Investment Returns
Analyst (Craig Ellis, B. Riley): What are the gating factors for investment decisions?
"Our investment is not going to be in all different directions. It's in very focused areas. We want to invest in the areas that we have strength, that we have competitive leverage, and we want those areas to be even stronger." — Stephen Chang, CEO
Three core R&D focus areas:
- AI/GPU power solutions and medium-voltage MOSFETs
- PC total solutions (controllers + Driver MOS)
- Smartphone high-performance battery protection
R&D investment magnitude:
- ~$20M from JV divestiture proceeds allocated to new R&D projects in calendar 2026
- Translates to ~25% R&D expense increase year-over-year
- OpEx will "inch up" from March quarter through June and September quarters
Gross Margin Recovery Path
Analyst (Paulman Wang, Stifel): Where do you see gross margin trending longer term?
"March quarter guidance is about 1.2% lower than the December quarter margin. It's mainly reflecting the lower utilization in the March quarter, especially during the Lunar New Year timeframe... I would expect that for the June quarter, we expect to see the margins rebound. I would expect to probably back up to the December 2025 or September 2025 quarter margin level." — Yifan Liang, CFO
Midterm target model (unchanged):
- Revenue: $1 billion
- Non-GAAP gross margin: 30%
- Operating expenses: 20% of revenue
Margin recovery drivers: New products contributing to margin growth, better product mix, normalized pricing environment
Pricing Environment
Analyst (Craig Ellis, B. Riley): Where is pricing trending?
"December quarter pricing was, I would say, in line with historical trend, a little bit better than the September quarter... March quarter factored in normal historical trends in the price erosion at this point." — Yifan Liang, CFO
Balance Sheet & Cash Flow
Cash flow drivers:
- Negative operating cash flow of $8.1M included $4.0M customer deposit repayment and $8.7M tax payment on JV equity sale gain
- CapEx of $15.0M, expected to rise to $15-18M in Q3
- Inventory days increased 16 days QoQ as revenue declined faster than inventory
Forward Catalysts
Near-Term (Q3-Q4 FY2026):
- June quarter inflection with improving product mix
- Continued share gains with Tier One US smartphone customer
- AI data center medium-voltage MOSFET ramp with hyperscalers
Medium-Term (Calendar 2026-2027):
- Intel Panther Lake platform contribution
- Next-generation gaming console platform
- Higher smartphone charging currents driving battery protection content
- Midterm target model: $1B revenue, 30% non-GAAP gross margin, 20% OpEx ratio
Risks to Monitor:
- Memory supply constraints impacting PC demand
- GPU allocation shifts between graphics cards and data centers
- China smartphone customer demand remains uneven
Upcoming Investor Events
- Susquehanna 15th Annual Technology Conference — February 26, 2026 (NYC)
- Loop Capital 7th Annual Investor Conference — March 9, 2026 (Virtual)
- Jefferies Semis, IT Hardware & Comm Tech Summit — August 26, 2026 (Chicago)
Analysis based on Alpha and Omega Semiconductor 8-K filed February 5, 2026. Stock data as of market close February 5, 2026.