EASTMAN CHEMICAL (EMN)·Q4 2025 Earnings Summary
Eastman Chemical Beats EPS Despite Revenue Miss as Cash Flow Nears $1B
January 30, 2026 · by Fintool AI Agent
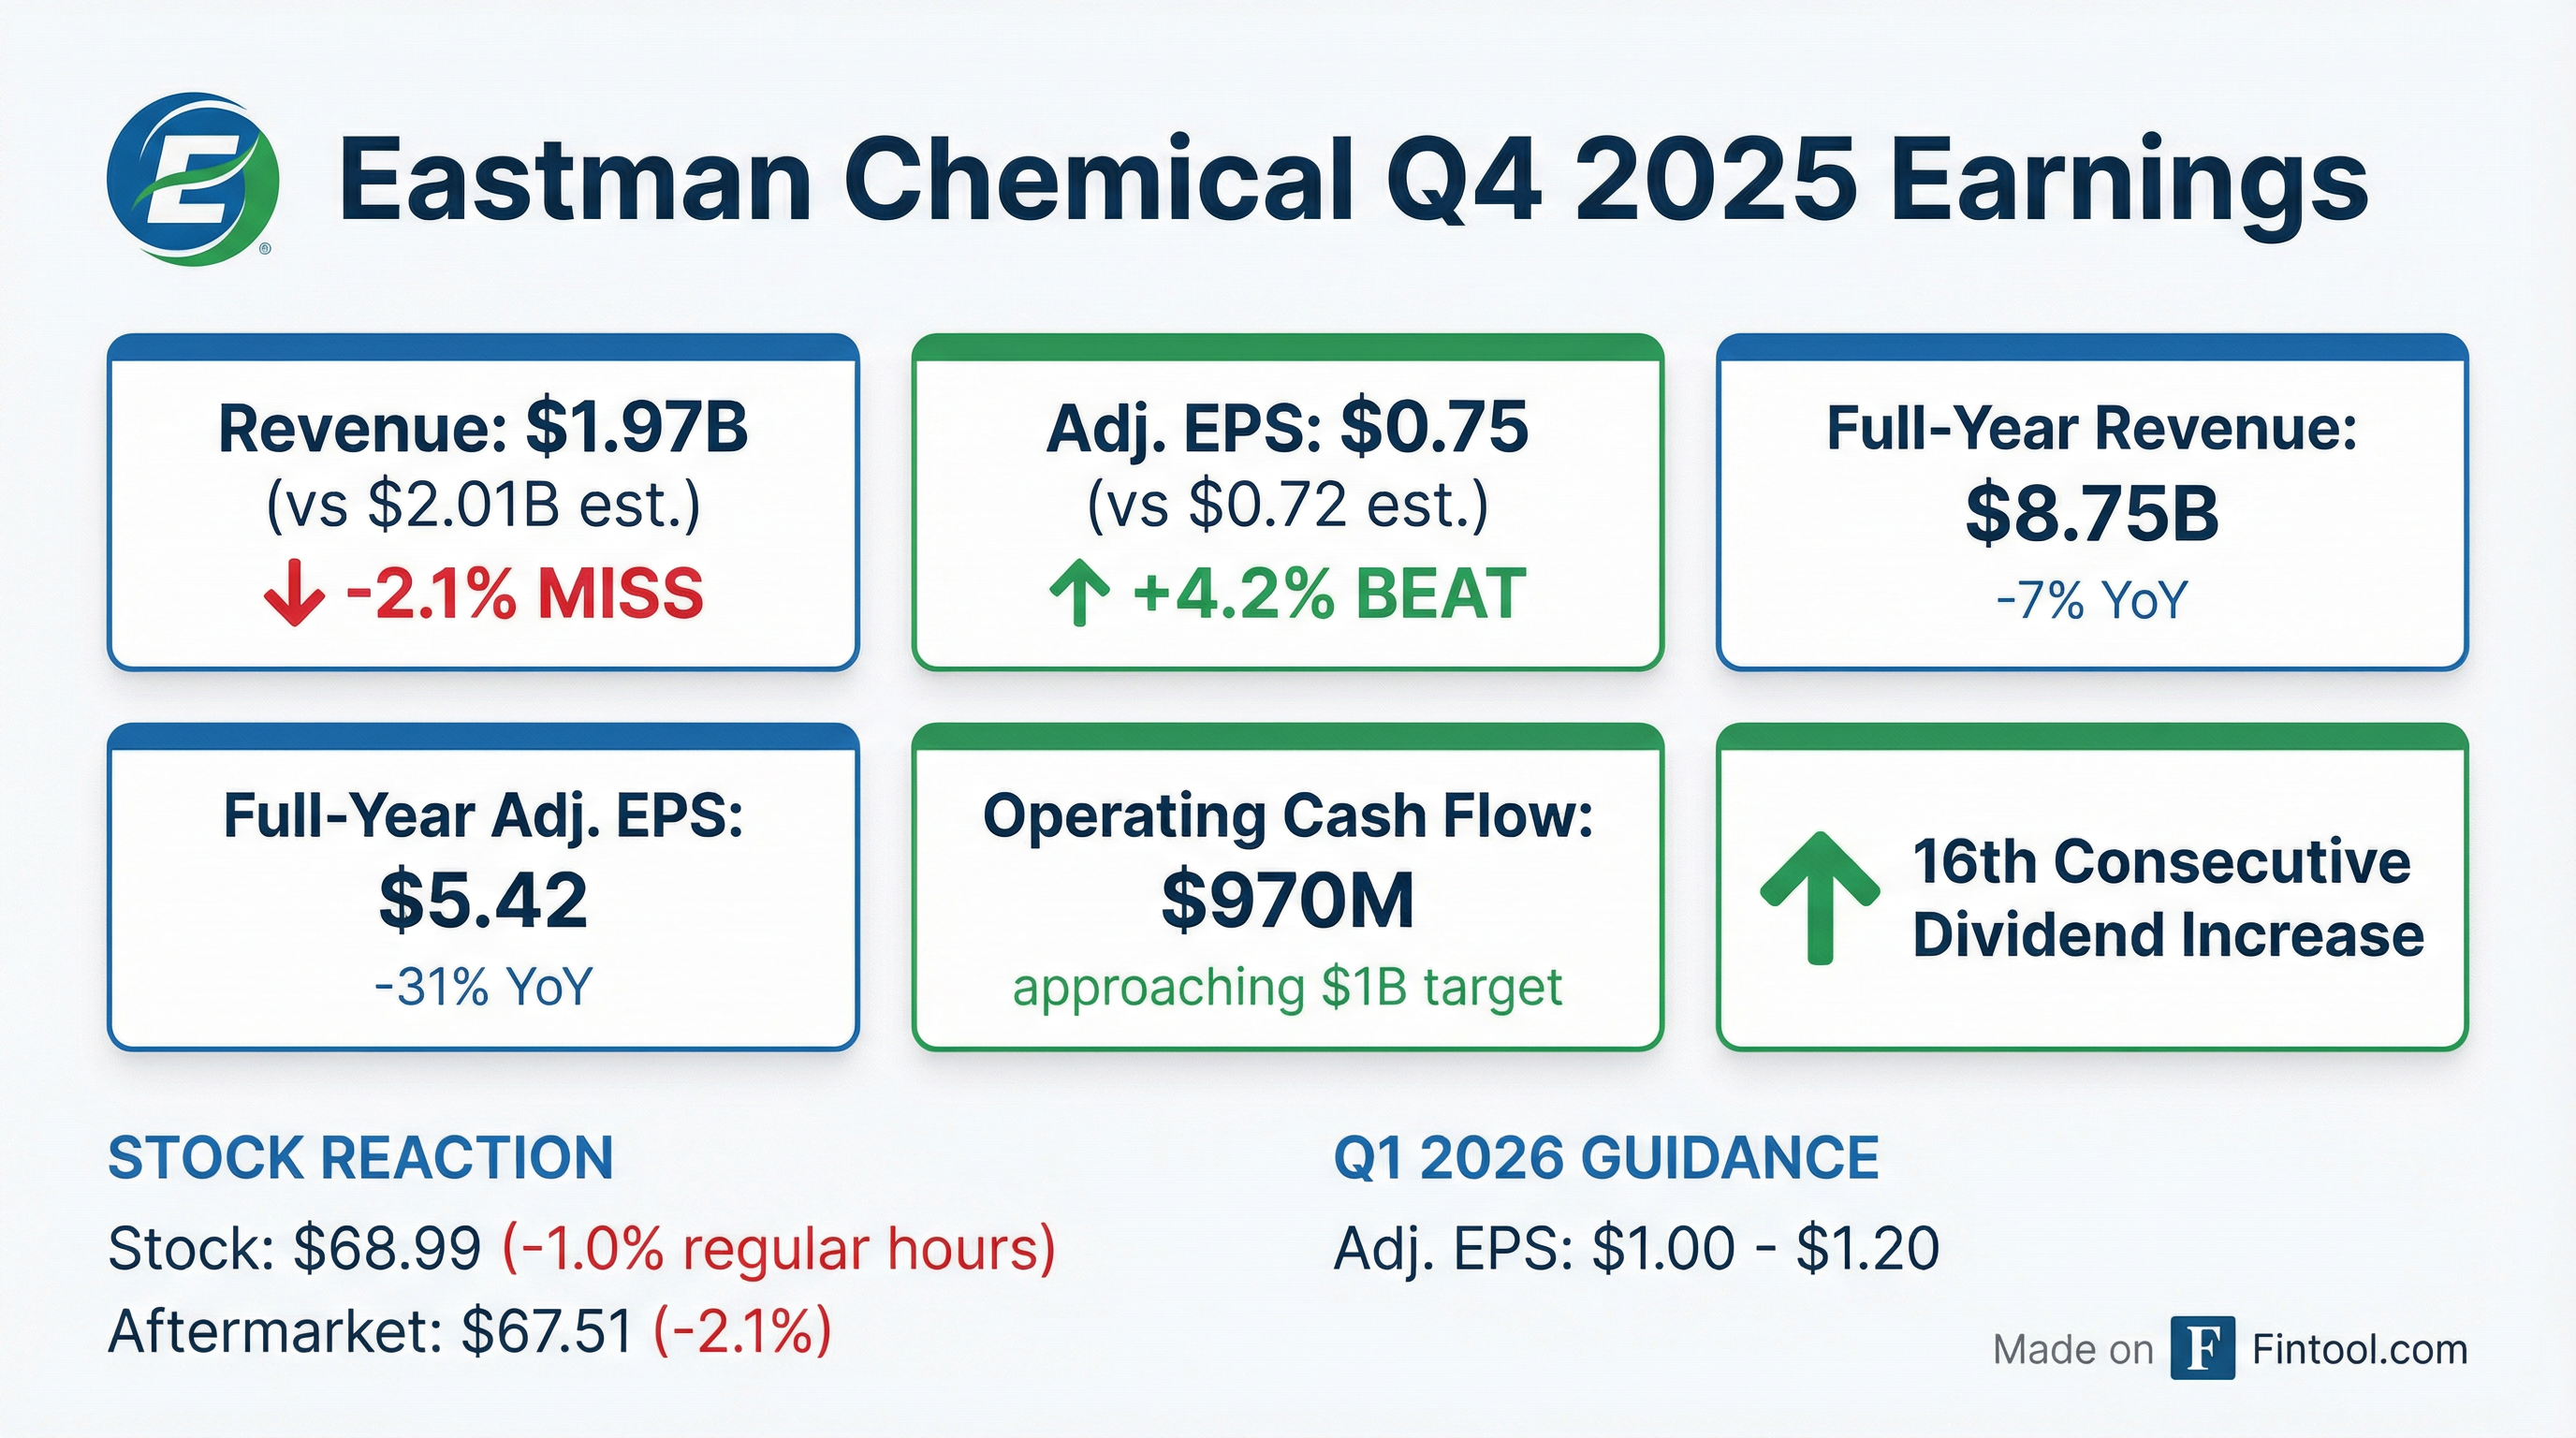
Eastman Chemical Company reported Q4 2025 results that delivered a mixed picture: adjusted EPS of $0.75 beat consensus by 4.2%, but revenue of $1.97B came in 2.1% below expectations as ongoing customer inventory destocking in acetate tow and weak consumer discretionary demand pressured top-line results.
Did Eastman Chemical Beat Earnings?
EPS: Beat by 4.2% — Adjusted EPS of $0.75 exceeded the $0.72 consensus estimate, driven by aggressive cost reduction initiatives that achieved approximately $100 million in savings (vs. a target of $75M+).
Revenue: Missed by 2.1% — Sales of $1.97B fell short of the $2.02B estimate, declining 12% year-over-year due to 11% lower volume/mix and 2% lower pricing.
Full-year 2025 results showed the magnitude of the challenging operating environment:
What Drove the Revenue Miss?
Revenue declined across all four segments, with Fibers hit hardest (-27% YoY):
By Segment:
The Fibers segment has been particularly challenged throughout 2025, declining 20% for the full year due to persistent customer inventory destocking and competitive pressures in the acetate tow market.
Fibers EBIT Breakdown: Management provided helpful detail on the Q&A call—approximately 40% of the Fibers EBIT decline was NOT from acetate tow:
- $30M: Tariff-driven textile business decline (normally grows to offset tow decline)
- $20M: Overall stream slowdown from reduced cellulosics demand across the company
- $50M: Higher utilization and energy costs
On 2026 volume, management expects tow volumes to be stable year-over-year at contract minimums, with growth coming from textile expansion (Naia filament and new staple products) and Aventa cellulosic packaging products ramping in food trays, cutlery, and straws.
What Did Management Guide?
Q1 2026 Guidance: Adjusted EPS of $1.00-$1.20 (excluding potential winter storm impacts), representing a substantial sequential increase from Q4's $0.75.
Full-Year 2026 Outlook: While management declined to provide official guidance, CEO Mark Costa provided meaningful color on the earnings call. When an analyst noted their bridge items pointed to approximately $5.50-$6.00 in EPS, Costa responded: "When you think about the sort of upper end of what you're talking about, around $6 a share, you know, that's very much in the range of what we're thinking is possible." He emphasized the wide range of potential outcomes due to macroeconomic uncertainty, noting both downside risks (tariffs, weak consumer) and upside potential from pent-up demand recovery.
Key 2026 Drivers:
What Changed From Last Quarter?
Volume trends worsened: Q4 volume/mix declined 11% YoY vs. Q3's 6% decline, as customers leveraged year-end inventory management and tariff-related pre-positioning reduced seasonal orders.
Pricing stabilized slightly: Prices declined 2% in Q4 vs. 1% in Q3, with Chemical Intermediates seeing the most pressure from Asian competition.
Segment margins compressed:
Chemical Intermediates swung to a negative adjusted EBIT margin of -6.7% in Q4, the weakest performance since the 2020 downturn, as weak end-market demand and Asian competitive pressure compressed spreads.
E2P Project — Structural Fix for CI: Management highlighted the ethylene-to-propylene (E2P) project as the biggest action to reduce CI earnings volatility. The project converts bulk ethylene (the biggest earnings drag) into propylene, which:
- Eliminates losses on bulk ethylene sales
- Replaces higher-cost purchased propylene
- Improves propylene-side margins
- Expected benefit: $50M-$100M improvement, depending on industry spread scenarios
- Payback: Less than 2 years
How Did the Stock React?
EMN shares closed at $68.99 on January 29, down 1.0% during regular trading. In after-hours trading, the stock fell to $67.51, down an additional 2.1% from the close, suggesting investors are focused on the revenue miss and cautious 2026 outlook despite the EPS beat.
The stock is trading:
- Down 34% from its 52-week high of $103.82
- Up 23% from its 52-week low of $56.11
- Below its 200-day moving average of $69.36
Recent Earnings Reactions:
Key Management Quotes
CEO Mark Costa on cash generation despite the challenging environment:
"Despite a challenging operating environment for the chemical industry and continued weakness in consumer discretionary end markets, our team delivered a year that demonstrates the strength of our portfolio's ability to generate cash. In 2025, we generated operating cash flow approaching $1 billion, a clear validation of our disciplined approach to cost and working capital management."
On 2026 positioning:
"We enter 2026 with momentum on key initiatives to improve our financial results compared to 2025. Given the continued macro uncertainty, which has been a headwind for our industry for over four years, we remain focused on self-help measures that will deliver value this year."
On the macro environment and upside potential:
"Right now, demand has been incredibly weak since 2019... housing total home sales down 20%. You've got consumer durables down 5%-15%. A lot of pent-up demand, since 2019 to now, not to mention normal market growth being missing, that can recover at some point when consumers get confident and stable."
On controlling what they can control:
"The biggest driver of our company in earnings and performance and cash is volume... right now, we're assuming the markets in our planning scenario are relatively stable [to] last year. And then what are all the different things that we can do to drive value?"
Capital Allocation & Shareholder Returns
Eastman demonstrated commitment to shareholder returns even in a challenging year:
Net debt was essentially flat at $4.22B vs. $4.18B a year ago, with the company maintaining its investment-grade balance sheet.
Strategic Progress: Methanolysis Facility
A bright spot in the quarter was the continued progress at Eastman's Kingsport methanolysis facility for circular recycling:
- Produced 2.5x production quantities vs. 2024
- Delivered approximately $60 million of incremental earnings in 2025 vs. 2024
- Expanding commercial activities into targeted applications to increase utilization in 2026
- Kingsport debottleneck potential: 130% — This gives Eastman runway to grow before building a second plant
- Second plant update: Engineering on hold after losing the DOE grant; evaluating three capital-efficient alternatives that could leverage existing assets
Mechanical Recycling Quality Degrading Faster Than Expected: A key bullish signal from the Q&A—management explained that mechanical recycling (melt-and-remold) is showing quality degradation faster than the industry anticipated. CEO Costa noted:
"The polymer starts to get yellow, it starts to get gray. You'll see that on the bottles on the shelf... it's showing up a lot faster... That really confirms our value proposition because we have none of those problems."
This quality issue is pulling demand forward from major brands, including Pepsi and others, who are ordering Eastman's chemically recycled PET sooner than originally planned.
Q&A Highlights: Customer Inventory and Demand Recovery
Inventory levels lean, orders recovering: Management provided encouraging color on the inventory cycle. Unlike the 2022-2023 destocking, where customers were sitting on excess inventory, current levels are much leaner:
"Back then... we had a huge and difficult Q4, where volume really dropped, and then it dropped even more in Q1 of 2023. Whereas now we see orders picking up in January, February, relative to last fourth quarter. That gives me comfort that they wouldn't be ordering more right now if they hadn't managed their inventory."
Path to Normalized Earnings ($2B EBITDA): When asked about structural barriers to restoring earnings power, Costa was constructive. He noted that CI and Fibers combined EBITDA was ~$520M in 2019 vs. ~$420M now—and the E2P project alone could close that gap. With $225M-$250M in cumulative cost reductions and demand recovery in AM/AFP, management still believes $2B EBITDA is achievable over time.
High-purity solvents for semiconductors: A small but notable growth driver in AFP—margins are above segment average and volumes are growing 20-30%, helping offset discontinued products and lower HTF sales.
Risks and Concerns
Macroeconomic uncertainty: Management explicitly cited four years of macro headwinds and declined to provide full-year EPS guidance due to ongoing uncertainty.
Fibers segment pressure: Acetate tow destocking and industry capacity share adjustments have persisted throughout 2025 with no clear timeline for normalization.
Chemical Intermediates margin collapse: The segment turned to negative operating margins in Q4, with Asian competitive pressure showing no signs of abating.
Tariff exposure: Management noted customers are pre-positioning inventory to mitigate tariff impacts, creating demand volatility.
What to Watch in Q1 2026
- Winter storm impacts — Management excluded potential storm impacts from their Q1 guidance of $1.00-$1.20
- Volume recovery — Whether normal seasonality and reduced customer caution drive expected sequential improvement
- Chemical Intermediates spreads — Whether margin compression stabilizes or worsens
- Methanolysis ramp — Continued growth from the circular recycling initiative
This analysis incorporates Eastman's Q4 2025 8-K filing and earnings call transcript from January 30, 2026. A replay is available at investors.eastman.com.
Related Research: