Farmers & Merchants Bancshares (FMFG)·Q4 2025 Earnings Summary
Farmers and Merchants Bancshares Posts 35% Earnings Jump as Loan Growth Drives Record Year
January 29, 2026 · by Fintool AI Agent
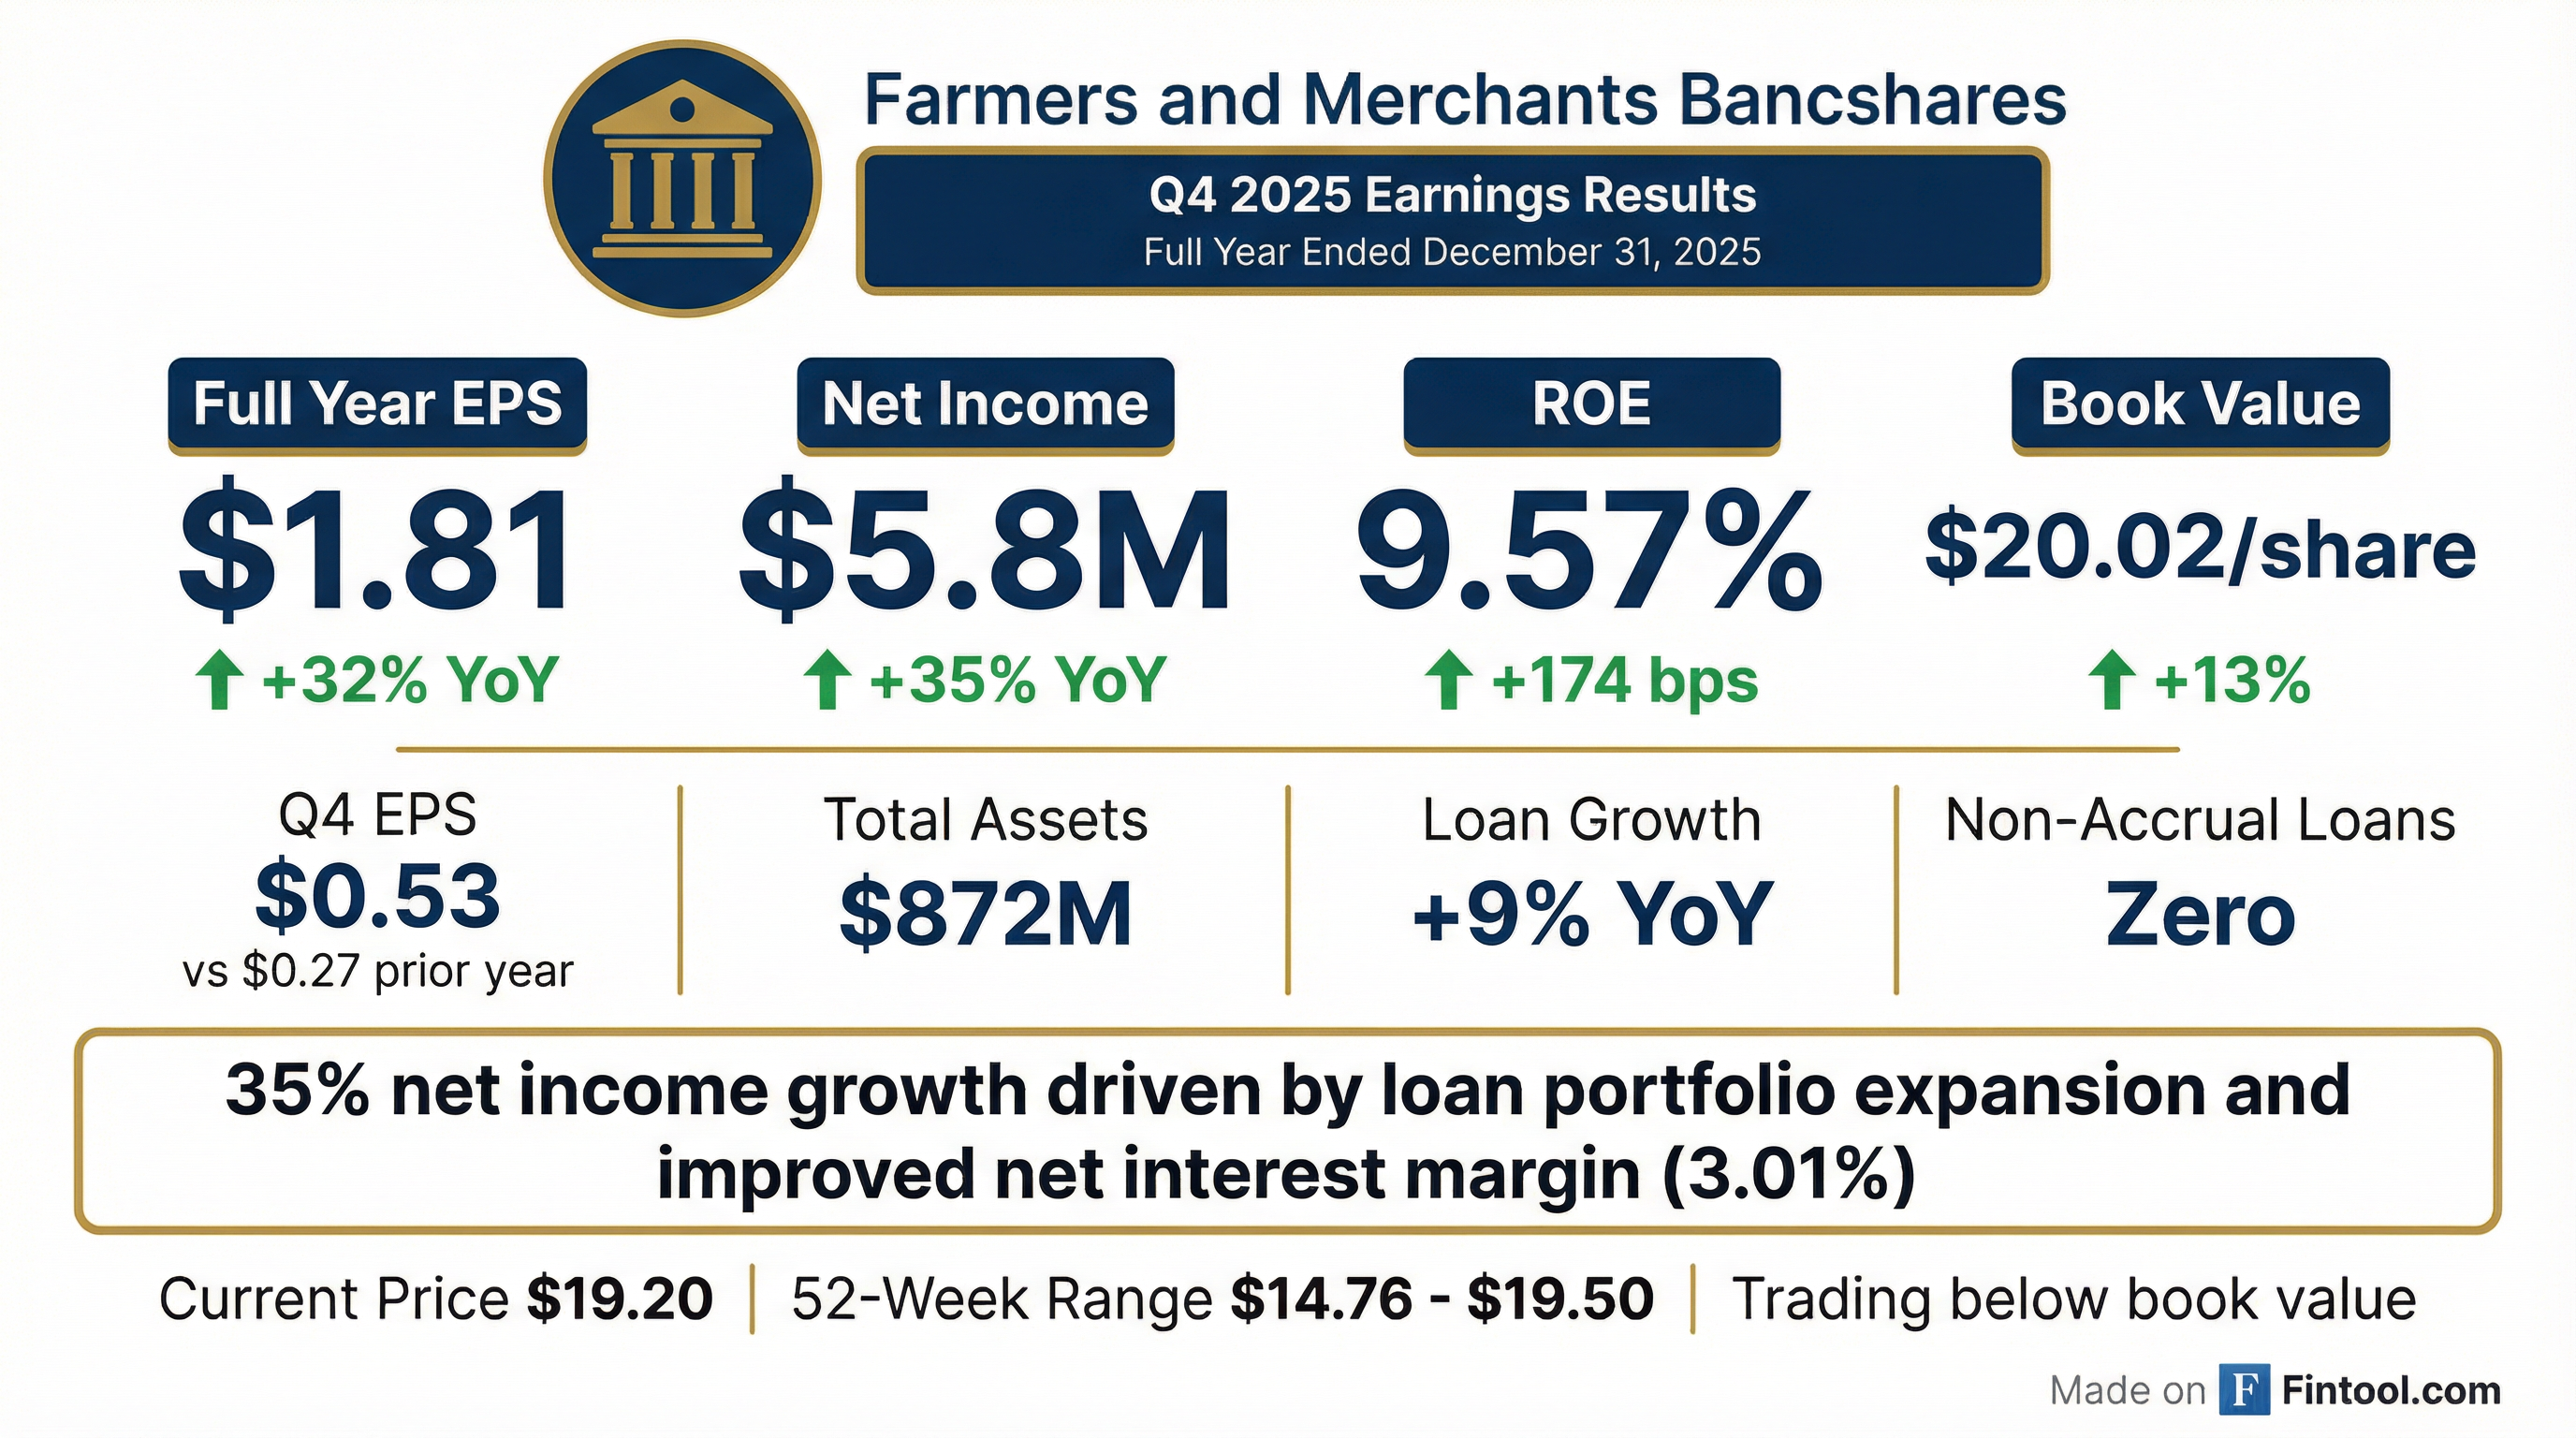
Farmers and Merchants Bancshares (OTC: FMFG), the parent company of Farmers and Merchants Bank, delivered a strong turnaround in 2025 with full-year net income of $5.8 million, or $1.81 per share, compared to $4.3 million, or $1.37 per share, in 2024—a 35% increase in net income and 32% increase in EPS.
The Maryland-based community bank achieved this growth through a combination of loan portfolio expansion, improved net interest margin, and disciplined cost management, while maintaining pristine asset quality with zero non-accrual loans.
How Did FMFG Perform in Q4 2025?
Q4 2025 was particularly strong, with quarterly net income of $1.7 million ($0.53 per share) nearly doubling from $0.9 million ($0.27 per share) in Q4 2024.
Full Year 2025 Summary:
Note: No analyst coverage exists for FMFG, so beat/miss metrics are not available.
What Drove the Strong Performance?
Net Interest Margin Expansion
The primary driver was a significant improvement in net interest income, which increased $3.6 million to $24.4 million for the full year.
The margin expansion was driven by higher yields on loans (5.84%) as existing loans repriced, combined with a modest reduction in funding costs.
Loan Portfolio Growth
Loans, net of allowance for credit losses, grew to $633.1 million from $583.0 million, an increase of $50.1 million or 8.6%.
What Did Management Say?
CEO Gary Harris provided optimistic commentary on the results:
"In 2025, we achieved a 35% increase in net income which was accomplished by growing our loan portfolio and reducing our funding costs. Our loan portfolio, net of allowance for credit losses, grew to $633 million, which is an increase of $50 million, or 9%, over last year's balance. The yield on loans improved to 5.84% as existing loans in our portfolio repriced over the past year. This, along with lower cost of funds, has resulted in our net interest rate yield rising to 3.01% for the year."
On asset quality:
"Our asset quality remains strong with zero non-accrual loans as of December 31, 2025. We look forward to building on a successful year as we continue to capitalize on our strategic investments in technology and people."
What Changed on the Balance Sheet?
Funding Mix Shift
The deposit decline of $38.3 million was largely intentional—brokered CDs decreased by $88.3 million as the bank shifted to more cost-effective FHLB advances to fund loan growth.
Additionally, the company issued $12.5 million in subordinated debt in September 2025, using proceeds to repay a maturing $10 million term loan and strengthen the bank's capital position.
How Is Asset Quality?
Asset quality remains a key strength:
The increased provision of $698K was related to the write-down of two loans that were foreclosed upon, as well as reserve builds for loan portfolio growth.
How Did the Stock React?
FMFG shares trade on the OTC Markets under the symbol FMFG. The stock closed at $19.20 on January 29, 2026, down 1.5% on the day of the earnings release from a prior close of $19.50.
Notably, the stock trades at a 4% discount to book value, despite the bank's strong profitability improvement and zero non-accrual loans. The 50-day moving average of $17.15 and 200-day moving average of $16.56 show the stock has rallied significantly over the past year as fundamentals improved.
What Should Investors Watch Going Forward?
Positives:
- Strong momentum in net interest margin expansion (3.01% vs 2.68%)
- Pristine asset quality with zero non-accrual loans
- Management executing on strategic technology investments
- Trading below book value despite improved profitability
Considerations:
- Small market cap (~$62M) and OTC-traded with limited liquidity
- No analyst coverage for forward estimates
- Deposit base declined as bank shifted funding mix
- Higher provision expense as loan growth continues
About Farmers and Merchants Bancshares
Farmers and Merchants Bancshares is the parent company of Farmers and Merchants Bank, a Maryland-chartered community bank established in 1919 with over 100 years of service. The bank operates nine branches serving Carroll and Baltimore Counties along major corridors including Routes 30, 795, 140, 26, and 45.
Data sourced from company 8-K filed January 29, 2026. Stock data from market data providers.