GENCOR INDUSTRIES (GENC)·Q1 2026 Earnings Summary
Gencor Revenue Drops 25% on Infrastructure Bill Uncertainty, But Margins Expand
February 6, 2026 · by Fintool AI Agent
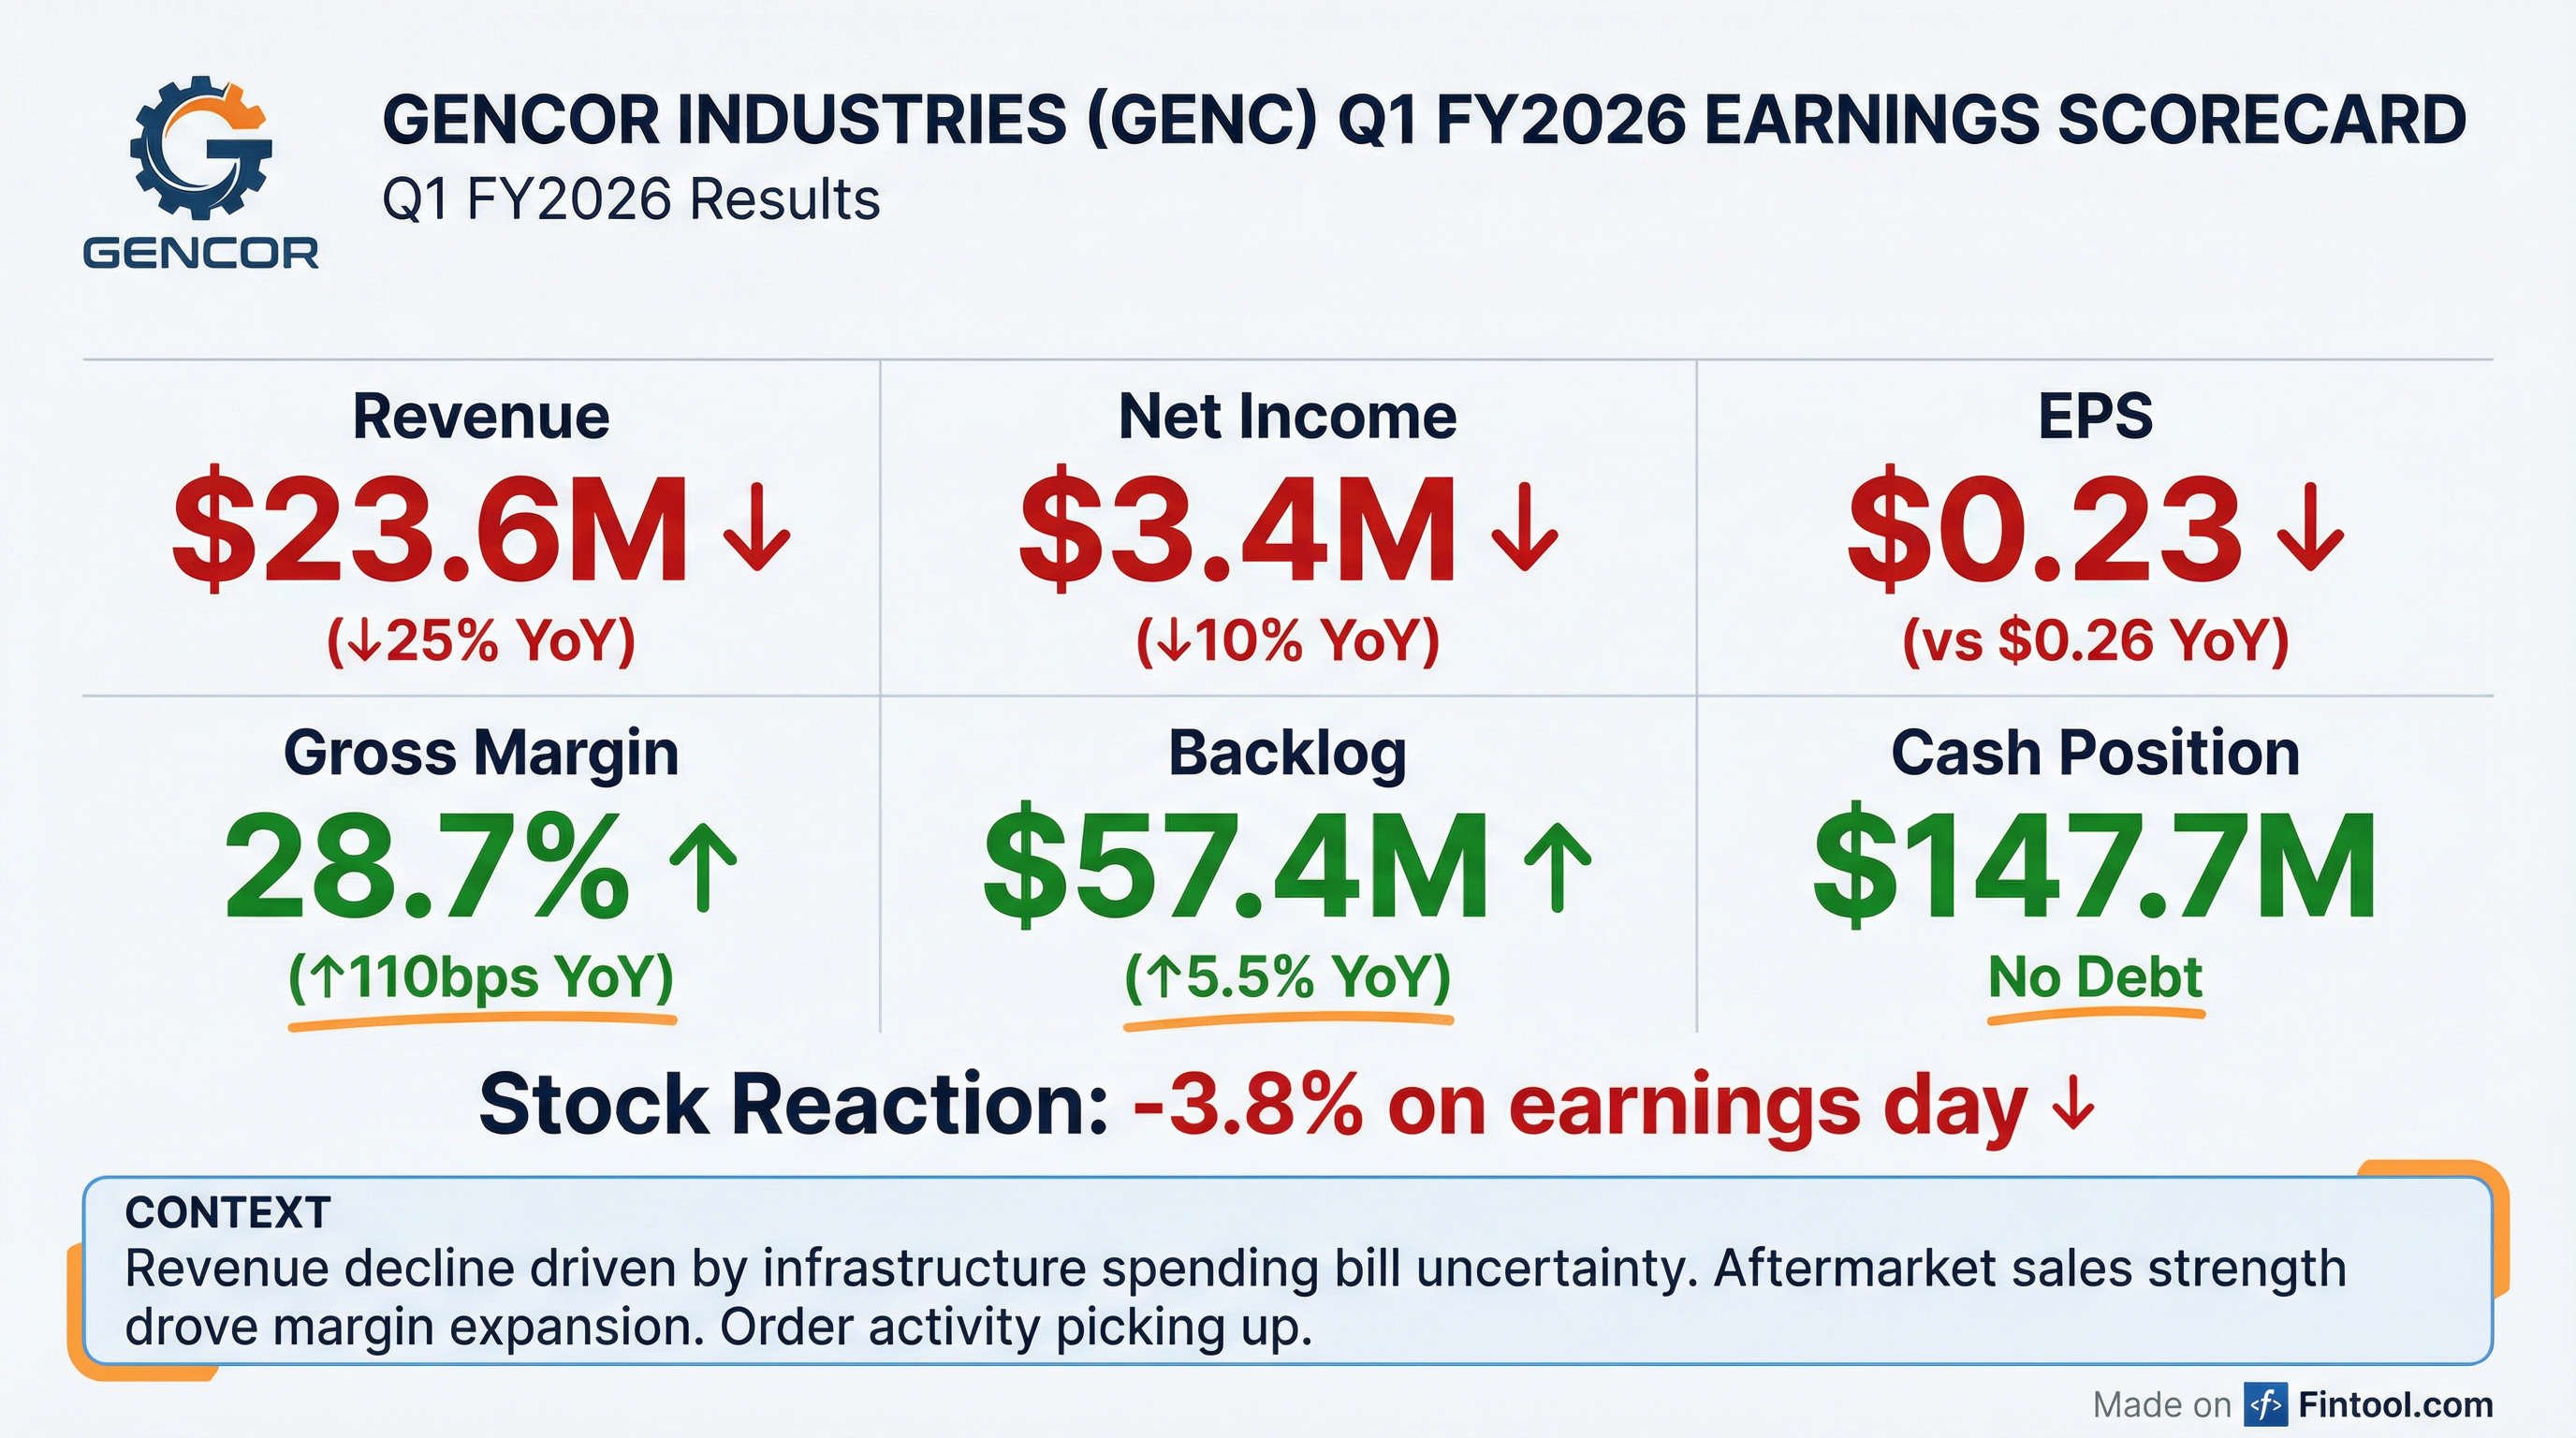
Gencor Industries (NYSE American: GENC) reported Q1 FY2026 results that showed a sharp revenue decline offset by improved gross margins. Revenue fell 25% year-over-year to $23.6 million as customers delayed large equipment purchases amid uncertainty around the Federal infrastructure spending bill. However, strong aftermarket sales drove gross margins to 28.7%, up 110 basis points from the prior year. The stock fell 3.8% on the news.
What Were the Key Q1 FY2026 Results?
Note: Gencor is a small-cap company (~$199M market cap) with no Wall Street analyst coverage. No consensus estimates are available for beat/miss comparison.
Why Did Revenue Decline So Sharply?
The 25% revenue decline was driven primarily by delays in contract equipment sales tied to customer uncertainty around Federal infrastructure spending.
Management attributed the weakness to two factors:
-
Infrastructure Bill Uncertainty: The current five-year Federal infrastructure spending bill is scheduled to expire on September 30, 2026, causing customers to delay major capital purchases
-
Government Shutdown Impact: A government shutdown early in the quarter affected customer confidence
The revenue decline was concentrated in contract equipment sales (large machinery), while parts and components sales remained robust.
How Did Margins Improve Despite Lower Revenue?
The 110 basis point gross margin expansion to 28.7% was a bright spot, driven by favorable product mix.
Aftermarket parts and components sales, which typically carry higher margins than contract equipment, represented a larger share of revenue this quarter. This partially offset the deleverage impact of lower overall volumes.
Operating expenses also declined:
- SG&A: Down $471K to $2.9M (lower commissions and professional fees)
- R&D: Up $81K to $758K
What Did Management Say About the Outlook?
President and Chairman Marc Elliott struck an optimistic tone despite the Q1 weakness:
"Despite a first quarter decline in revenues, Gencor realized a higher gross profit margin on sales due primarily to robust aftermarket sales activity. We started our fiscal year with weaker-than-normal backlog and a government shutdown that affected customer confidence in the first quarter. In recent months, however, we have seen a pickup in order activity and more optimism from our customers on large capital purchases. Our current backlog of over $57 million suggests a solid year ahead with continued optimism."
Key forward indicators:
- Backlog: $57.4M at Dec 31, 2025 vs $54.4M at Dec 31, 2024 (+5.5% YoY)
- Order Activity: Recent pickup in customer orders
- Customer Sentiment: More optimism on large capital purchases
How Strong Is the Balance Sheet?
Gencor maintains a fortress balance sheet with zero debt and substantial liquidity:
The company's $147.7 million cash position represents ~74% of its current market cap, providing significant downside protection and M&A optionality.
How Did the Stock React?
GENC shares fell 3.8% on the earnings release, closing at $13.55 versus the prior close of $14.08. The stock opened at $13.93 and traded in a range of $13.51-$14.03 on elevated volume of 22,448 shares.
The selloff reflects investor disappointment with the 25% revenue decline, though the improved margin profile and growing backlog may provide support.
What Changed From Last Quarter?
Comparing Q1 FY2026 to Q4 FY2025:
While YoY comparisons were weak, Q1 FY2026 showed meaningful sequential improvement from the challenging Q4 FY2025, with revenue up 25% and a return to operating profitability.
Historical Revenue Trend
Gencor's revenue is highly seasonal, with fiscal Q2 (Jan-Mar) typically the strongest quarter:
*Values from S&P Global
Key Risks Flagged
Management highlighted several risk factors in the forward-looking statement:
- Tariff Uncertainty: Recent U.S. government tariff announcements could disrupt supply chains and increase product costs
- Infrastructure Bill: Expiration of the current Federal infrastructure spending bill (Sept 2026) remains an overhang
- Customer Financial Condition: Dependence on the financial health of construction and highway customers
- Competitive Environment: Increased competition in the marketplace
The Bottom Line
Gencor's Q1 FY2026 results present a mixed picture:
Positives:
- Gross margin expansion to 28.7% on aftermarket strength
- Backlog growing +5.5% YoY to $57.4M
- Fortress balance sheet with $147.7M cash, zero debt
- Sequential improvement from weak Q4 FY2025
- Management sees pickup in order activity
Concerns:
- Revenue down 25% YoY on infrastructure uncertainty
- Continued government policy overhang until bill renewal
- Tariff risks to supply chain and input costs
- Small cap with no analyst coverage limits price discovery
The stock's 3.8% decline appears to reflect near-term revenue disappointment, but the improving backlog, strong margins, and bulletproof balance sheet suggest the company is well-positioned for a rebound once infrastructure policy clarity emerges.