IF Bancorp (IROQ)·Q2 2026 Earnings Summary
IF Bancorp Posts Solid Q2 as ServBanc Merger Approaches Closing
January 30, 2026 · by Fintool AI Agent
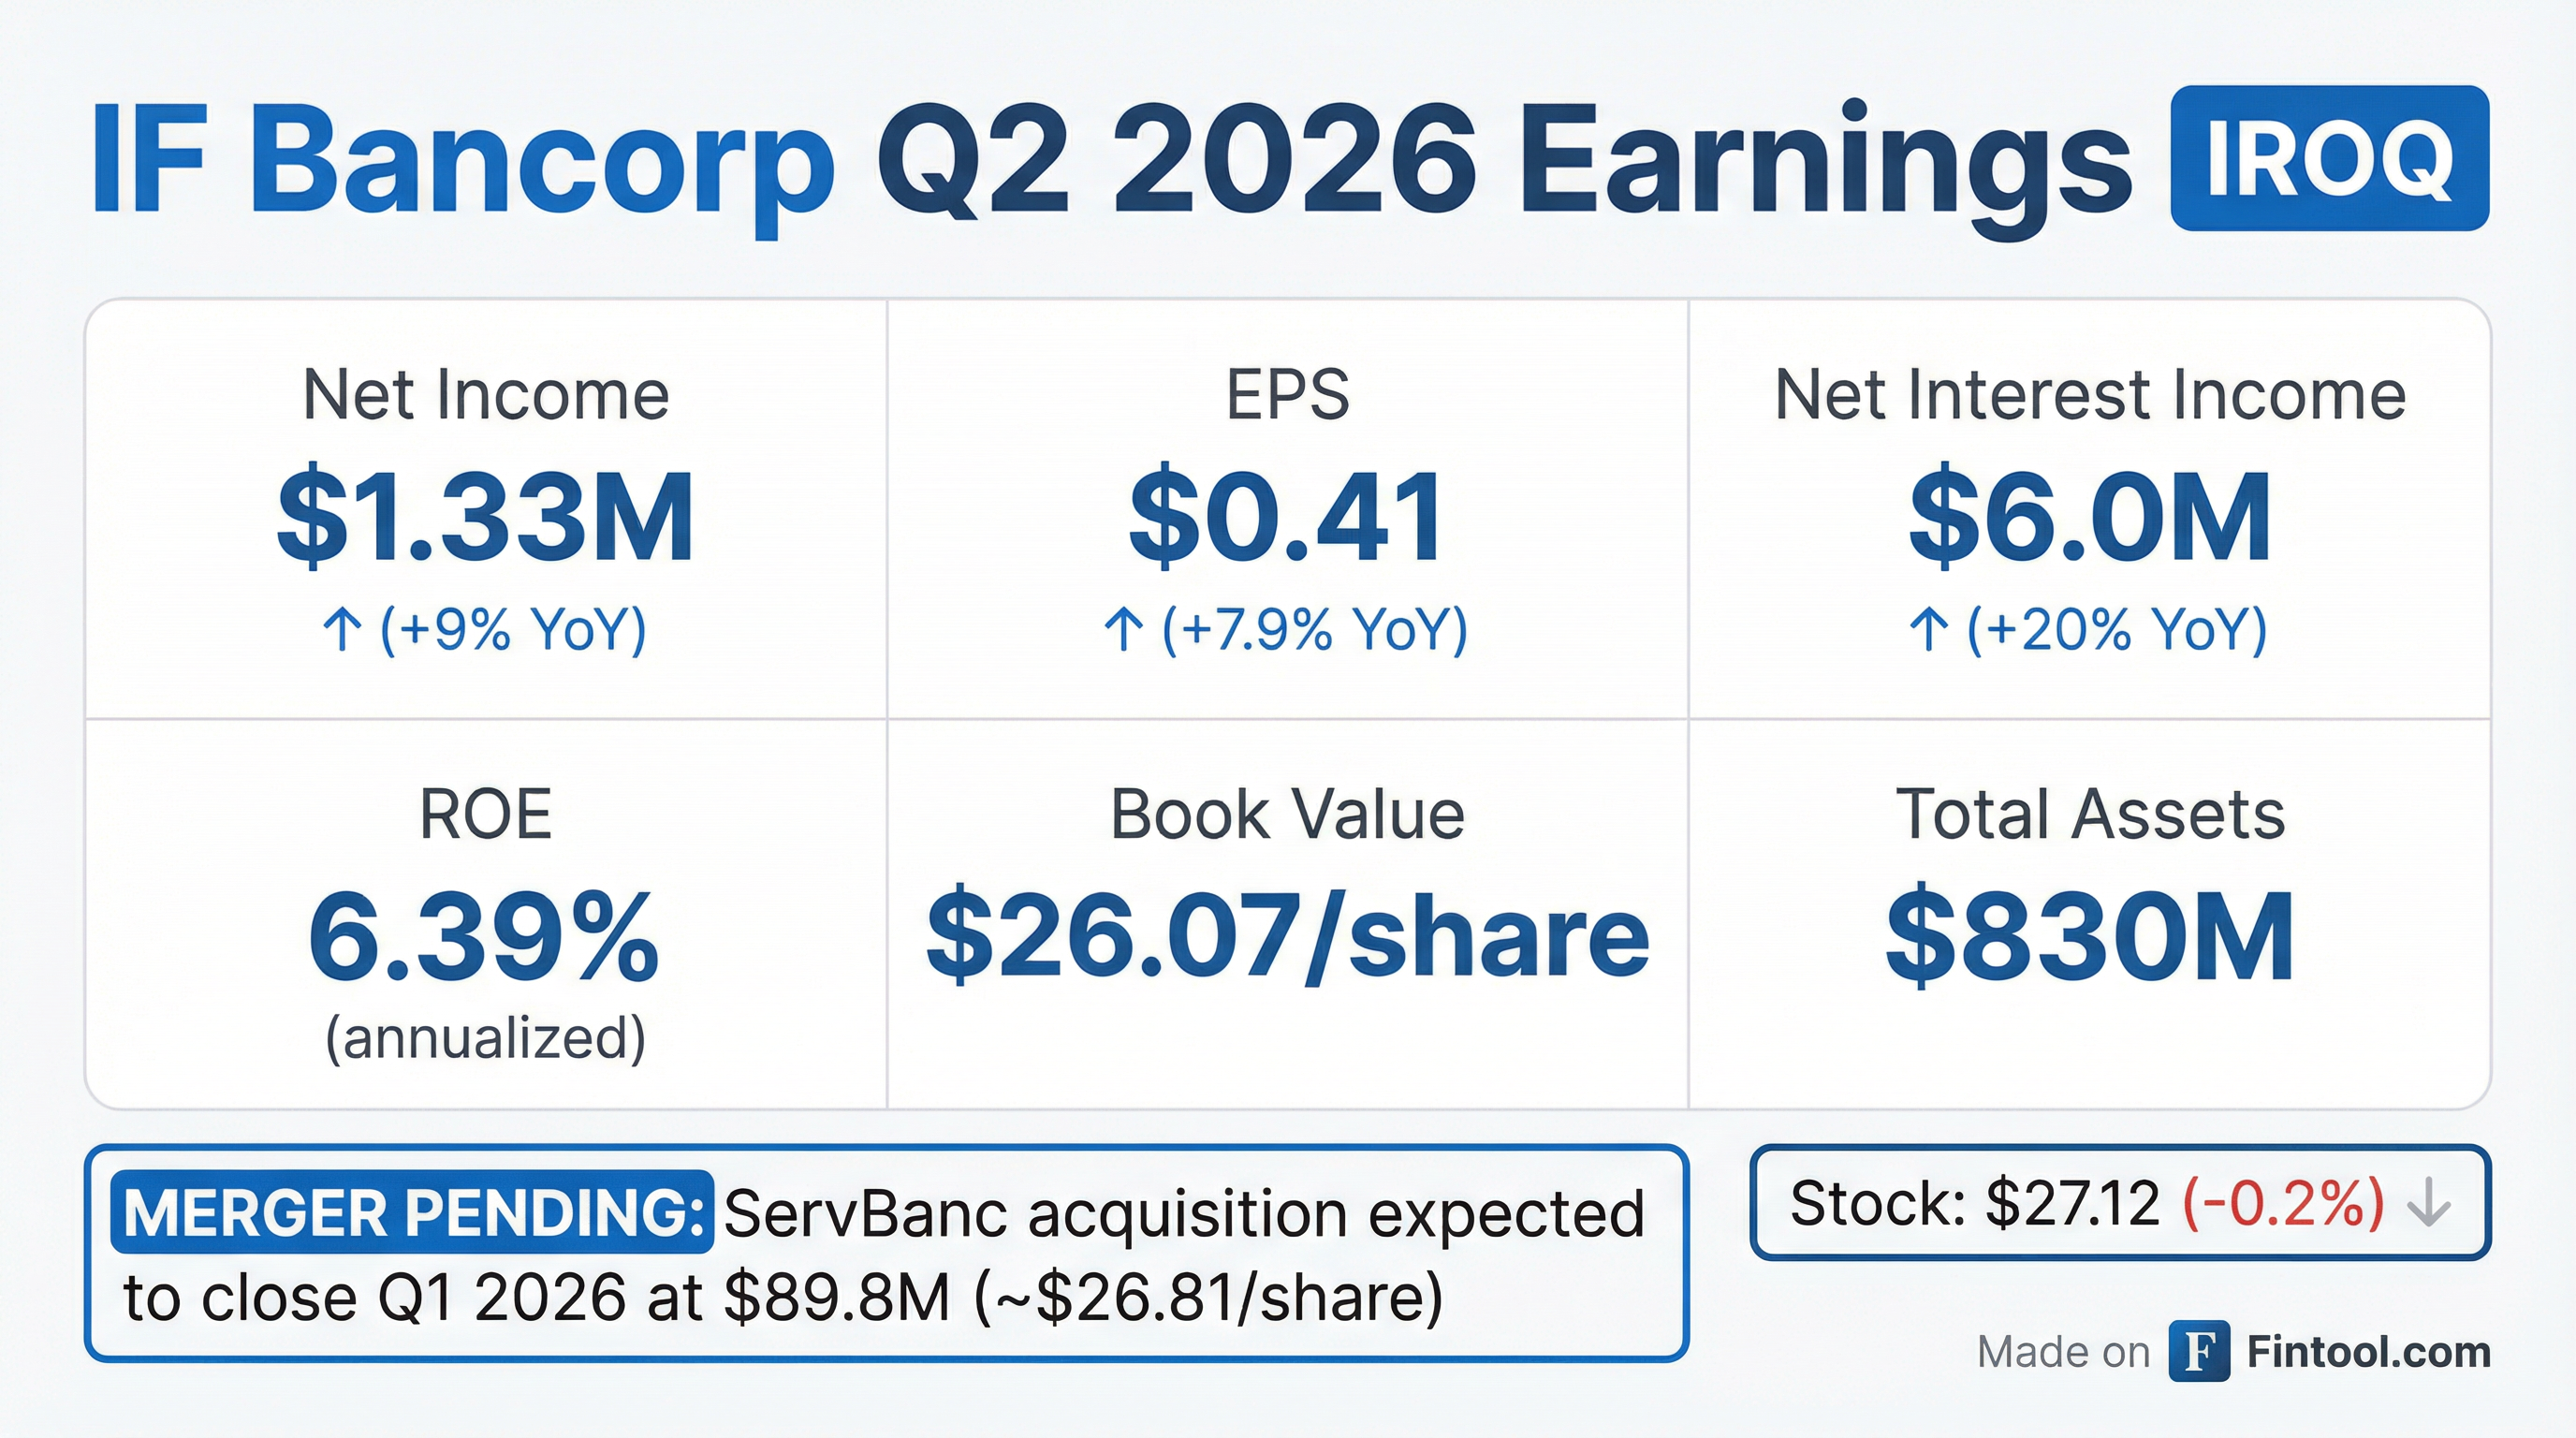
IF Bancorp (NASDAQ: IROQ), the holding company for Iroquois Federal Savings and Loan Association, reported Q2 FY2026 earnings of $0.41 per share, up 7.9% from $0.38 in the year-ago quarter . Net income rose to $1.33 million from $1.22 million . The results mark one of the final quarters before the company's expected acquisition by ServBanc Holdco, with the all-cash merger on track to close in Q1 2026 .
How Did IF Bancorp Perform This Quarter?
The Illinois-based thrift delivered a strong quarter driven by significant net interest margin expansion. Net interest income jumped 20% year-over-year to $6.0 million from $5.0 million , as interest expense declined faster than interest income.
The improvement in net interest margin was notable, expanding to 2.98% on an annualized six-month basis compared to 2.47% for the full prior fiscal year . This reflects the benefit of falling deposit costs in a declining rate environment.
What's Happening With the Balance Sheet?
Total assets declined to $830.4 million from $887.7 million at fiscal year-end, a decrease of 6.5% . The primary drivers were:
- Deposits: Down $71.7 million (-10%) to $649.6 million, largely due to a $59.3 million withdrawal from a public entity that collects real estate taxes
- Net Loans: Down $41.3 million (-6.5%) to $592.3 million
- Cash: Down $11.3 million (-56%) to $8.8 million
Stockholders' equity increased to $87.4 million (+6.8%) driven by net income, improved accumulated other comprehensive income from the securities portfolio, and ESOP activity, partially offset by dividends .
What About Asset Quality?
Non-performing assets increased to $1.98 million (0.24% of assets) from $211,000 (0.02% of assets) at fiscal year-end . While this is a notable increase, the absolute level remains modest. The allowance for credit losses stood at $6.53 million, or 1.09% of total loans .
The company recorded a provision for credit losses of $34,000 in Q2 FY2026, compared to a credit for credit losses of $450,000 in Q2 FY2025 .
What's the Merger Status?
CEO Walter "Chip" Hasselbring commented on the pending transaction: "We continue to execute on our business plan and are pleased with our results for the quarter. As previously announced, we are excited about our pending merger with ServBanc. The transaction remains on track for a first quarter close as previously reported."
Merger Details:
- Acquirer: ServBanc Holdco, Inc.
- Consideration: ~$89.8 million in cash (subject to adjustments)
- Per Share Value: ~$26.81 based on ~3.35 million shares outstanding
- Expected Close: Q1 2026 (pending shareholder approval)
Noninterest expense increased to $5.5 million from $5.0 million year-over-year, primarily due to higher professional services costs related to the merger .
How Did the Stock React?
IROQ shares traded essentially flat at $27.12 (-0.2%) following the release, reflecting the stock's current status as a merger-arbitrage situation. The shares trade at a slight premium to the implied deal value of approximately $26.81 per share.
The stock has rallied approximately 7% since the merger announcement on October 29, 2025, when shares traded around $25.30-$25.88.
What Changed From Last Quarter?
Sequentially, net income and EPS were slightly lower due to the provision for credit losses (vs. credit in Q1) and higher merger-related professional fees.
Historical Performance Trend
*Values retrieved from S&P Global
Key Takeaways
-
Margin Expansion: Net interest margin improved significantly to 2.98% as deposit costs declined faster than asset yields
-
Merger on Track: The ServBanc acquisition remains on schedule for Q1 2026 closing at
$89.8M ($26.81/share) -
Book Value Growth: Book value per share increased 6.8% to $26.07, slightly below the merger price
-
Asset Quality Watch: NPAs increased but remain at manageable levels (0.24% of assets)
-
Deposit Outflow: The large deposit decline was largely seasonal/one-time from public entity tax distribution
IF Bancorp operates seven full-service banking offices in Illinois (Watseka, Danville, Clifton, Hoopeston, Savoy, Bourbonnais, and Champaign) and a loan production office in Missouri .