John Marshall Bancorp (JMSB)·Q4 2025 Earnings Summary
John Marshall Bancorp Posts 27% EPS Jump on 7th Straight Quarter of Margin Expansion
January 28, 2026 · by Fintool AI Agent
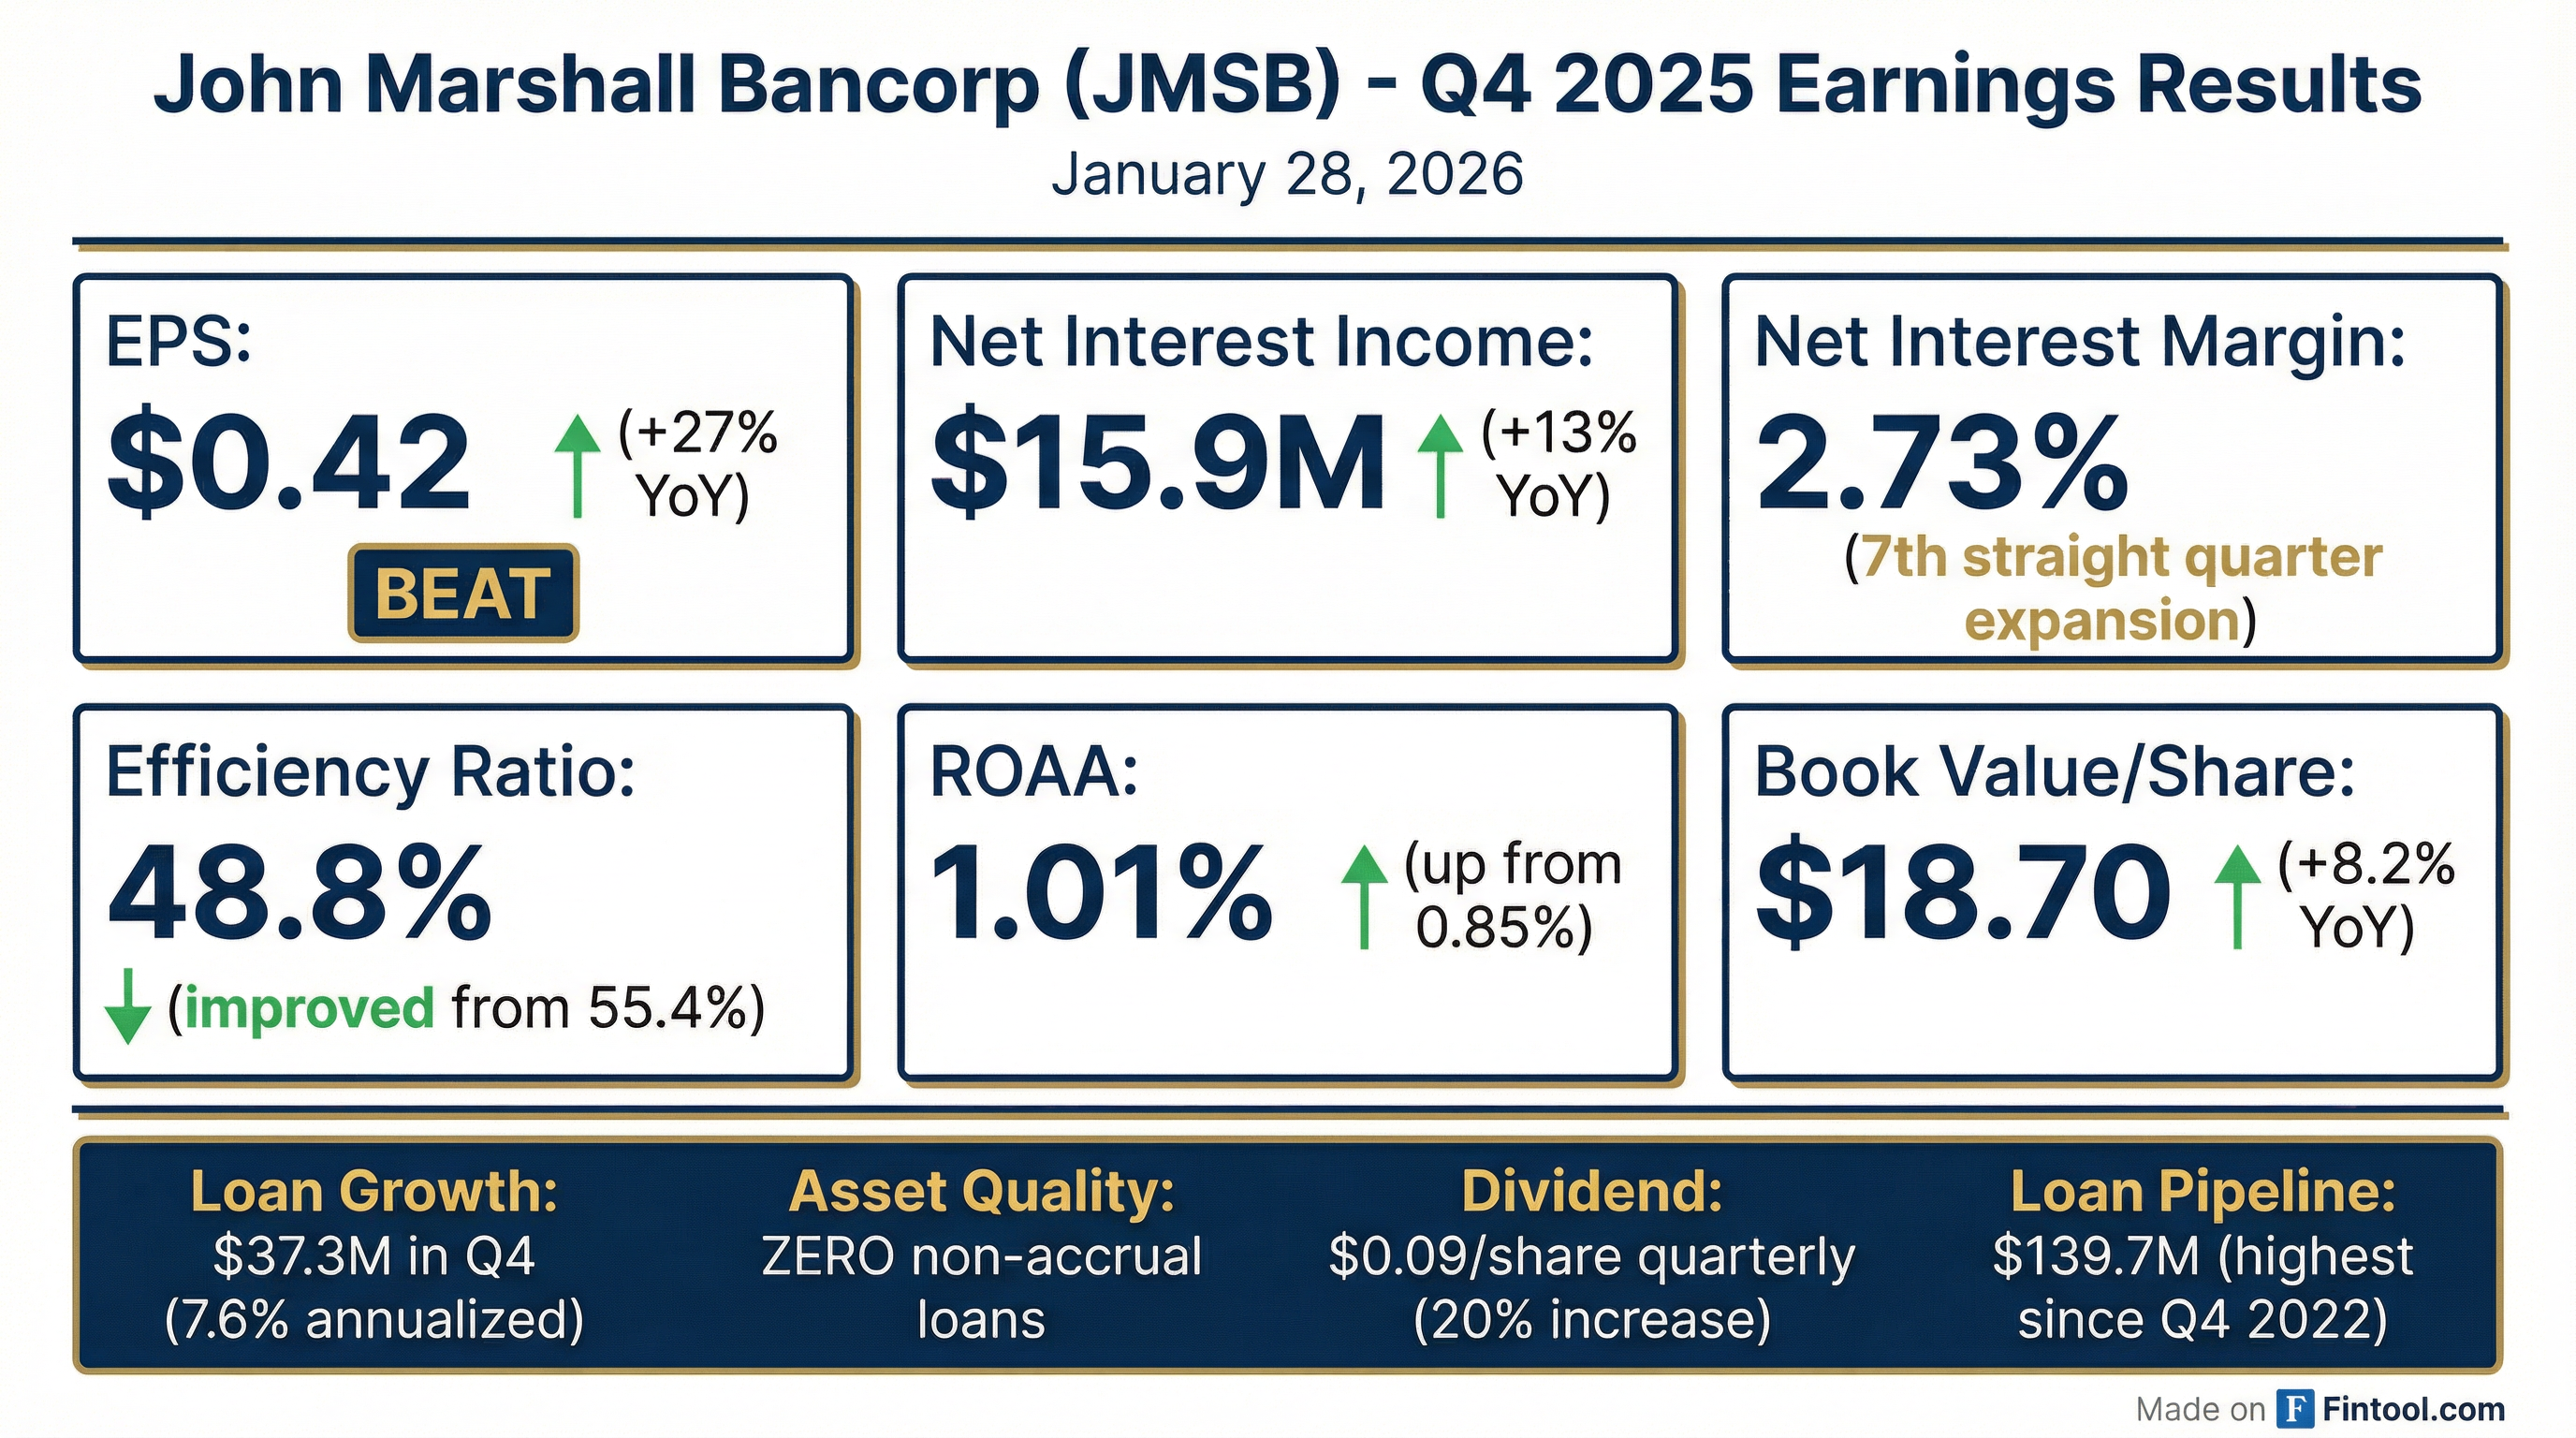
John Marshall Bancorp (NASDAQ: JMSB) delivered its sixth consecutive quarter of net income growth, reporting Q4 2025 diluted EPS of $0.42—up 27% from $0.33 a year ago. Net income reached $5.9 million, a 23.9% increase year-over-year, driven by robust loan demand, continued net interest margin expansion, and disciplined expense management.
The Virginia-based community bank highlighted an exceptional loan pipeline of $139.7 million in new commitments—the highest since Q4 2022—and maintained pristine asset quality with zero non-accrual loans.
Did John Marshall Bancorp Beat Earnings?
Yes—JMSB beat on both revenue and earnings.
The company beat consensus revenue estimates of $15.9M by approximately 2.6%, reflecting better-than-expected net interest income from deposit repricing tailwinds and strong loan volume.
Quarterly Earnings Progression:
Full-year 2025 net income totaled $21.2 million (+24% YoY), with EPS of $1.49 compared to $1.20 in 2024.
What Is Driving JMSB's Margin Expansion?
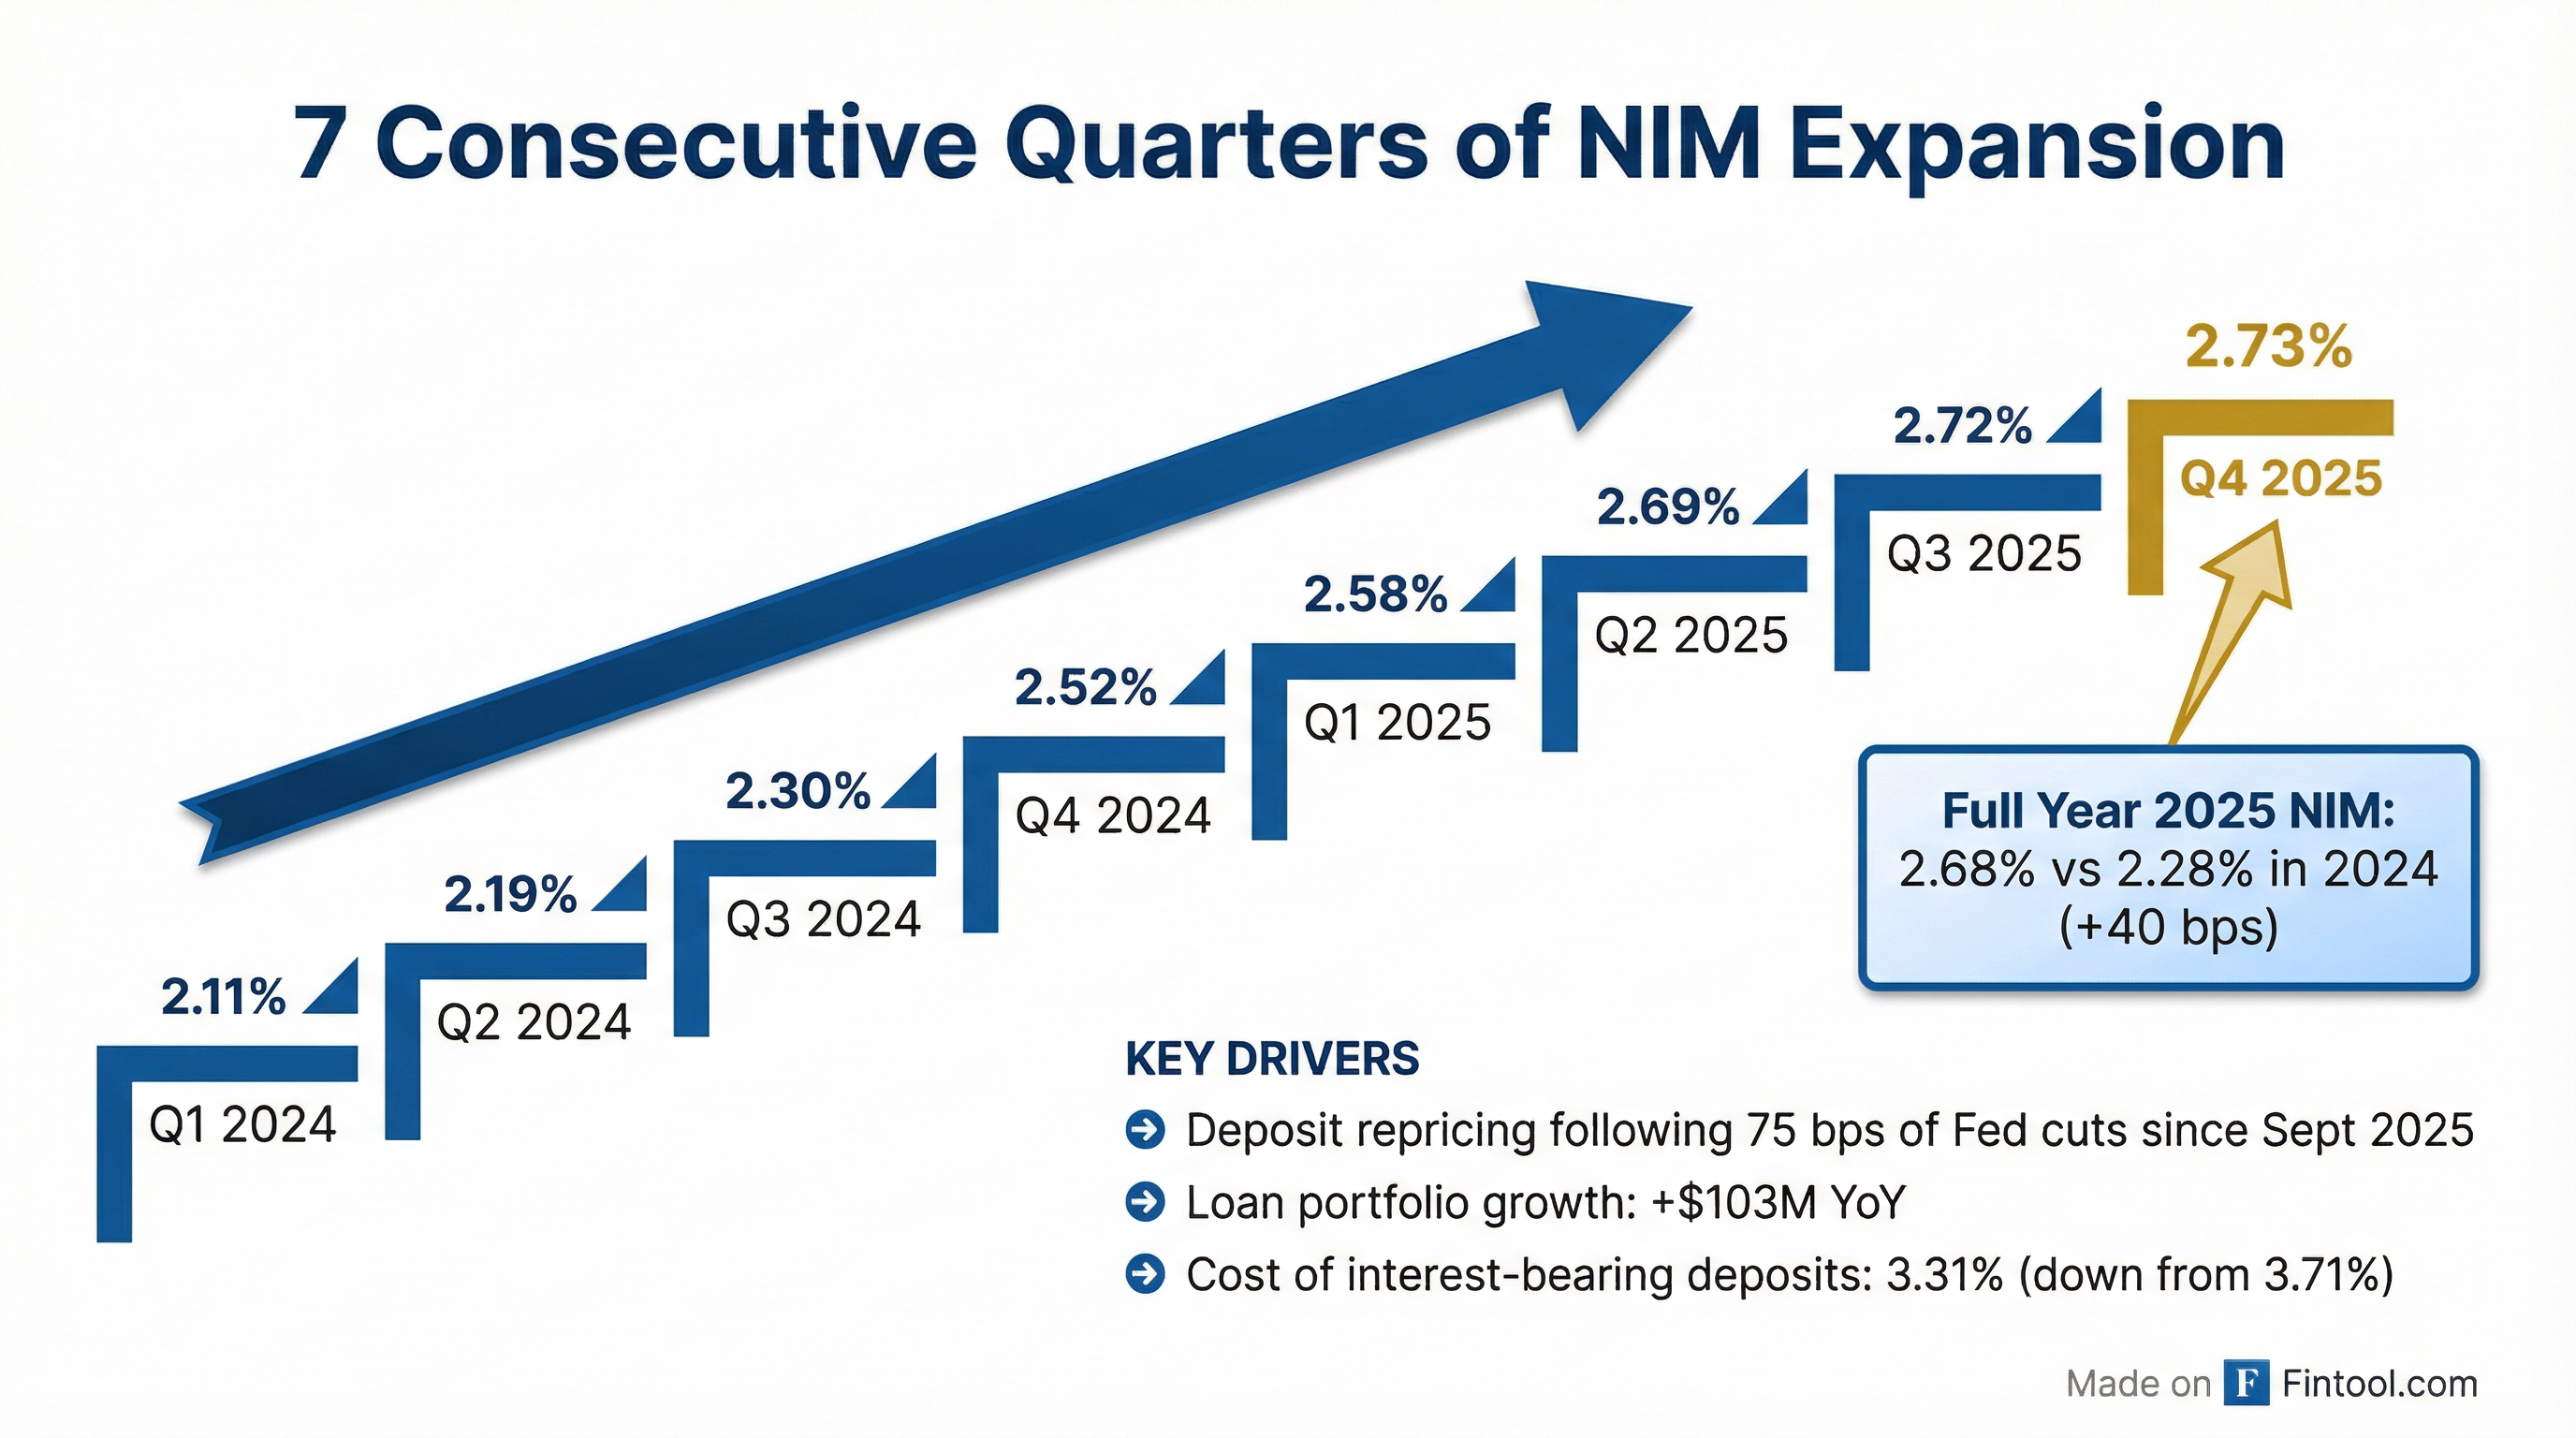
John Marshall Bancorp has now achieved seven consecutive quarters of net interest margin expansion, reaching 2.73% in Q4 2025—up 21 basis points from 2.52% a year ago.
Net Interest Margin Progression:
Key drivers of margin expansion:
-
Deposit repricing: The cost of interest-bearing deposits declined to 3.21% from 3.56% in Q4 2024. Rates fell across all categories—interest-bearing demand (-38 bps), time deposits (-37 bps), and money market accounts (-36 bps).
-
Fed rate cuts: Management has been repricing deposits concurrently with the Fed's 75 basis points of cuts since September 2025. The full benefit has yet to be realized.
-
Loan growth: Average loans increased $107.9 million year-over-year, with higher-yielding construction & development and residential mortgage loans leading the growth.
Full-year 2025 net interest margin was 2.68% compared to 2.28% in 2024—a 40 basis point improvement.
How Strong Is Loan Demand?
JMSB reported exceptional loan growth and a robust pipeline heading into 2026.
The $139.7 million in new loan commitments represents a 46.7% increase from Q3 and is the highest quarterly level since Q4 2022.
Loan Portfolio Composition (Q4 2025):
Construction & development loans showed the strongest growth, increasing from $164.9M in Q4 2024 to $222.7M—a 35% increase.
CEO Chris Bergstrom noted: "We grew our loan portfolio over $103 million in 2025, with 35% of that growth coming in the 4th quarter. The nearly $140 million in loan commitments booked during the quarter should provide a nice tailwind headed into 2026."
What About Asset Quality?
Pristine. John Marshall Bancorp has maintained flawless credit metrics.
The company did charge off $361K on an SBA 7(a) loan (the unguaranteed portion), but has submitted a reimbursement claim for the $1.1 million guaranteed portion and expects full payment in Q1 2026.
The commercial real estate portfolio maintains strong fundamentals:
- Owner-occupied CRE: Weighted average LTV of 36-59%, DSCR of 2.5-3.7x
- Non-owner occupied CRE: Weighted average LTV of 44-71%, DSCR of 1.0-2.3x
How Efficient Is the Bank Operating?
The efficiency ratio improved dramatically to 48.8% in Q4 2025, down from 55.4% a year ago.
Key efficiency drivers:
- Positive operating leverage: Revenues grew 17.5% for full-year 2025 while overhead increased only 5.5%.
- Non-interest expense: $8.0 million in Q4, down $1.1 million (-11.8%) from Q3 2025.
- Lease renegotiations: Occupancy expense declined 21.8% YoY due to more favorable lease terms.
- Headcount: Increased to 139 FTEs from 132, but expense growth was contained.
Did JMSB Change Its Dividend?
Yes—a 20% increase.
The Board declared a quarterly cash dividend of $0.09 per share, payable March 4, 2026 to shareholders of record on February 11, 2026.
This represents a transition from annual dividends ($0.30 in 2025) to quarterly payments, with the annualized $0.36 rate reflecting a 20% increase.
Book value per share increased to $18.70 (+8.2% YoY), and including the $0.30 annual dividend, the total book value return was 10.0%.
How Did the Stock React?
JMSB shares closed at $19.98 on January 27, 2026 (pre-announcement), trading near the middle of its 52-week range of $13.81 to $21.58.
Valuation Metrics:
The stock trades at a modest premium to book value with a below-market P/E multiple, reflecting typical valuations for well-run community banks with strong capital positions.
What's the Capital Position?
John Marshall Bank maintains capital ratios well above regulatory well-capitalized thresholds.
During 2025, the company repurchased 135,640 shares at a weighted average price of $17.80, which was accretive to book value per share.
What Did Management Say About the Outlook?
CEO Chris Bergstrom highlighted several tailwinds for 2026:
"We believe that additional Federal Open Market Committee rate reductions and a continuing normalization of the yield curve could enhance our profitability."
"We believe our fortress balance sheet allows us to focus on continued growth and drive increased returns and shareholder value."
Key forward indicators:
- Loan pipeline: $139.7M in unfunded commitments should drive near-term loan growth
- Deposit repricing: Full benefit of Fed's 75 bps of cuts not yet realized
- Technology investments: Continued investment in tech and personnel to deepen client relationships
- Liquidity: $827M liquidity position (35.6% of assets) plus $110M in federal funds lines
What Changed From Last Quarter?
The biggest positive surprise was the acceleration in loan demand—new commitments nearly doubled from Q2's $95.2M—and the sharp improvement in operating efficiency as expense growth moderated significantly.
Key Risks and Concerns
-
Geographic concentration: JMSB operates exclusively in the Washington, D.C. metropolitan area, with exposure to federal government spending and workforce changes.
-
Commercial real estate: Non-owner occupied office represents $105M (5.3% of loans), though geographic mix is diversified (64% Virginia, 22% Maryland, 13% DC).
-
Rate sensitivity: While positioned to benefit from Fed cuts, a rapid reversal in rates could compress margins.
-
Competition: The bank faces competition from both larger regional banks and fintech entrants in the D.C. market.
The Bottom Line
John Marshall Bancorp delivered a strong Q4 with accelerating earnings momentum, exceptional loan demand, and pristine credit quality. The 7th consecutive quarter of margin expansion—combined with a 48.8% efficiency ratio—demonstrates disciplined execution in a challenging rate environment.
Key takeaways:
- ✅ EPS up 27% YoY to $0.42 (6th consecutive quarter of net income growth)
- ✅ NIM at 2.73% (7th straight quarter of expansion)
- ✅ Loan pipeline $139.7M—highest since Q4 2022
- ✅ Zero non-accrual loans
- ✅ Dividend increased 20%, now quarterly
- ✅ Efficiency ratio improved to 48.8%
With a fortress balance sheet (16.3% total capital ratio), ample liquidity, and a strong loan pipeline, JMSB appears well-positioned to continue delivering profitable growth in 2026.
Data sourced from JMSB's Form 8-K filed January 28, 2026. Market data as of January 27, 2026.
View JMSB Research | View Q4 2025 Transcript | View Q3 2025 Earnings