O REILLY AUTOMOTIVE (ORLY)·Q4 2025 Earnings Summary
O'Reilly Auto Misses EPS as Healthcare Costs Surge, Stock Falls 4%
February 5, 2026 · by Fintool AI Agent
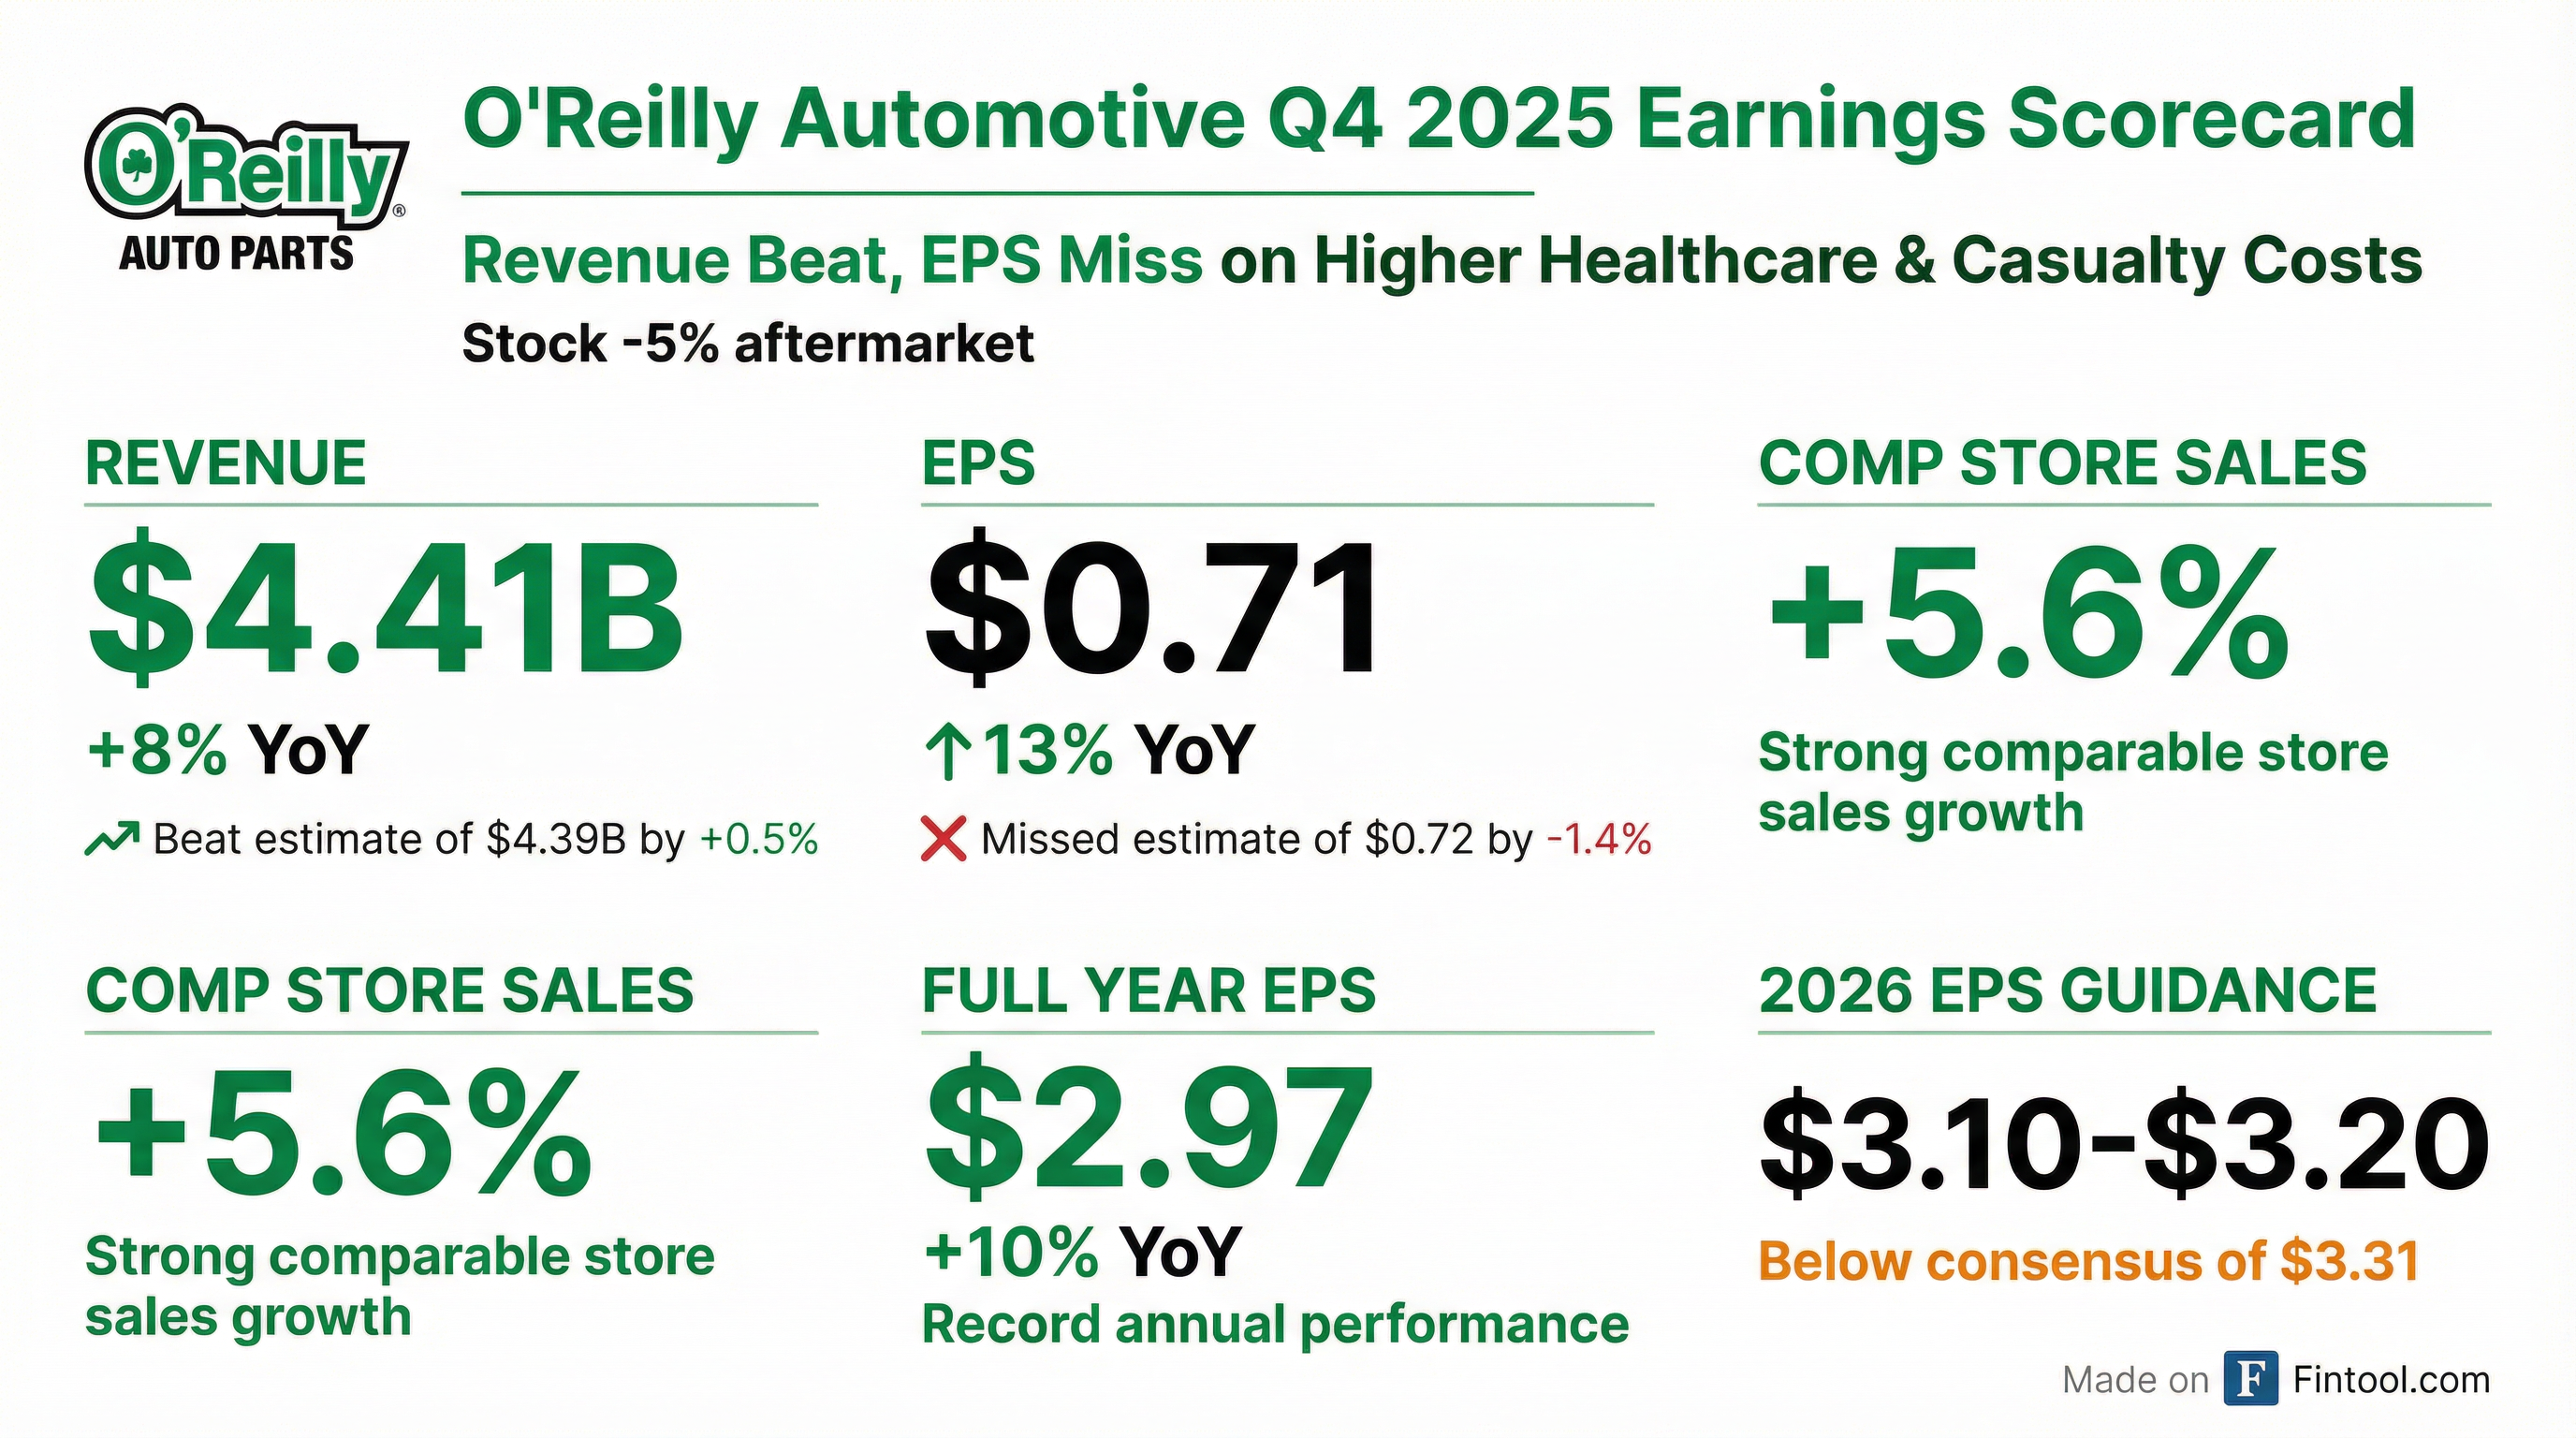
O'Reilly Automotive reported Q4 2025 results with a slight revenue beat but EPS miss that sent shares down 4% following the earnings call. Despite delivering the strongest comparable store sales quarter of the year at +5.6%—with professional customer growth exceeding 10% for the second consecutive quarter—and marking 33 consecutive years of comp growth, the company fell short on the bottom line due to elevated healthcare and casualty claim costs.
CEO Brad Beckham opened the call noting this represents "33rd consecutive year of annual comparable store sales increases and record levels of revenue, operating income, and EPS." Yet the stock dropped from $96.74 pre-earnings to $93.09—a sharp reaction to 2026 EPS guidance that came in 5% below Street expectations.
Did O'Reilly Beat Earnings?
Revenue: Beat — $4.41B actual vs $4.39B consensus (+0.5%)*
EPS: Missed — $0.71 actual vs $0.72 consensus (-2.0%)*
*Values retrieved from S&P Global
The beat on revenue and healthy gross margin expansion (+49bps YoY) was overshadowed by the EPS miss. CFO Brent Kirby noted: "SG&A expense as a percent of sales was 33.0%, down 25 basis points from the fourth quarter of 2024" but this was only due to a favorable comparison against a one-time $35M charge in Q4 2024.
Per-store SG&A growth of 3.3% exceeded expectations, driven by "heightened cost inflation in our self-insurance programs, including headwinds in team member healthcare cost, workers' compensation and general claims expenses, litigation cost, and auto liability reserves."
What Did Management Guide?
O'Reilly's 2026 guidance came in below consensus across most metrics, the likely driver of the selloff:
*Values retrieved from S&P Global
The EPS guidance midpoint of $3.15 represents just 6% growth vs. the 10% delivered in FY 2025—a notable deceleration. Management explicitly flagged a ~$0.04 EPS headwind from a higher effective tax rate (22.6% vs 21.7% in 2025).
Critical cadence guidance from the call:
CEO Beckham outlined clear H1 vs H2 expectations:
"Based on the same-SKU inflation dynamics I outlined earlier, we would anticipate the first half of the year to generate a strong comp at the high end of our guidance range, with the back half of the year reflecting the more challenging comparisons."
This is because:
- H1 2026: Will calendar the period before tariff cost increases, capturing inflation benefit
- H2 2026: Will face tougher comps against tariff-driven price increases that ramped in H2 2025
Same-SKU inflation ran ~6% in Q4 2025 but will decline to ~3% for the full year 2026—similar to 2025's level but front-loaded.
How Did the Stock React?
The stock gapped down at the open (from $96.74 to $93.07) and traded in a narrow range throughout the session. The 3.8% decline represents a loss of approximately $3B in market cap.
The reaction appears driven by:
- EPS miss breaking a multi-quarter beat streak ($0.71 actual vs $0.72 consensus)
- 2026 EPS guidance 5% below consensus ($3.10-$3.20 vs $3.31 Street)
- SG&A concerns flagged again—management explicitly said these costs "exceeded expectations" for the third consecutive quarter
What Changed From Last Quarter?
What improved:
- Comp store sales accelerated to the best quarter of the year (+5.6% vs +4.7%)
- Professional side maintained over 10% growth for 2nd consecutive quarter
- Winter weather categories performed well despite tough prior-year comps
- DIY traffic trends stabilized (no further deterioration)
What deteriorated:
- SG&A expenses jumped 100bps YoY as a percentage of sales
- Operating margin contracted despite strong top line
- Healthcare, workers' comp, general claims, litigation costs, and auto liability reserves all pressured
- Per-store SG&A up 3.3% in Q4, above expectations
Key Management Quotes
CEO Brad Beckham on the record year:
"Our 2025 results represent our 33rd consecutive year of annual comparable store sales increases and record levels of revenue, operating income, and EPS. This remarkable track record of strong, consistent earnings growth is a reflection of the effectiveness of Team O'Reilly's customer service-oriented culture and our focus on profitable, sustainable growth."
On SG&A headwinds:
"We unfortunately also faced substantial cost pressures in 2025, including headwinds reflected in our fourth quarter results, primarily from rising costs related to our team member healthcare and self-insurance programs. We are certainly not pleased that these headwinds dampened an otherwise strong finish for our company in 2025."
Brent Kirby on professional business strength:
"The value proposition we are creating for our customers is clearly distinguishing O'Reilly as the preferred partner to the professional service provider."
CFO Jeremy Fletcher on 2026 guidance:
"For the back half of 2026, we expect growth in average ticket to reflect muted inflation and a more substantial benefit from increasing parts complexity."
Q&A Highlights
On how long healthcare/SG&A pressures will persist:
Analyst Scott Ciccarelli (Truist) asked how long elevated healthcare and casualty costs could run. CFO Jeremy Fletcher responded: "The pressure that we've seen has persisted longer than we would normally expect and has been a little bit of a story of increases on top of increases that we thought were already pretty dramatic. So we do have a little bit of a cautious posture... particularly as we think about the first part of the year where we're not up against as easy of a comparison."
On the Virginia DC opportunity:
CEO Brad Beckham was enthusiastic about the Mid-Atlantic expansion: "Depending on where you draw the line there in the upper Mid-Atlantic between Virginia and getting all the way through New York City, you can almost come up with a third of the population of the U.S. and all the vehicles to go along with it, all the market share to go along with it."
On the hub-and-spoke model: "Once you build that DC out, once you build out the store network that'll service that greater Washington, D.C. market basically every hour on the hour in that greater metro area, which provides just an unbelievable advantage over most every competitor we have, if not all of them."
On tariffs and pricing:
When asked about potential tariff rollbacks creating deflation, CFO Fletcher noted: "Historically, our industry has been pretty disciplined and pretty rational in hanging on to prices once we pass them through... those are pretty hard-won pricing increases."
President Brent Kirby added: "We still believe that there's an environment out there with the administration that's focused on tariffs. And whether the first method worked, we feel like there's other levers that can be pulled."
On DIY consumer trends:
On whether the DIY consumer is weakening further: "Q4 was really similar to what we saw last quarter on the larger ticket jobs... though we did see some pretty good signs there in December as some of the winter weather started to kick in."
Regarding tax season impact: "Every tax season's a little bit different. It's normally a busy time for us... we still kind of want to wait and see just kind of how that really plays out across the different income levels."
On market share position:
On competitive positioning even in mature markets: "Even when I look at our business here in Missouri or Oklahoma, Kansas, Arkansas, down in Texas, we still have so much market share to go get... We still have roughly 10% share in this $170 billion industry."
Segment Performance
O'Reilly serves two primary customer segments—DIY (do-it-yourself) and Professional—with notably different dynamics in Q4:
Key segment insights from the call:
-
Professional strength continues: CEO Beckham noted "growth in our professional business was the stronger driver of our sales results, with an increase in comparable store sales of over 10% for the second consecutive quarter."
-
DIY stabilizing, not accelerating: "We saw stabilization in the demand backdrop in our DIY business, including some modest improvements in DIY transactions month-to-month... we still experienced some pressure that resulted in slightly negative traffic comps."
-
Discretionary categories remain weak: "This was most evident in the small subset of our DIY business that is highly discretionary in nature, including categories like appearance and accessories."
-
Average ticket dynamics: Average ticket grew mid-single digits on both sides, driven by ~6% same-SKU inflation, partially offset by mix headwinds.
2026 outlook by segment:
- Professional: Expect continued share gains but "some moderation in ticket growth as we compare against the high bar we have set"
- DIY: Transaction counts expected to remain "slightly negative as a result of the long-term industry trend of better engineered and manufactured parts and extended service and repair intervals"
Capital Allocation
O'Reilly continues its aggressive capital return program:
Since inception in January 2011, O'Reilly has repurchased 1.5 billion shares at an average price of $18.77 for a total of $27 billion—a testament to the company's consistent cash generation and shareholder-friendly approach.
CFO Fletcher noted: "We remain very confident that the average repurchase price is supported by the expected discounted future cash flows of our business, and we continue to view our buyback program as an effective means of returning excess capital to our shareholders."
Note: Share and price data reflect the 15-for-1 stock split completed in June 2025.
Store Expansion & Distribution
Virginia DC: A Major Growth Unlock
The Stafford, Virginia distribution center opened in Q4 2025 and represents O'Reilly's most significant expansion opportunity in years. Key details from the call:
-
Massive addressable market: "Depending on where you draw the line there in the upper Mid-Atlantic between Virginia and getting all the way through New York City, you can almost come up with a third of the population of the U.S."
-
Service model: The DC will support 5-night-a-week replenishment within ~200 miles, plus hourly delivery runs in the greater DC metro area.
-
Hub network buildout: Management plans to deploy their hub-and-spoke model with well over 150,000 SKUs available once fully built out.
-
Next DC: Fort Worth, Texas DC expected operational in Q1 2028, expanding capacity in core mature markets.
International Expansion:
-
Canada: First greenfield location opened in Q4 2025; a handful of 2026 openings expected as "we see the early fruits from the development of our organic growth machine in this expansion market."
-
Mexico: ~25 stores added in 2025, similar growth expected in 2026. The business is transitioning away from a distribution model to independent jobbers toward company-operated stores, creating a gross margin tailwind but SG&A headwind.
Financial Trends (8 Quarters)
Q4 has historically been O'Reilly's weakest quarter for operating margins due to seasonality—this pattern continued in 2025. For the full year, operating profit was $3.5B, up 6.4% YoY, with operating margin flat at 19.5%.
Risks and Concerns
1. Persistent SG&A Inflation Healthcare and casualty claim costs have been flagged in consecutive quarters. CFO Fletcher acknowledged on the call: "The pressure that we've seen has persisted longer than we would normally expect." Management is guiding SG&A per store growth of 3-4% in 2026 with explicit "cautiousness" about potential continued pressure.
2. Limited Levers to Control Costs When asked about cost control levers, Fletcher was candid: "It's been a big focus. A big part of how we run our business has been for a long, long time... we don't have, I think, a lot of easy and quick levers to reduce what's something that has always been, I think, a key management item for us."
3. DIY Consumer Pressure The lower-income DIY consumer remains pressured. Management noted "we continue to be cautious regarding the impact to consumers from broad-based inflation and macroeconomic pressures" and expects slightly negative DIY transaction counts in 2026.
4. Tariff Policy Uncertainty Management's guidance assumes "a stable cost and price inflation environment" with "normal puts and takes" and explicitly does not include "projections for volatility related to changes in tariffs in either direction." If tariffs escalate, cost pressures could increase; if rolled back, industry pricing discipline could be tested.
5. Decelerating EPS Growth FY 2025 delivered 10% EPS growth; 2026 guidance implies just 5-8% growth at the midpoint. This is further pressured by a higher effective tax rate (22.6% vs 21.7%), contributing ~$0.04 EPS headwind.
Forward Catalysts
- Store Expansion Acceleration: 225-235 net new stores planned for 2026 vs 207 in 2025
- Virginia DC Ramp: New Stafford DC opens up the lucrative Mid-Atlantic/I-95 corridor with "a third of the U.S. population"
- Fort Worth DC: Expected operational Q1 2028, expanding capacity in core Texas markets
- Professional Segment: Management expects continued share gains despite tough comparisons
- Share Repurchases: $2.26B remaining authorization; ~23M shares repurchased in 2025 at avg $92.26
- Tax Season: Potential catalyst if tax refunds drive DIY demand improvement in Q1
- Q1 2026 Earnings: Expected April 2026
Bottom Line
O'Reilly delivered its 33rd consecutive year of comparable store sales growth with a strong Q4 comp of +5.6%—led by Professional customer growth exceeding 10% for the second consecutive quarter—but elevated healthcare and casualty costs drove an EPS miss and softer 2026 guidance. The 4% stock decline reflects disappointment with EPS guidance coming in 5% below consensus expectations.
The bull case: O'Reilly continues to take market share on both sides of the business, even in mature markets where they still have "so much market share to go get" with only ~10% of a $170B industry. The Virginia DC opens up a massive growth opportunity in the Mid-Atlantic. Free cash flow remains robust ($1.6B in 2025) and the buyback machine continues ($2.1B in 2025).
The bear case: SG&A pressures have "persisted longer than we would normally expect" with "increases on top of increases." Management is explicitly guiding SG&A per store growth of 3-4% in 2026 with a "cautious posture" on self-insurance costs. The DIY consumer remains pressured, with slightly negative traffic comps expected to continue.
Key debate: Is the cost inflation transitory (management's hopeful view) or structural? CFO Fletcher acknowledged: "It's a little bit hard to completely troubleshoot that... we understand at some point the base of that cost inflation builds up, and we expect it to moderate and kind of stabilize over the course of time."
Data as of February 5, 2026. Stock prices reflect post-split values following the 15-for-1 split in June 2025.
View company profile | Read Q4 2025 earnings transcript | Prior earnings