ORRSTOWN FINANCIAL SERVICES (ORRF)·Q4 2025 Earnings Summary
Orrstown Financial Q4 2025: EPS Beat, Dividend Raised as Profitability Remains Strong
January 28, 2026 · by Fintool AI Agent
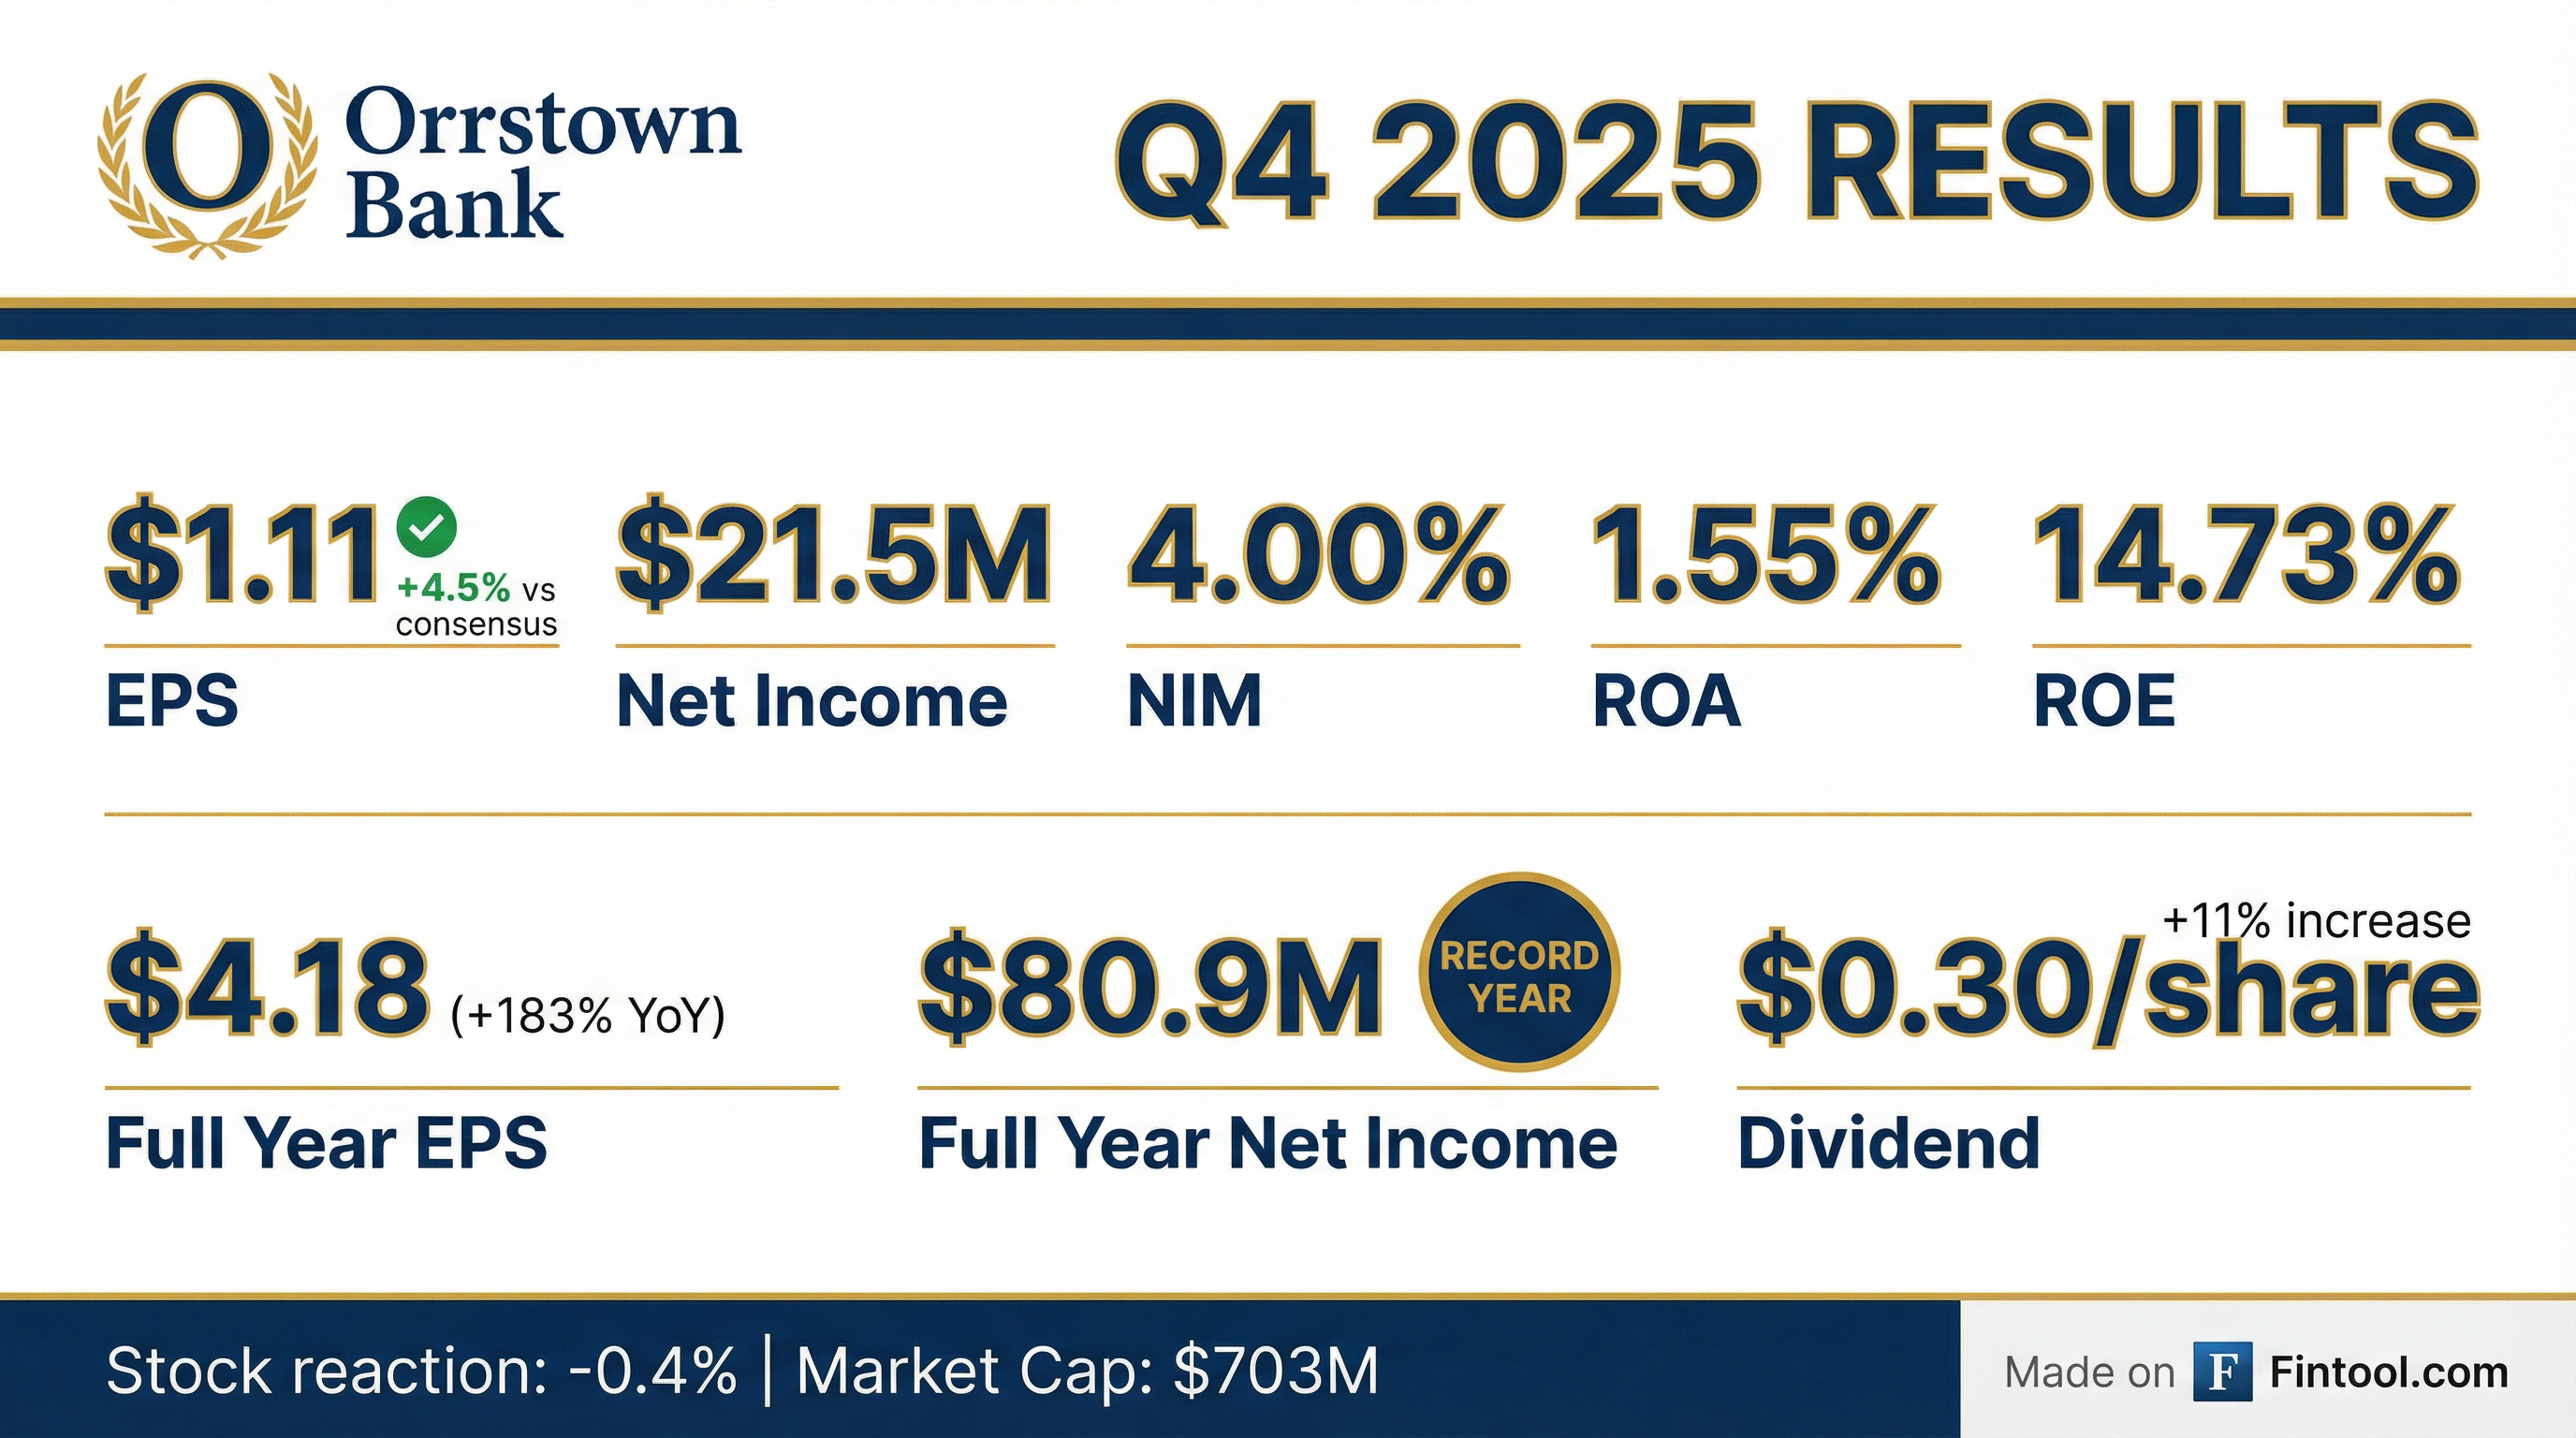
Orrstown Financial Services (NASDAQ: ORRF) reported Q4 2025 results that exceeded EPS expectations while posting a modest revenue miss. Diluted EPS of $1.11 beat the $1.06 consensus estimate by 4.5%, though net interest income declined sequentially as the net interest margin compressed 11 basis points to 4.00% . The community bank achieved the highest reported annual net income in its 106-year history at $80.9 million ($4.18/share) and raised its quarterly dividend for the fourth time in 18 months to $0.30 per share .
Did Orrstown Beat Earnings?
EPS beat, revenue missed. The quarter delivered mixed results relative to consensus:
*Values retrieved from S&P Global
The EPS beat was driven by fee income strength and continued expense discipline, offsetting pressure on net interest income. Adjusted metrics show no non-GAAP adjustments were needed in Q4 2025, as merger-related costs from the Codorus Valley acquisition were fully absorbed in prior quarters .
Year-over-year comparison tells the real story. Net income surged 57% to $21.5M from $13.7M in Q4 2024 (GAAP basis), or 29% from the $16.7M adjusted figure that excluded merger costs .
What Changed From Last Quarter?
Q4 marked a step down from Q3's record profitability, though metrics remain healthy:
Key drivers of sequential changes:
- NIM compression (-11 bps): Earning asset yields fell as short-term rates declined, while deposit repricing lagged. Purchase accounting accretion also decreased from $5.8M to $5.3M quarter-over-quarter
- Fee income strength (+$1.0M): Wealth management fees increased $0.5M on organic growth and market performance; swap fees rose $0.3M
- Higher expenses (+$1.1M): Elevated healthcare costs (+$0.6M) and professional services for internal projects (+$0.2M) drove the increase
What Did Management Guide?
Management provided comprehensive 2026 guidance, signaling confidence in the franchise while acknowledging margin headwinds:
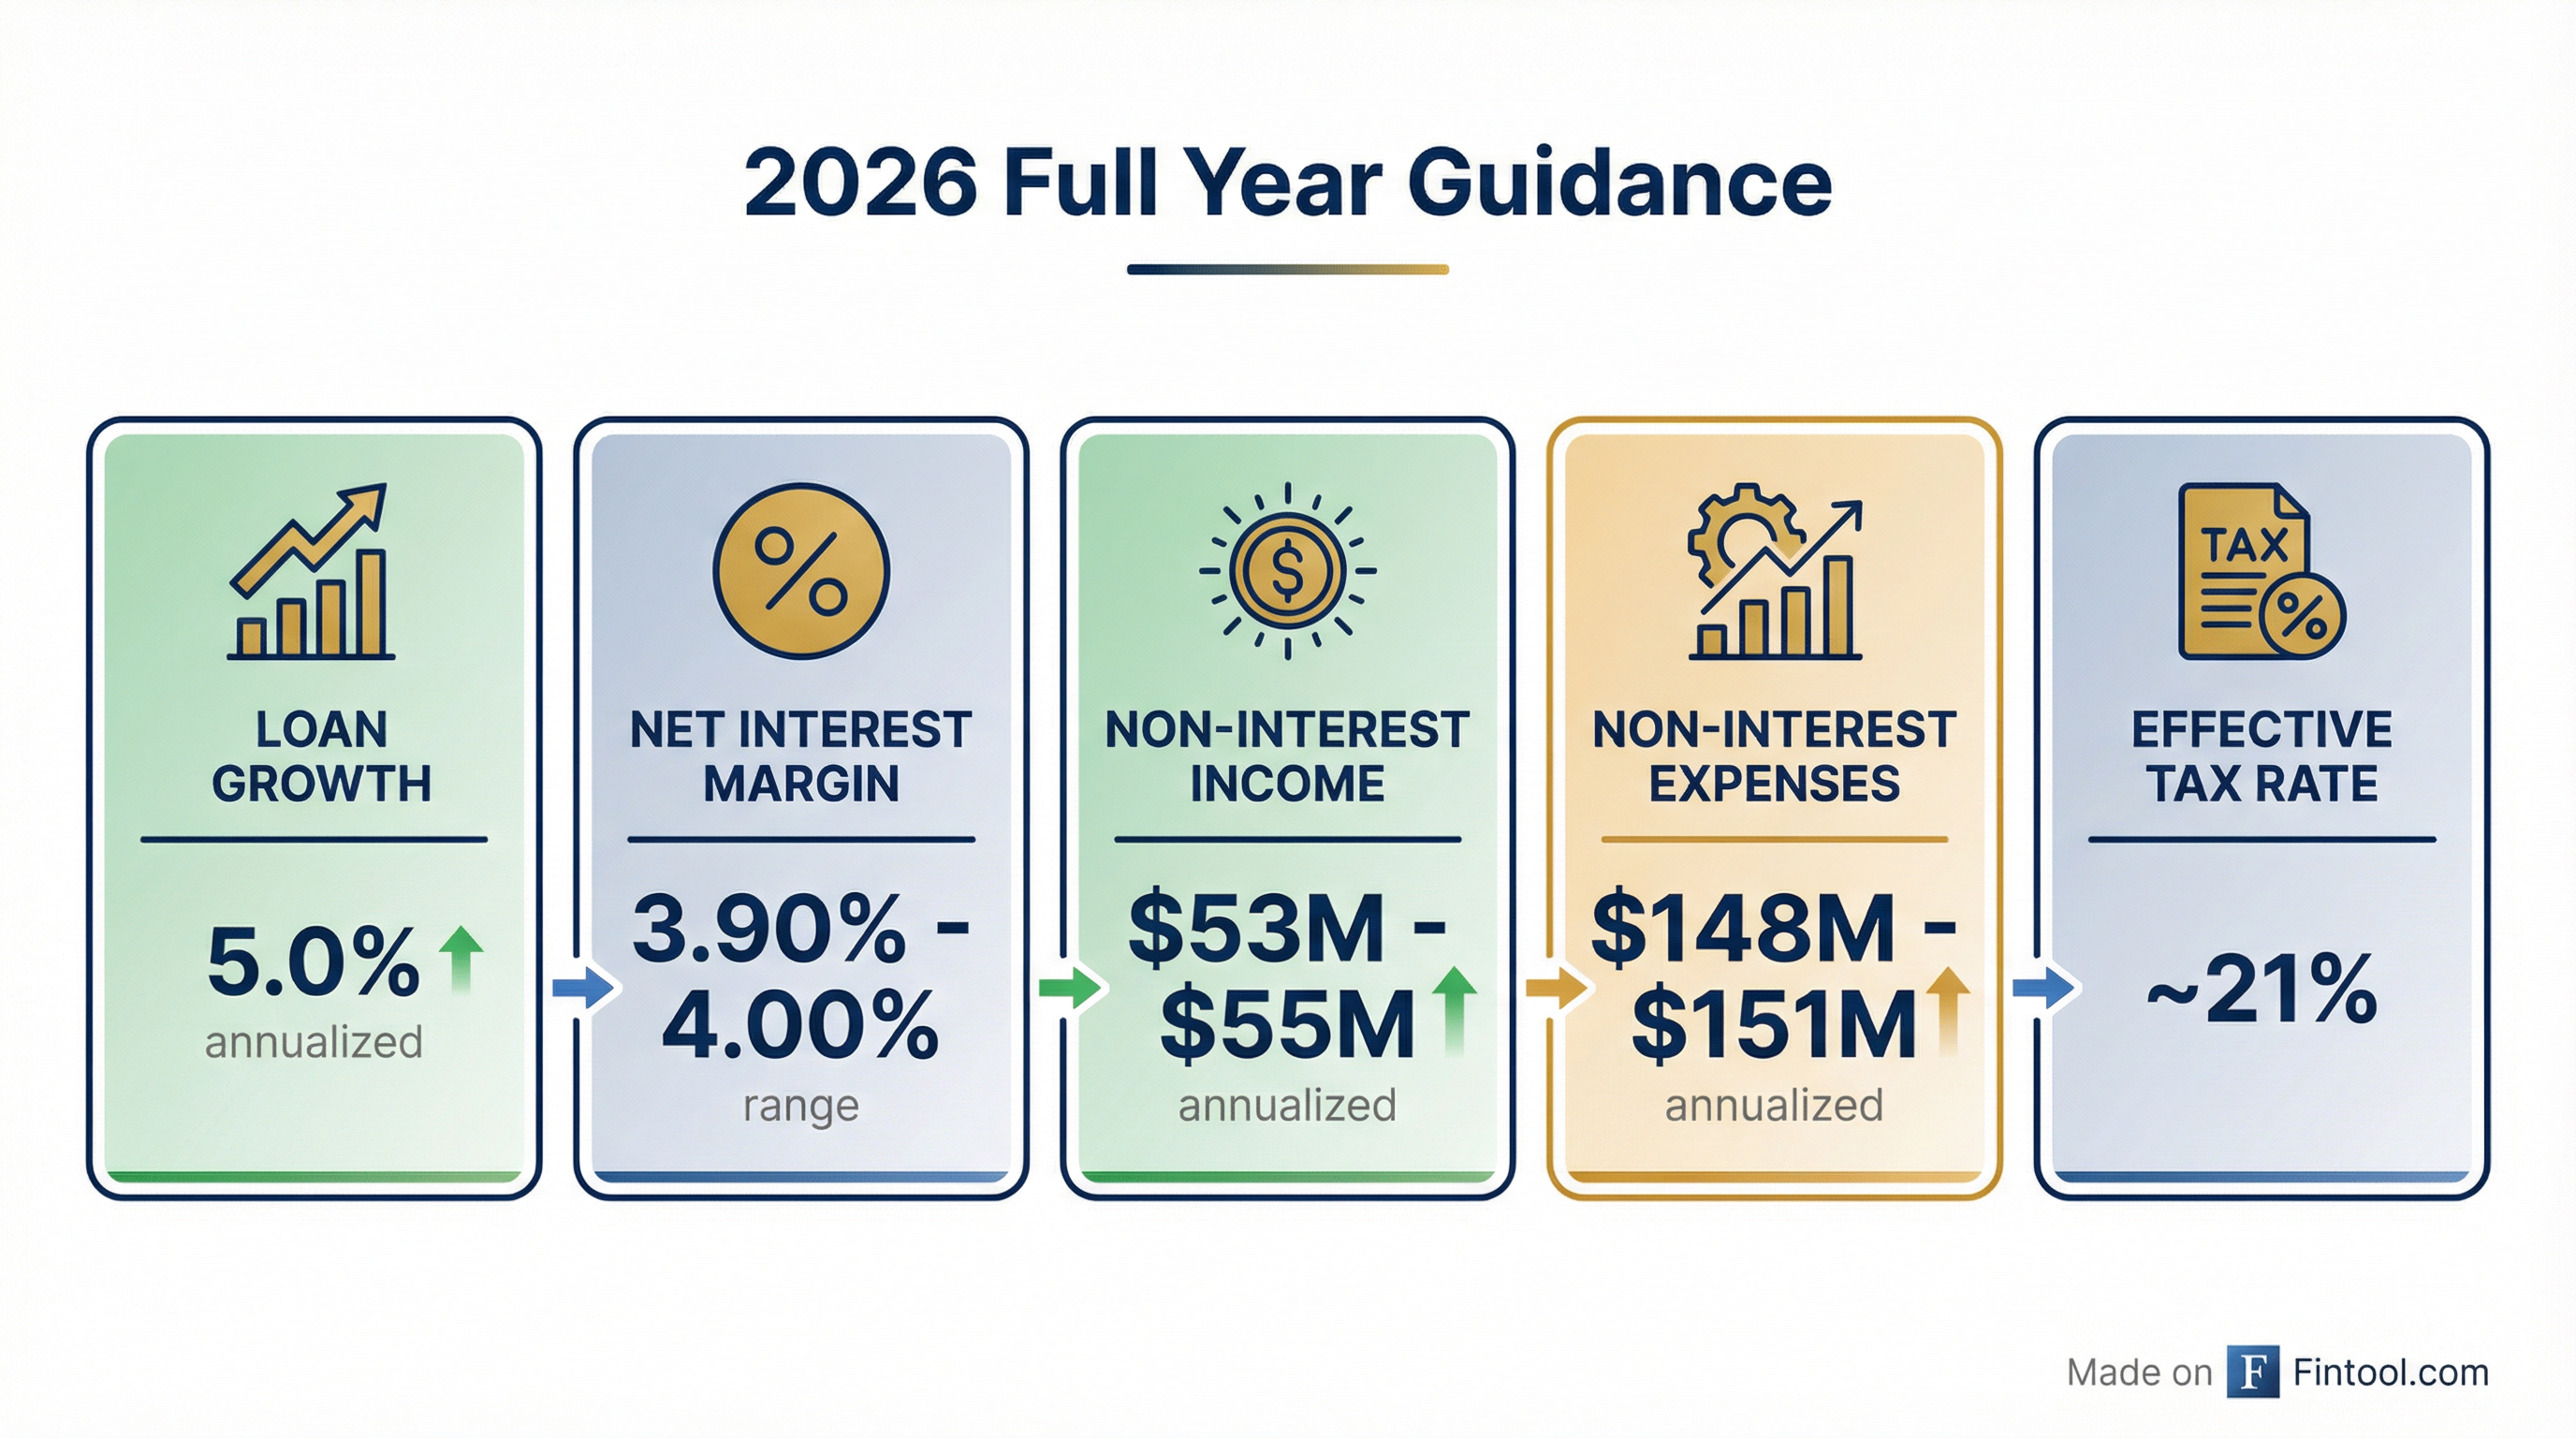
The NIM guide of 3.90%-4.00% implies further compression from Q4's 4.00%. However, CFO Kalani clarified on the call that the core NIM (excluding purchase accounting) should actually increase in Q1 as deposit costs come down, then stabilize . The guidance assumes three 25 bp Fed rate cuts in 2026—if rates remain unchanged, NIM would come in at the high end of the range .
Strategic Investments in Growth
Management continues to invest in talent as a core strategy:
- Wealth Management: Hired Matt Alpert as Chief Wealth Officer to build out the franchise in growth markets (Maryland, Lancaster, Harrisburg)
- Middle Market Banking: The mid-2025 buildout of the middle-market commercial lending platform "has already generated significant results"
- Treasury Management: Merchant services has grown substantially, now representing 17% of treasury management revenue
- Technology: Investments in CRM platform and training to deepen client relationships
"When we see opportunities to help us going forward, we will make those investments in strong talent to drive us forward." — CFO Neil Kalani
How Is Credit Quality Holding Up?
Credit metrics remain solid with minimal deterioration:
Positives:
- Classified loans declined $5.7M to $58.4M
- Provision expense was minimal at $0.1M
- Net charge-offs remained low at $0.5M
Watch items:
- Non-accrual loans increased to $28.0M (0.70% of loans)
- Reserve coverage of NPLs declined to 170% from 184%
Management believes the allowance adequately addresses portfolio risk based on current metrics and economic forecasts .
Balance Sheet Trends
Loans: Held-for-investment loans grew $41M (4% annualized) to $4.02B, driven by commercial (+$27M) and residential mortgage (+$12M) production . Commercial loan production totaled $207M at a blended rate of 6.32% . Some anticipated closings pushed into Q1 2026 .
Deposits: Total deposits declined slightly by $4.8M to $4.53B, with non-interest DDA and time deposits down, partially offset by growth in interest-bearing demand and money markets . The loan-to-deposit ratio ticked up to 89% .
Securities Portfolio: Management made a strategic repositioning during Q4, purchasing $125M of Agency MBS and CMOs at an average yield of 4.92% while selling $42M of securities for a small gain . The fixed-rate purchases were designed to address asset sensitivity on the balance sheet .
Capital: All ratios well above "well-capitalized" thresholds:
- Total Risk-Based Capital: 13.3% (vs. 10.0% minimum)
- Tier 1 Risk-Based: 11.7% (vs. 8.0% minimum)
- Leverage: 9.5% (vs. 5.0% minimum)
Tangible common equity ratio improved to 9.0% from 8.8% , providing strategic flexibility for future growth or M&A.
How Did the Stock React?
ORRF shares showed minimal reaction to the earnings release:
The muted reaction suggests the market had largely priced in continued strong profitability. The stock trades near its 52-week high of $38.38, up 40%+ from the $25.57 low.*
*Values retrieved from S&P Global
Q&A Highlights
On NIM trajectory (Tim Switzer, KBW): CFO Neil Kalani explained that purchase accounting accretion will decline 2-3 bps per quarter excluding any acceleration, while the core margin should increase in Q1 and stabilize thereafter . The 3.90%-4.00% NIM guidance assumes 75 bps of Fed rate cuts (three 25 bp cuts) in 2026—if rates hold flat, margin would come in at the high end of the range .
On Wealth Management (Gregory Zingone, Piper Sandler): Total AUM exceeded $3 billion at quarter end . The bank recently hired Matt Alpert as Chief Wealth Officer to drive growth in Maryland, Lancaster, and Harrisburg markets where management believes they're "just scratching the surface" .
On M&A (Gregory Zingone, Piper Sandler): CEO Tom Quinn emphasized organic growth remains the focus but noted capital build provides optionality. The bank has completed only "3 [deals] in 106 years" and remains "pretty picky about partners" .
On Share Buybacks (Kyle Gierman, Hovde Group): Management is monitoring buyback opportunities with tangible book value as a key factor, though recent stock price levels haven't presented compelling opportunities. Shares remain available under the authorization .
Key Takeaways
-
Profitability remains peer-leading: ROAA of 1.55% and ROAE of 14.73% position Orrstown at the high end of regional bank peers
-
Margin compression is the key headwind: NIM guidance of 3.90%-4.00% for 2026 assumes 75 bps of cuts; core margin expected to rise in Q1 then stabilize
-
Fee income diversification working: Non-interest income reached 22% of operating revenue, with wealth AUM exceeding $3B
-
Capital strength enables optionality: With TCE/TA at 9.0% and regulatory ratios well above minimums, the bank has capacity for organic growth, dividends, or M&A
-
Merger integration complete: No merger-related costs since Q2 2025; Codorus Valley combination driving scale benefits with "pretty good stickiness" on customer retention
Analysis based on Orrstown Financial Services Q4 2025 Earnings Presentation and Earnings Call Transcript dated January 28, 2026.