BLUE OWL CAPITAL (OWL)·Q4 2025 Earnings Summary
Blue Owl Crosses $300B AUM as Fundraising Surge Continues
February 5, 2026 · by Fintool AI Agent
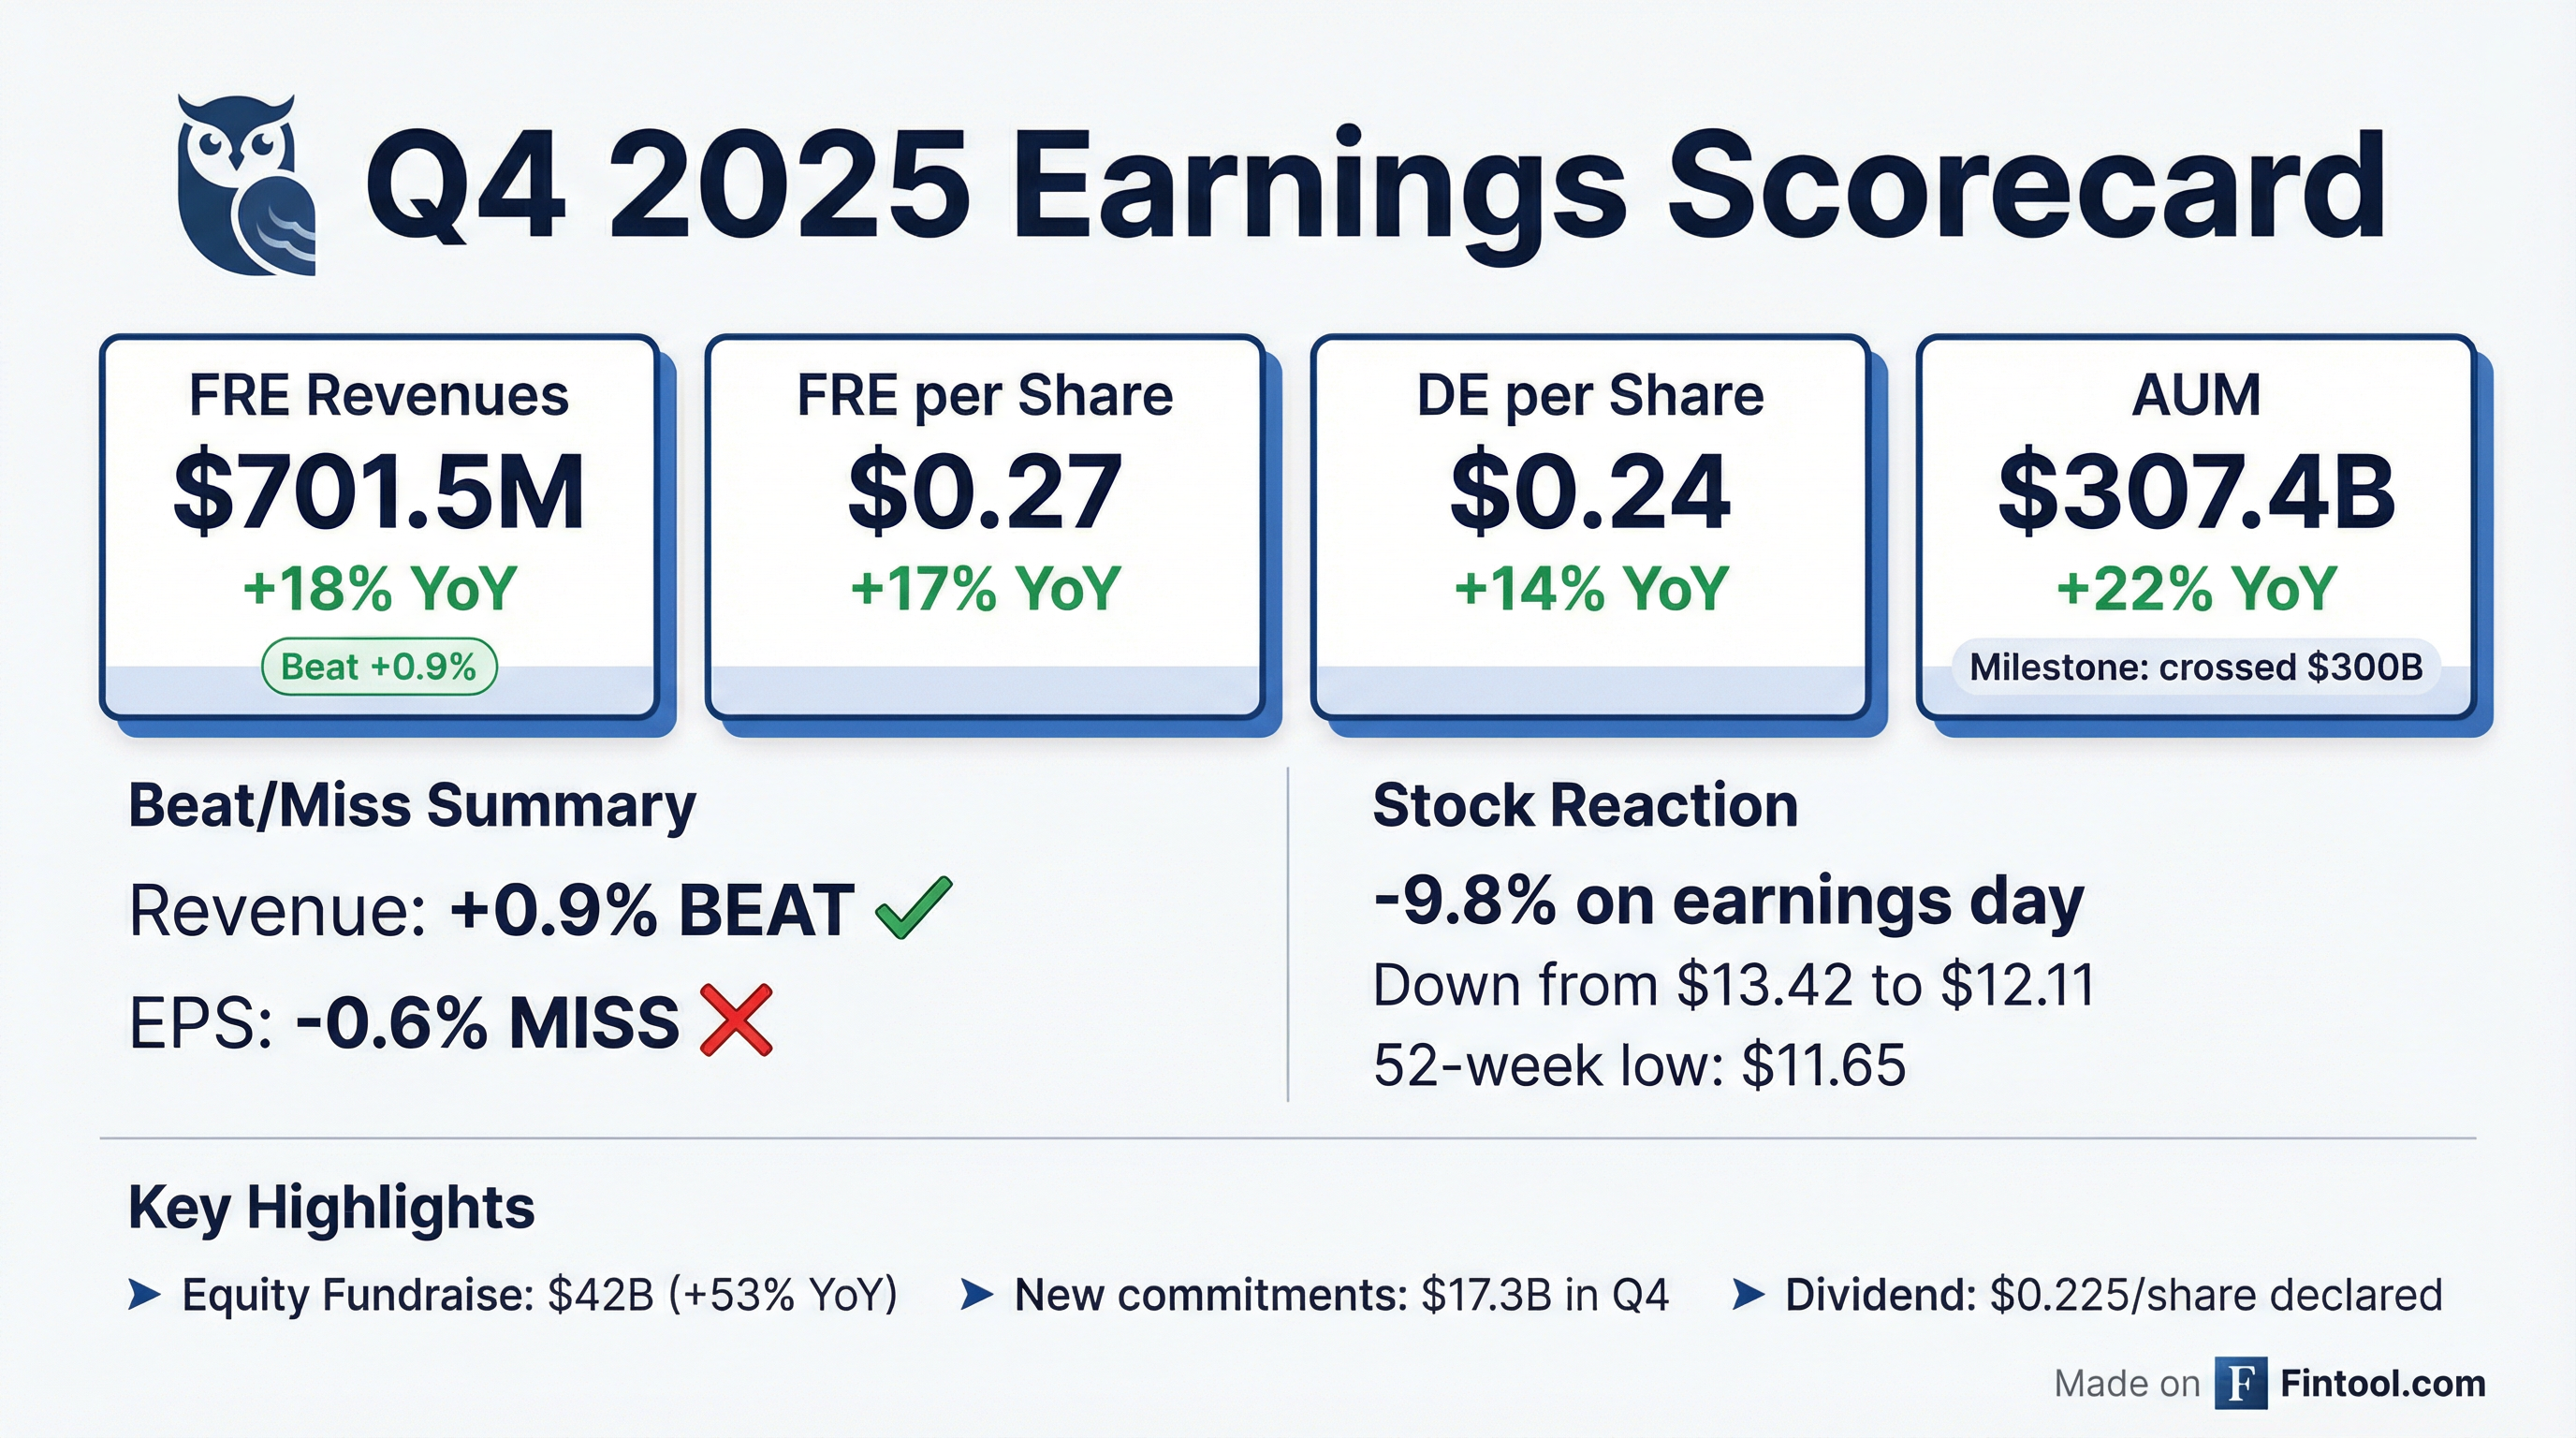
Blue Owl Capital (NYSE: OWL) delivered Q4 2025 results that exceeded revenue expectations while hitting a major milestone — crossing $300 billion in assets under management. Fee-Related Earnings grew 22% year-over-year to $416.6 million despite a challenging market backdrop that has weighed on the stock.
The alternative asset manager reported FRE Revenues of $701.5 million, up 18% from Q4 2024, driven by strong fundraising momentum across all three platforms. New capital commitments reached $17.3 billion in Q4 and $56.3 billion for the full year.
Did Blue Owl Beat Earnings?
Blue Owl's Q4 results came in largely inline to slightly better than expectations:
The company's key profitability metrics showed acceleration:
For the full year 2025, FRE grew 19% to $1.50 billion and DE increased 16% to $1.31 billion.
What Drove the $300B AUM Milestone?
Blue Owl crossed $307 billion in AUM during Q4, up 22% from $251 billion a year earlier. This was driven by record fundraising and the IPI digital infrastructure acquisition.

Platform Breakdown
Real Assets was the standout performer, growing 63% YoY driven by the IPI Acquisition and strong fundraising in net lease and digital infrastructure strategies.
Fundraising Momentum
Total equity fundraise surged to $42.0 billion in 2025, up 53% from $27.5 billion in 2024:
- Institutional Fundraise: $24.7B (+80% YoY)
- Private Wealth Fundraise: $17.3B (+58% YoY)
Key Q4 highlights included:
- First close of ODIT digital infrastructure REIT at $1.7B
- OWL CX interval fund reached $1.8B AUM (now >$100M/month in flows)
- Seventh vintage net lease product raised 60% of hard cap in just 3 quarters
- Blue Owl Digital Infrastructure Fund III held final close
- GP-led continuation strategy approaching final close at ~$2.5B
What Did Management Say About 2026?
Co-CEO Marc Lipschultz struck an optimistic tone despite market volatility and recent headwinds from AI-related software concerns:
"We're very proud of the work that we've done over the past two years to position Blue Owl for long-term success across a variety of market environments."
CFO Alan Kirshenbaum provided specific forward guidance:
Management acknowledged being behind Investor Day goals after just 1 year into their 5-year plan, citing headwinds from private credit/AI/software concerns, slower non-traded BDC flows, and increased tender requests. However, they expect to accelerate FRE per share growth in 2027 vs 2026.
Capital Return
The company is working to bring its payout ratio down from 107-108% to approximately 85% over the next few years.
How Did the Stock React?
Blue Owl shares ticked up modestly in after-hours trading following the release, rising approximately 1% to $12.18 from the $12.06 close.
However, the stock has faced significant pressure in recent weeks:
- YTD 2026: Down ~30% from January highs
- From 52-week high: Down 53% from $25.89
- Feb 3 selloff: -8.5% on broad market tariff concerns
The stock currently trades at approximately 9.5x FRE and 11x DE — historically low multiples for the company.
What Changed From Last Quarter?
Positives
- AUM acceleration: Crossed $300B milestone, with FPAUM up 17% YoY
- Margin expansion: FRE margin expanded 270 bps to 61.6%
- Real Assets growth: 63% YoY AUM growth, 103% YoY FRE revenue growth
- Private wealth momentum: Wealth-dedicated fundraising up 58% YoY
- Strong investment returns: Credit platform delivered 12.4% gross direct lending returns for 2025
Watch Items
- Behind Investor Day goals: Management acknowledged being behind 5-year targets after just 1 year
- Non-traded BDC headwinds: Elevated redemptions and slower capital raising in Q4
- GP Strategic Capital slowdown: AUM grew just 5% YoY, revenues flat
- Stock price weakness: Significant valuation compression despite operational strength; ~30% YTD decline
- Payout ratio above 100%: Working to bring down from 107-108% to ~85% over next few years
Segment Performance Deep Dive
Credit Platform ($157.8B AUM)
The Credit platform remains Blue Owl's largest, generating $1.62 billion in FRE revenues for 2025 (+19% YoY):
Direct lending originations totaled $45.4 billion for the year with net deployment of $13.2 billion.
Real Assets Platform ($80.6B AUM)
Real Assets was the growth engine, with FRE revenues of $394.4 million (+104% YoY):
The IPI Acquisition added $14.2 billion in AUM and expanded Blue Owl's digital infrastructure capabilities.
GP Strategic Capital ($69.1B AUM)
The GP minority stakes business showed more modest growth but continued to deliver exceptional returns:
Q&A Highlights: Software & AI Exposure Defense
The Q&A session was dominated by questions about Blue Owl's software lending exposure amid recent AI disruption concerns. Co-CEO Marc Lipschultz mounted an extensive defense:
The Facts on Software Lending
Marc Lipschultz delivered a pointed rebuttal to AI disruption fears:
"Tech lending has worked, continues to work, and to get very direct right to your answer, no, we don't have red flags. In point of fact, we don't have yellow flags. We actually have largely green flags. The tech portfolio continues to be the most pristine amongst all of our portfolios."
"Let's use November 2022, the advent of ChatGPT as some kind of moment of AI's arrival. Since that time, the portfolio on average has grown revenue 40% and EBITDA 50%."
"Take Jensen Huang's word for it... this idea that AI is the end of software is one of the most ridiculous things he's heard."
Management emphasized that their software borrowers are:
- Systems of record deeply embedded in business processes
- Operating in low-error tolerance environments (healthcare, financial services)
- Companies with data moats and regulatory constraints
- Adopters of AI — integrating agentic solutions into existing products
BDC Redemption Dynamics
Addressing elevated Q4 redemption requests, management confirmed they met all investor tender requests and continue to maintain strong liquidity. The OTIC product saw concentrated redemptions from Asia-based investors (an exception among Blue Owl wealth products).
"We manage our businesses with very low leverage. We manage with a lot of liquidity... there really was no reason to not fulfill an investor's request for their capital back."
Daily flows in wealth products have shown general stabilization through early February 2026.
Balance Sheet & Liquidity
Blue Owl maintains a conservative balance sheet with $1.8 billion in available liquidity:
The company holds investment-grade ratings from all three major agencies, providing flexibility for future acquisitions.
Key Metrics At A Glance
Data from Blue Owl Q4 2025 8-K filing
Forward Catalysts
- Hyperscaler CapEx super cycle: Google's CapEx guidance of $175-185B (up from $93B) validates massive digital infrastructure opportunity. Blue Owl is a "premier provider of capital solutions to the hyperscalers."
- Embedded AUM growth: $28.4B AUM not yet paying fees represents ~$325M in potential annual management fees (~13% embedded growth)
- Fund launches in 2026: Digital Infrastructure Fund IV (H2 2026), GP Stakes VI wrap-up, Net Lease VII
- Alternative credit scaling: High 30s% growth rate since Atalaya acquisition; targeting similar trajectory to Oak Street (which grew 4x)
- 401(k) opportunity: Partnership with Voya, CIT launching shortly, target date funds launching H2 2026
- FRE acceleration: Management expects FRE per share growth to accelerate in 2027 vs 2026
For the full earnings presentation and 8-K filing, see Blue Owl Investor Relations.