Pharma-Bio Serv (PBSV)·Q4 2025 Earnings Summary
Pharma-Bio Serv FY25: Revenue Slips But Losses Narrow, Special Dividend Declared
January 29, 2026 · by Fintool AI Agent
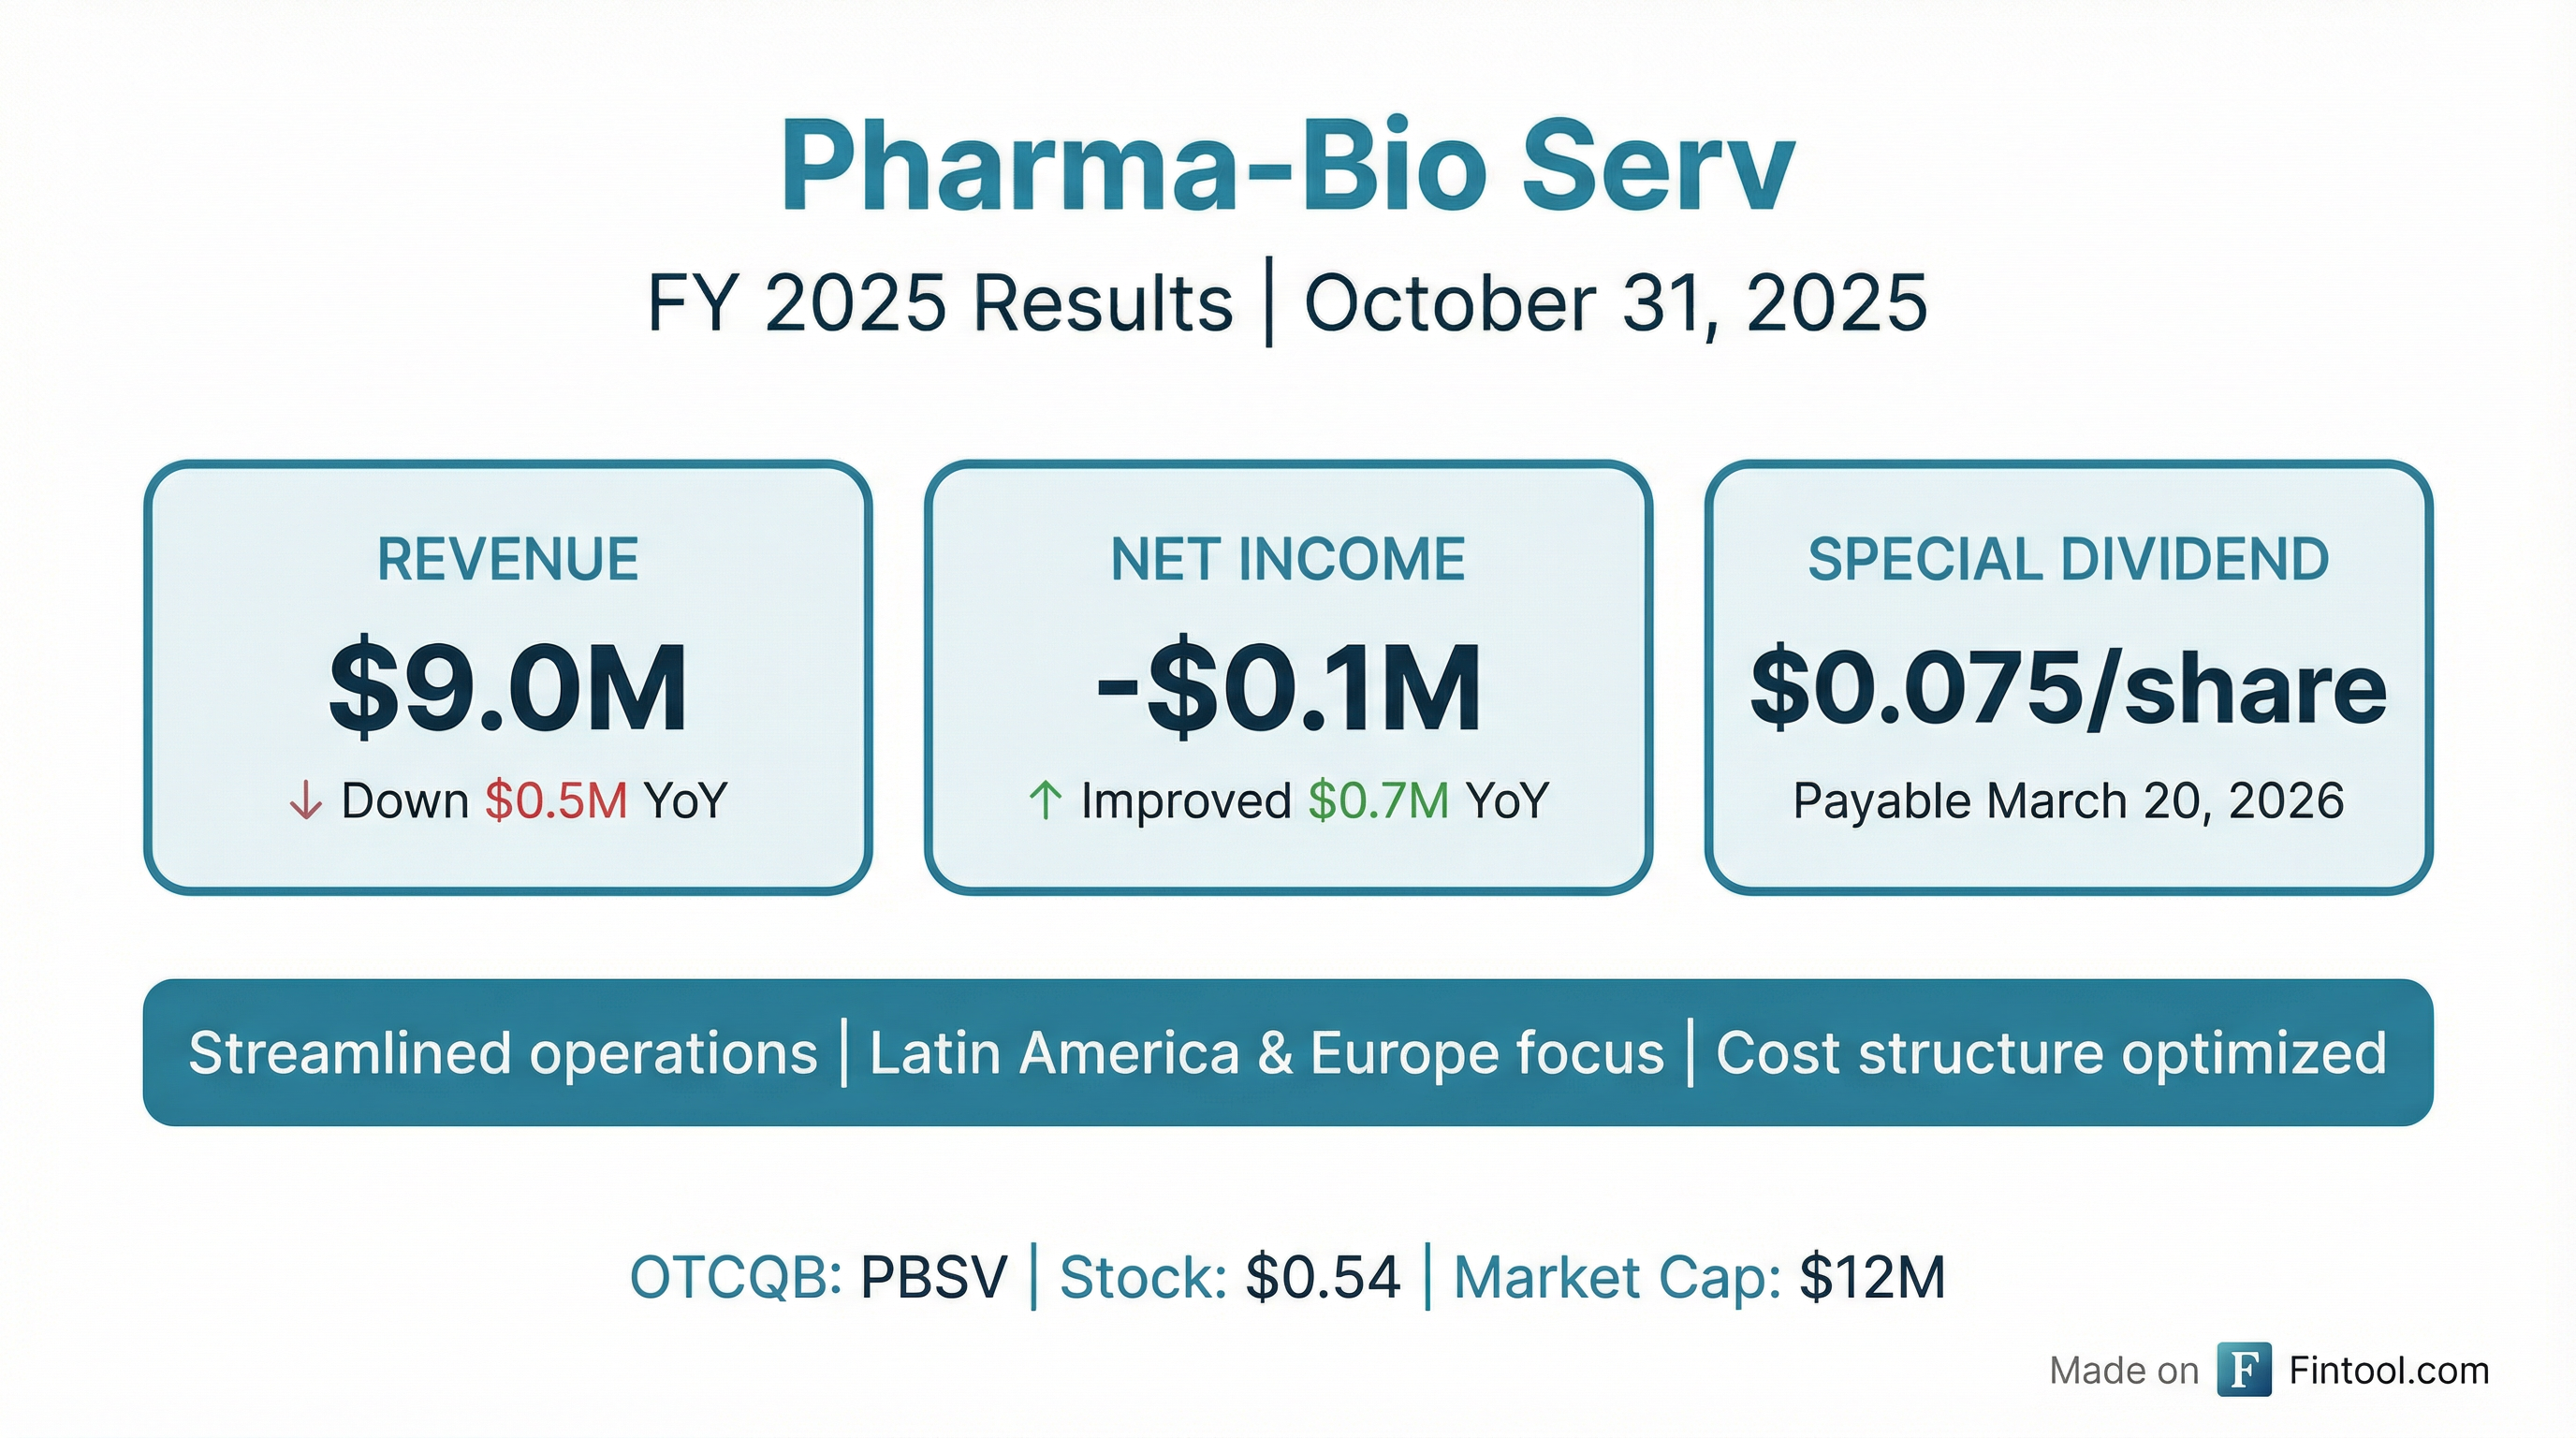
Pharma-Bio Serv, Inc. (OTCQB: PBSV) reported full-year fiscal 2025 results showing revenue of approximately $9.0 million, down $0.5 million year-over-year, while net loss narrowed significantly to $0.1 million from $0.8 million in FY 2024 — an improvement of $0.7 million. The Puerto Rico-based regulatory compliance consulting firm also announced a $0.075 per share special dividend.
Did Pharma-Bio Serv Beat Earnings?
No. Revenue declined approximately 5% year-over-year, though profitability improved materially.
The quarterly revenue trajectory shows the pressure concentrated in Q3 FY25:
*Values retrieved from S&P Global
What Did Management Say?
CEO Sanchez struck an optimistic tone despite the revenue decline, emphasizing operational discipline and strategic realignment:
"Throughout 2025, we remained focused on strengthening the fundamentals of the business by continuing to rationalize our portfolio of services and clients, as well as aligning our organizational structure with our strategic priorities."
Key strategic priorities highlighted:
- Portfolio rationalization — Selective about service offerings and client relationships
- Cost structure optimization — Streamlined operations to support profitability
- Geographic focus — Targeting Latin America and high-value European segments
- Capability differentiation — Concentrating on markets where expertise is strongest
How Did the Stock React?
PBSV shares traded flat at $0.54 on the announcement day, with minimal volume (600 shares). The stock remains well below its 52-week high of $1.36 and above its 52-week low of $0.35.
The limited trading volume is typical for this OTCQB-listed micro-cap stock, making price discovery challenging around earnings events.
What Changed From Last Quarter?
Improving profitability trajectory. Despite revenue headwinds, gross margins have generally expanded:
*Values retrieved from S&P Global
The Q3 FY25 revenue drop of 19% sequentially pressured margins, but the full-year improvement in net income demonstrates that cost rationalization efforts have taken hold.
Capital Allocation: Special Dividend
The $0.075 per share special dividend represents a notable shareholder return for this small-cap company:
At the current stock price of $0.54, this special dividend represents an implied yield of approximately 14%, which is notable for a company that reported a net loss. This suggests management has confidence in the balance sheet and cash position despite operating challenges.
Forward Catalysts and Risks
Potential Catalysts:
- Improved margin realization as cost cuts flow through
- Latin America expansion execution
- European high-value segment wins
- Regulatory complexity driving demand for compliance consulting
Key Risks:
- Revenue decline continuing into FY26
- Customer concentration (not disclosed but typical for small consultancies)
- Limited analyst coverage and liquidity
- Competitive pressure from larger compliance firms
What Management Avoided
The press release was notably brief, lacking:
- Specific guidance for FY 2026
- Customer or contract details
- Segment-level revenue breakdown
- Commentary on competitive dynamics
- Cash flow or balance sheet discussion
This opacity is common for micro-cap companies but limits visibility for investors seeking to model the business.
Key Takeaways
- Revenue pressure persists — FY25 revenue down 5% YoY with Q3 showing particular weakness
- Profitability inflection — Net loss narrowed from $0.8M to $0.1M, demonstrating cost discipline
- Shareholder return — $0.075 special dividend (~14% yield) signals balance sheet confidence
- Strategic refocus — Management targeting Latin America and high-value European segments
- Limited visibility — No forward guidance provided; typical micro-cap opacity
For the full fiscal year 2025 financial results, see the PBSV 8-K filing.