PATTERSON UTI ENERGY (PTEN)·Q4 2025 Earnings Summary
Patterson-UTI Hikes Dividend 25%, Beats Q4 on Strong Cost Controls
February 5, 2026 · by Fintool AI Agent
Patterson-UTI Energy (NASDAQ: PTEN) delivered a clean beat across all key metrics in Q4 2025 and announced a 25% dividend increase to $0.10 per share — the headline capital allocation move that signals management's confidence in continued free cash flow generation. The oilfield services company generated $416 million in adjusted free cash flow for full-year 2025 and returned approximately two-thirds of it to shareholders through dividends and buybacks.
Did Patterson-UTI Beat Earnings?
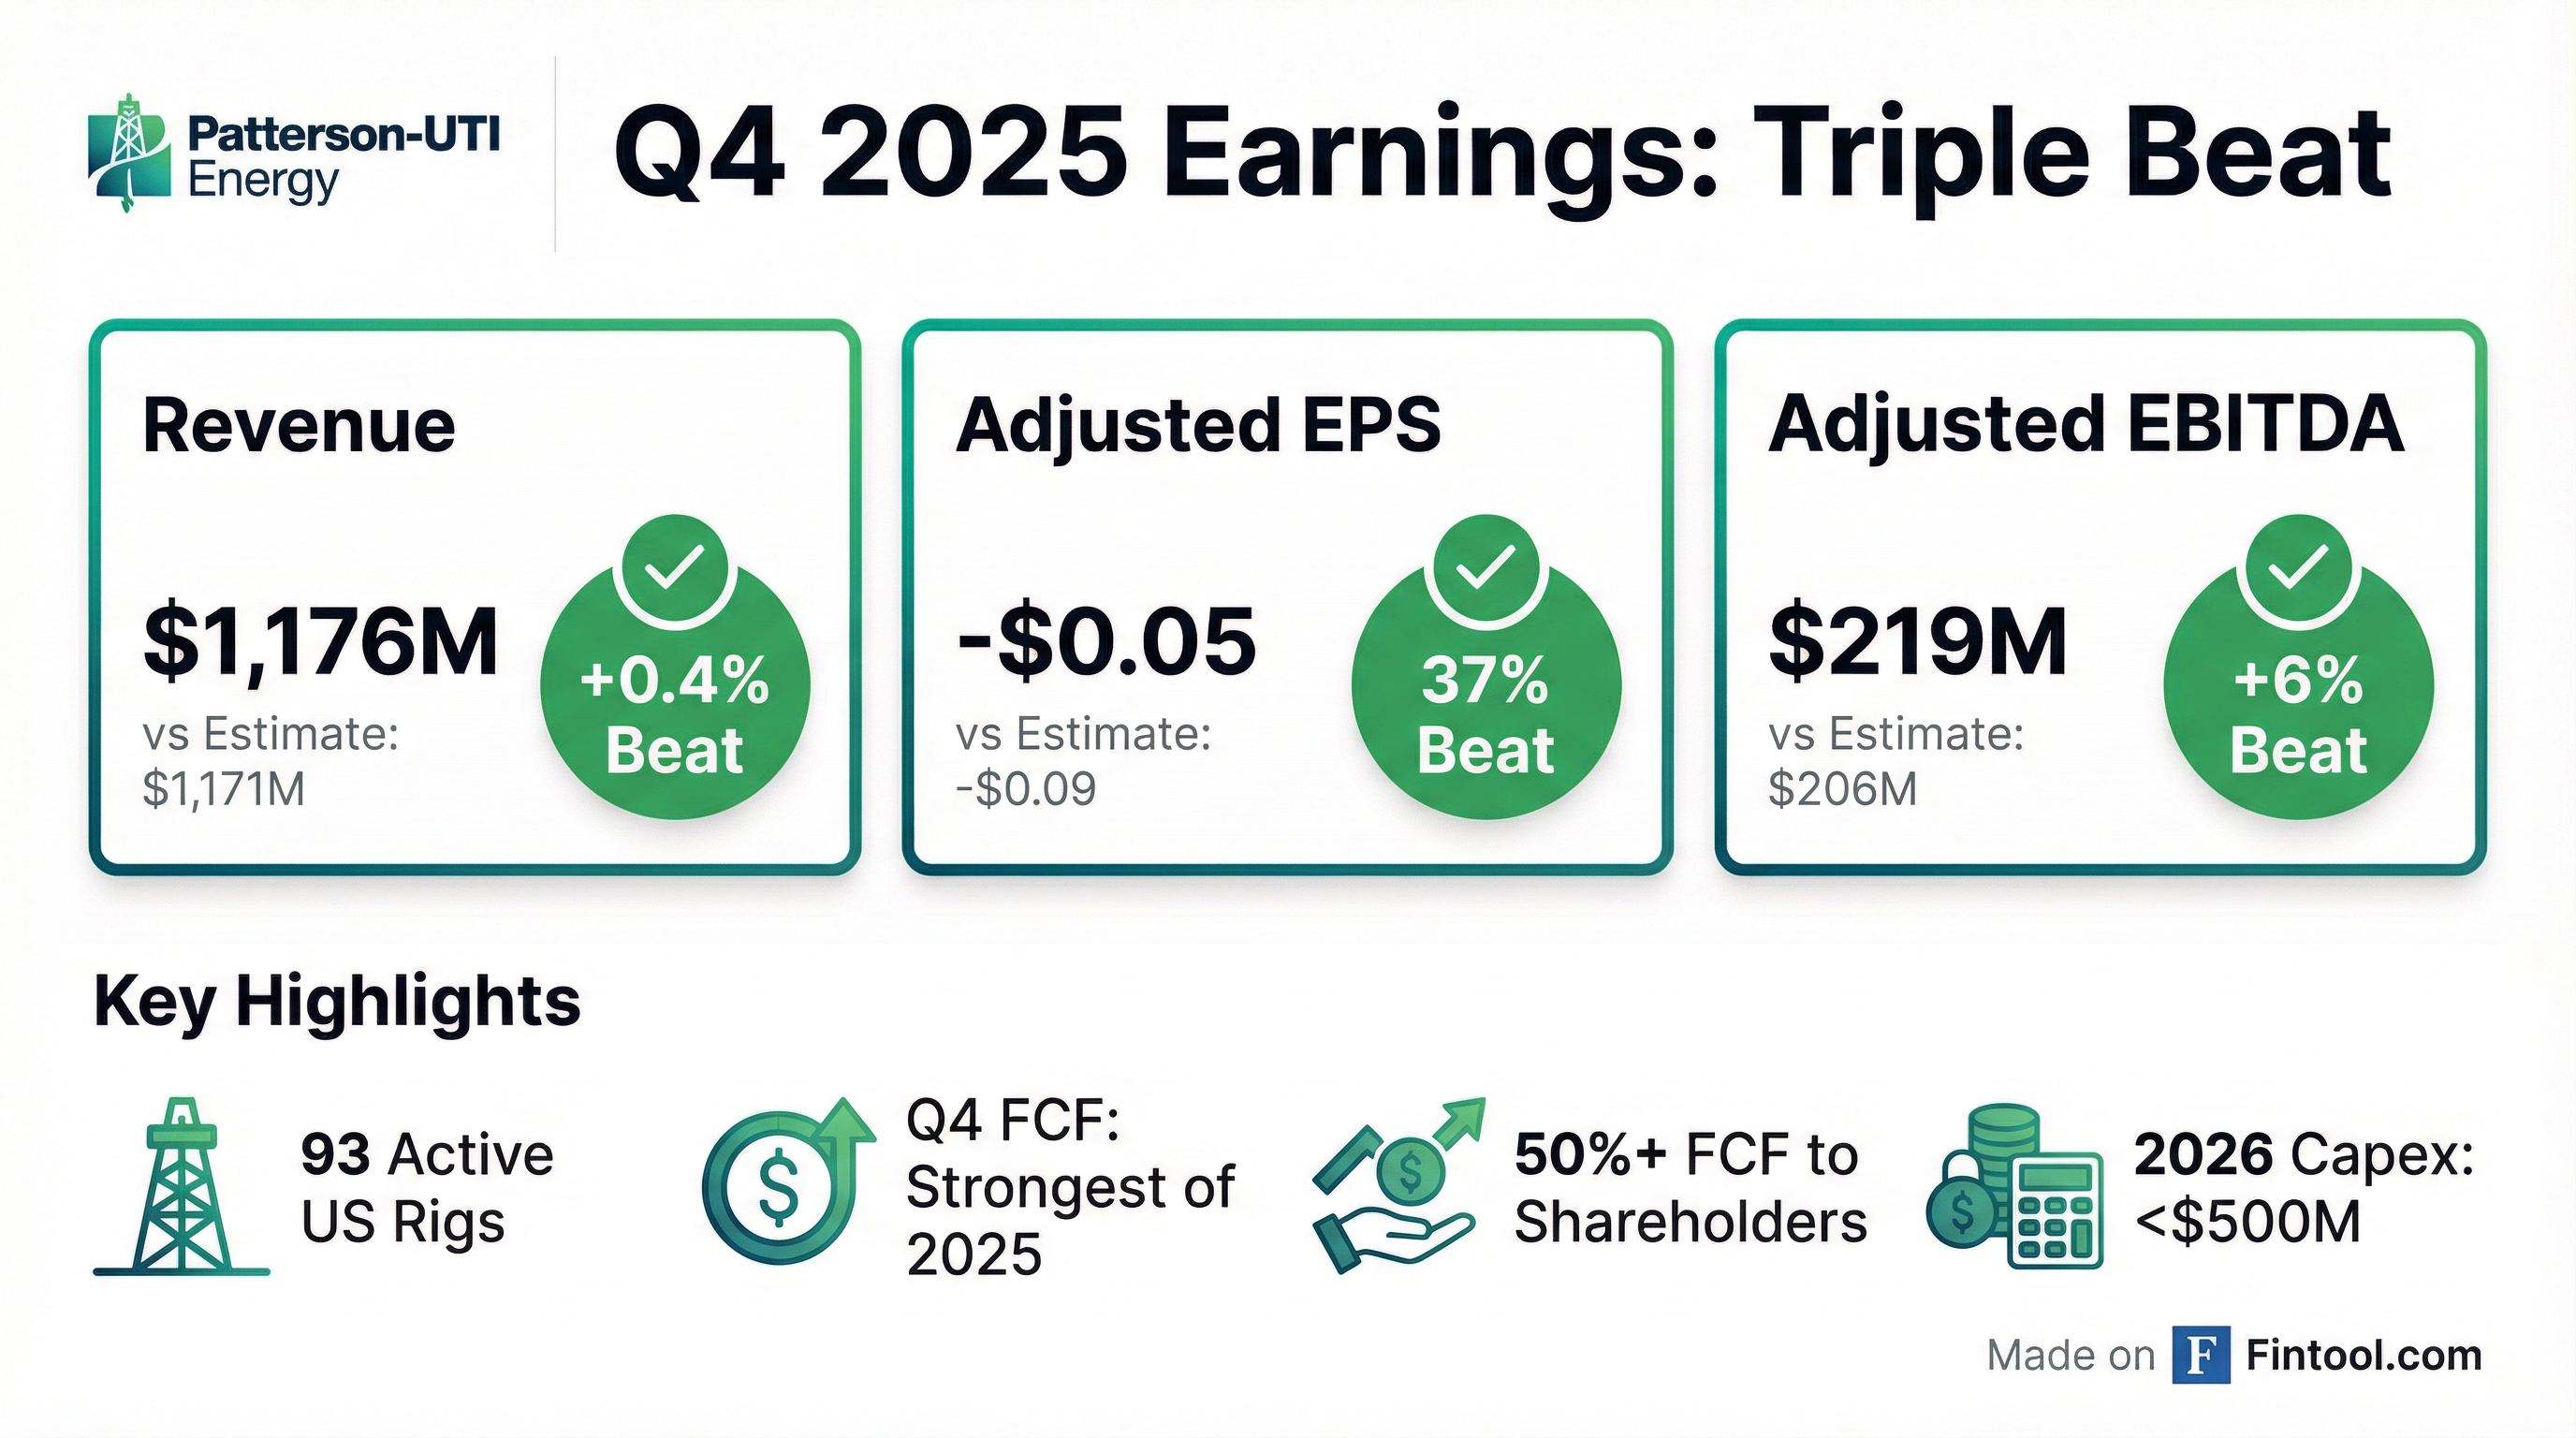
Yes — a clean beat across all key metrics.
*Consensus values retrieved from S&P Global
The beat came despite what is typically a seasonally soft period, with management highlighting that Q4 results reflect "strong operational execution in our core businesses and continued cost control in a challenging commodity environment."
What's the Big News? 25% Dividend Increase
Patterson-UTI raised its quarterly dividend by 25% to $0.10 per share, payable March 16, 2026 to holders of record as of March 2, 2026.
This is a significant capital allocation decision that reflects:
- Strong FCF generation: Full-year 2025 cash from operations of $961M and adjusted FCF of $416M
- Shareholder return commitment: Management returned approximately two-thirds of adjusted FCF to investors through dividends and share repurchases over the past two years
- Confidence in 2026: "Given our free cash flow expectations, we are increasing our quarterly dividend by 25%" — CFO Andy Smith
At the current stock price of $7.95, the new $0.40 annualized dividend represents a yield of approximately 5.0%.
What Did Management Say?
CEO Andy Hendricks on the quarter:
"We closed 2025 with a strong fourth quarter, delivering steady results during what is typically a seasonally soft period. This performance reflects strong operational execution in our core businesses and continued cost control in a challenging commodity environment."
On the 2026 outlook:
"U.S. drilling and completion activity has held relatively steady as we begin 2026. Oil prices have been resilient, despite increased OPEC+ supply and a subdued global economic growth forecast. In natural gas basins, growing LNG exports and rising domestic demand remain a long-term tailwind for drilling and completion activity."
CFO Andy Smith on capital allocation:
"We delivered another year of strong free cash flow through a disciplined, company-wide focus on cash management and capital allocation. We expect to continue delivering strong free cash flow in 2026, and we remain committed to returning at least 50% of our adjusted free cash flow to our shareholders."
What Did Management Guide for Q1 2026?
Patterson-UTI provided specific Q1 2026 guidance:
The Q1 Completion Services guidance of $95M adjusted gross profit (down 14% from Q4's $111M) reflects normal seasonal patterns with winter weather impact.
How Did Each Segment Perform?
Drilling Services: Q4 revenue of $361M with adjusted gross profit of $132M. Averaged 93 rigs operating with 8,596 US operating days. Management noted that cost reduction measures mostly offset the revenue decrease. Importantly, nearly all rigs are now equipped with Cortex automation applications, with demand remaining high for new software applications developed in partnership with customers.
Completion Services: Q4 revenue of $702M with adjusted gross profit of $111M. Minimal holiday-related downtime as most customers maintained consistent activity. Key fleet metrics:
- 2.5M horsepower deployed in field or in normal maintenance cycles
- Nameplate horsepower: 2.7M (down 600K+ from two years ago due to high-grading)
- 85%+ of assets will be capable of using natural gas as fuel by end of 2026
- Very little spare capacity — idle horsepower is entirely older diesel equipment not part of long-term strategy
Launched the new eos™ Completions Digital Platform with revenue-generating agreements in place.
Drilling Products: Q4 revenue of $84M with adjusted gross profit of $34M. Revenue per industry rig remained near company record levels in both US and Canada. Opened new manufacturing facility in Saudi Arabia and manufactured first in-country drill bit in December 2025.
New Technology Launches
Patterson-UTI highlighted two technology initiatives gaining traction:
eos™ Completions Digital Platform — Launched in Q4, this proprietary platform advances real-time visualization, controls, and data integration throughout the completions process. Management sees "strong customer demand" for:
- Vertex™ frac automation
- Fully integrated data management
- Fuel/proppant/chemicals logistics optimization
- Reservoir analytics
Cortex® Automation — Nearly all rigs are now equipped with Cortex automation applications. As well designs become more complex, management expects "continued bifurcation among service providers" favoring high-quality operators like Patterson-UTI.
Argentina Expansion: 2 Rigs to Vaca Muerta
Patterson-UTI announced a multi-year agreement to lease two high-spec rigs for work in Argentina's Vaca Muerta shale field.
CEO Andy Hendricks on the opportunity:
"The opportunity in Argentina is one of the most promising that we see to put our idle assets to work globally, and our fleet of rigs in the U.S. are well suited to meet the region's growing demand for unconventional drilling over the next few years."
Key strategic points:
- Capital-efficient deployment of idle US assets internationally
- Argentina uses identical rig specifications to US unconventional drilling — easy technology transfer
- Complements Ulterra's existing drill bit presence in the region
- Management expects further planned increases in Argentina drilling will reduce available US supply
Q&A Highlights: What Analysts Asked
Frac Market Supply/Demand Dynamics
Scott Gruber (Citi) asked about frac supply-demand balance given larger fleet sizes. CEO Hendricks explained the disconnect in public data:
"While the fleet count looks like it's going down, we've actually remained relatively steady in the amount of horsepower that's been deployed... All the equipment that we have that can burn natural gas is certainly out working. That market still remains very tight."
Key points:
- Average fleet now pumping 22+ hours/day — limited room for further efficiency gains
- Simul-frac and trimul-frac growth requires more horsepower on location
- Higher rates and pressures = more equipment = higher pricing
- 100% natural gas equipment fully utilized — any gas basin activity increase would trigger "significant pricing inflection"
Continuous Pumping Economics
Arun Jayaram (J.P. Morgan) asked about the continuous pumping trend. CEO Hendricks:
"If you want to take that number from 22 to 24 [hours], we may have to deploy another 20%-30% of capital on location with more frac pumps, more high-pressure iron, more valves... The E&Ps have to do their own earnings math to decide if that's worth the extra equipment."
E&Ps are currently trialing continuous pumping to evaluate whether pulling production forward justifies the incremental cost.
Winter Weather Impact
Saurabh Pant (BofA) asked CFO Smith to quantify the Q1 weather impact:
"It's in the range of $5 million-$10 million. It's included in our guidance, so it's certainly not incremental to anything."
2026 CapEx Breakdown
Arun Jayaram (J.P. Morgan) asked about CapEx allocation. CFO Smith provided detail:
Pricing Stability
Stephen Gengaro (Stifel) asked about rig pricing stability. CEO Hendricks:
"Where we are today, you've got some available rigs in West Texas. It's still a price competitive environment out there, but I'm pleased with our ability to protect our pricing and margins... If [oil] stays upper $50s-$60s, then I think pricing remains relatively stable."
Private vs Public Customer Mix
Ati Modak (Goldman Sachs) asked about customer dynamics:
"We work for some of the biggest publics, and we also work for some of the biggest privates in the US... We're heavily weighted to the largest E&Ps in the US, whether they're both public or private."
Tier 1 to Tier 2 Inventory Transition
Chad Belman (Daniel Energy) asked about Tier 2 resource development implications:
"For us to do that, that means more service intensity, and more intensity means it's positive for our pricing. On the drilling side, it means we may need to continue to add capacity on the size of the rig... On the completion side, it may require more horsepower on location for some of these deeper plays."
How Did the Stock React?
Patterson-UTI shares closed at $7.95 on the earnings release date, up 1.8% on the day. After-hours trading showed continued strength with shares at $8.05, suggesting the dividend increase is being well-received.
*Market data as of February 5, 2026
The stock has recovered 56% from its October 2025 lows near $5.10 and now trades well above both the 50-day and 200-day moving averages.
Full Year 2025 Summary
Despite the challenging commodity environment, Patterson-UTI maintained disciplined capital allocation and still returned approximately two-thirds of adjusted FCF to shareholders.
Balance Sheet Highlights (as of Q4 2025):
- Cash on hand: $421M
- Revolver: $500M available (nothing drawn)
- No senior note maturities until 2028
What Should Investors Watch Going Forward?
Near-term catalysts:
- Q1 2026 execution on ~$95M Completion Services adjusted gross profit target
- Pace of eos platform adoption and revenue contribution
- International growth in Drilling Products (Saudi Arabia manufacturing)
- Continued share repurchases alongside new dividend level
Key risks:
- Continued softness in US drilling activity
- Commodity price volatility impacting customer budgets
- Industry overcapacity in completion services
- Execution on technology platform monetization
Management credibility: The 25% dividend increase is a strong vote of confidence from a management team that has consistently delivered on shareholder return commitments. Over the past two years, they've returned approximately two-thirds of adjusted FCF vs. the 50% minimum target.
Data sources: Patterson-UTI 8-K filing dated February 4, 2026, S&P Global estimates