QIAGEN (QGEN)·Q4 2025 Earnings Summary
QIAGEN Q4 2025: EPS Beats Outlook, But Stock Slides 2% After Hours
February 5, 2026 · by Fintool AI Agent
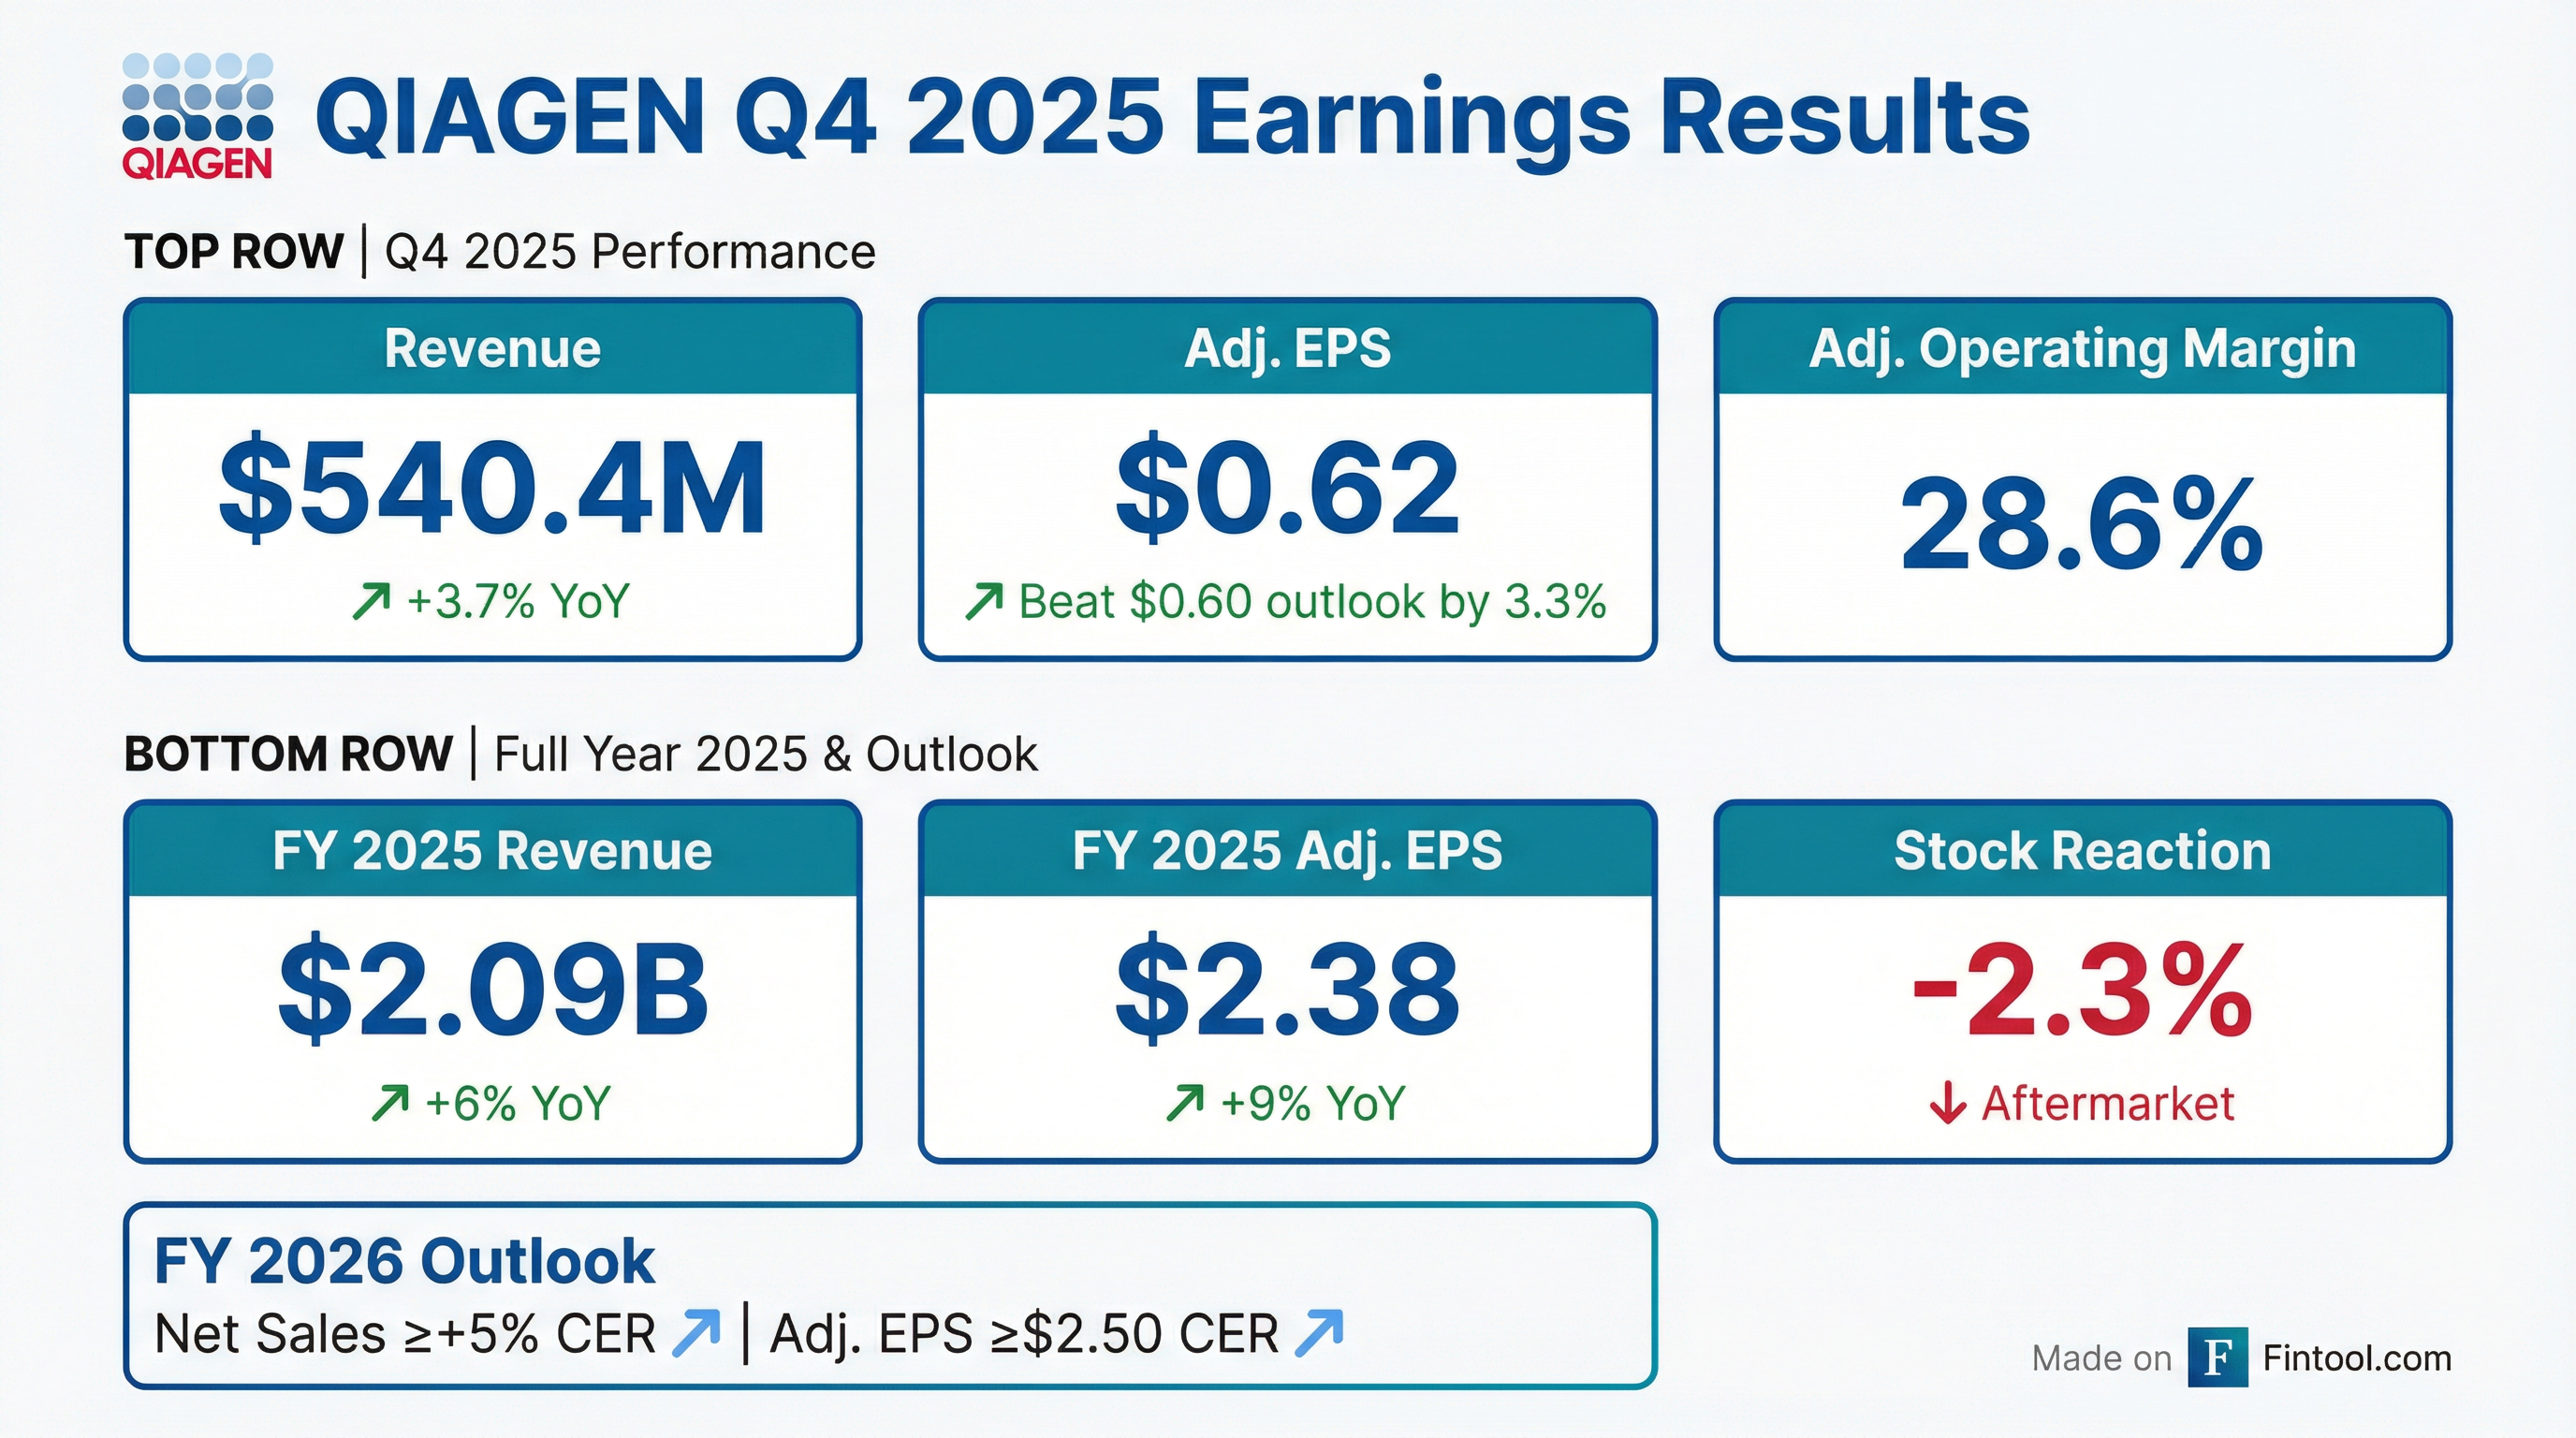
QIAGEN (NYSE: QGEN) delivered solid Q4 2025 results that exceeded company guidance, with adjusted EPS of $0.62 beating the ~$0.60 outlook by 3.3% and revenue growth of +1% CER surpassing the flat outlook. Full-year 2025 adjusted operating margin expanded 80 basis points to 29.5% despite 80 bps of tariff headwinds. However, shares fell 2.3% in aftermarket trading to $50.51, potentially reflecting investor concerns about a slower first half in 2026 before growth accelerates.
Did QIAGEN Beat Earnings?
Yes — QIAGEN beat on both EPS and revenue growth versus its outlook.
For full-year 2025, QIAGEN also exceeded expectations:
What Drove Q4 Performance?
Growth pillar performance was mixed in Q4:
Key operational highlights from the call:
- Sample Technologies install base: Grew to ~31,400 cumulative placements
- Liquid Biopsy: Sample prep for liquid biopsy grew >30% YoY
- QIAcuity: >3,200 instruments placed globally; >500 new placements in 2025
- QIAstat-Dx: >5,200 instruments worldwide; >50% of customers now use multiple panels
The quarter was marked by two key acquisitions:
- Parse Biosciences (Dec 2025): Adds single-cell preparation and analysis via Evercode™ kits; enables immediate fixation at collection
- Blood Culture ID Panels: Submitted for U.S. clearance and CE-IVDR registration, expanding into sepsis-related applications
How Did the Stock React?
Despite beating guidance, the stock declined. This may reflect:
- Slower H1 2026 growth: Company guided ~2-3% CER in H1 before accelerating to 7-8% in H2
- Currency & Tariff headwinds: ~1.5 ppt of margin headwind expected in 2026
- Conservative Q1 guidance: EPS ≥$0.54 CER vs. $0.62 in Q4
What Did Management Guide?
FY 2026 Outlook :
Q1 2026 Outlook :
The sequential step-down in Q1 EPS guidance ($0.54 vs. Q4's $0.62) reflects typical seasonality and currency movements.
What Changed From Last Quarter?
Key changes since Q3 2025:
New developments:
- Parse Biosciences acquisition closed December 2025
- Blood culture ID panels submitted for regulatory approval
- New Supervisory Board member: Mark Stevenson (former Thermo Fisher COO)
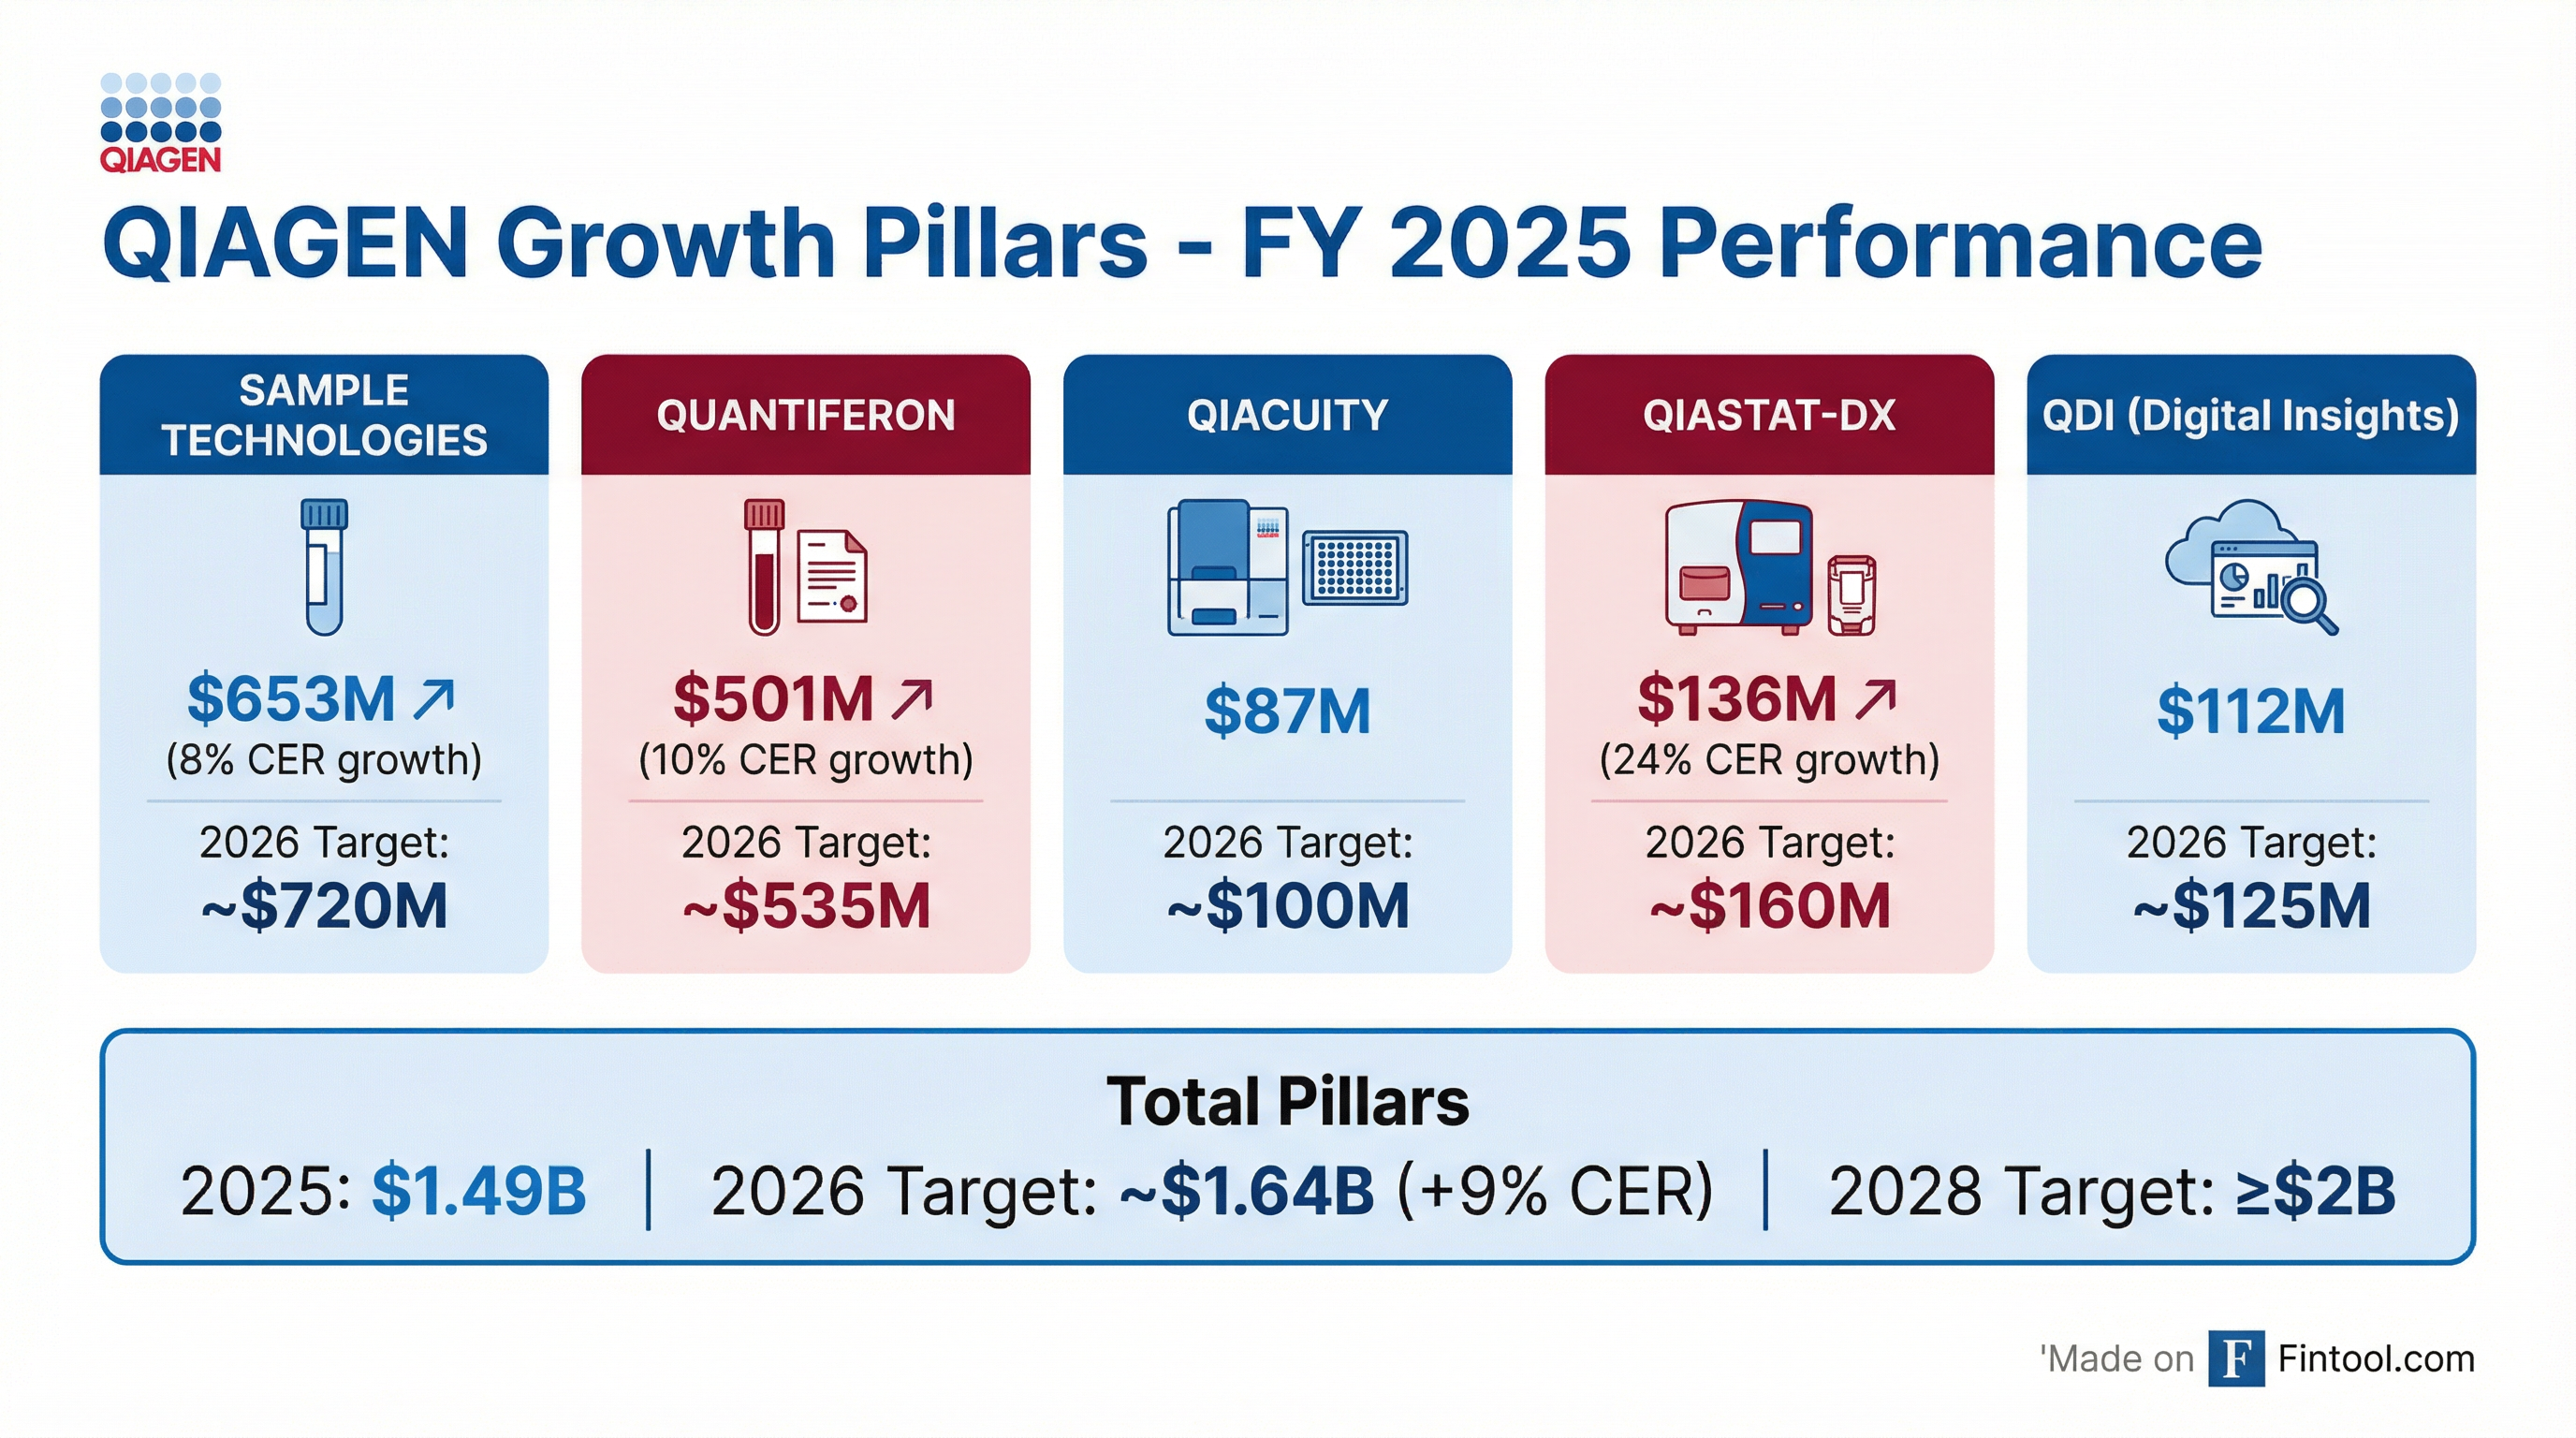
What Are the Growth Pillars Targeting?
QIAGEN's five growth pillars delivered $1.49B CER in FY 2025 (+8% CER), hitting their target:
The 2028 target of ≥$2B from growth pillars implies a ~10% CAGR from 2025, with pillars growing faster than the overall company.
What Are the Key Risks?
Near-term concerns highlighted:
- H1 2026 Growth Slowdown: Only ~2-3% CER growth expected before H2 acceleration
- Currency & Tariff Headwinds: ~160 bps combined margin drag in 2026 (Parse ~100 bps, tariffs/FX ~60 bps)
- Capital Spending Environment: Research & academia customers remain in "wait-and-see" mode; QIAcuity placements constrained
- CEO Transition: Succession search ongoing; new CEO will need to review targets
- NeuMoDx/DiaSorin Discontinuation: ~$10M or ~2 ppt headwind in Q1-Q2 2026
Management's end market outlook:
"If we consider the funding environment, especially for research and academia labs, we believe the situation is better now than it was six months ago... NIH budget will likely see a slight increase, around 1%. Once labs get more visibility, we believe capital expense will improve."
Balance Sheet Snapshot
Leverage increased due to acquisition funding (Parse Biosciences: $291M cash) and $742M in new debt issuance, partially offset by $534M debt repayment.
Q&A Highlights
The earnings call featured several notable exchanges with analysts:
On M&A Rumors — Jack Meehan (Nephron) asked about recent headlines suggesting QIAGEN as a potential acquisition target:
"It's fair to say that our market is still and will still be going through consolidation... QIAGEN is delivering and focusing on delivering on our solid plan for the coming years. We do not comment on rumors. We are always open for discussion that could create value for shareholders."
On CEO Succession — The search for Thierry Bernard's replacement is ongoing:
"What is important for the board and for the company is to find the best person for the job. This is both an external and internal search. It's advancing very well, but we need to take the necessary time."
On QIAcuity Digital PCR — Tycho Peterson (Jefferies) asked about the $250M by 2028 target after recent misses:
"We might have a slight delay because of the sluggish capital expense environment, but what is important is that we continue to grow, capture new markets, and grow consumables at double digits while still placing a significant number of instruments every year."
On China Exposure — Alisha Noor (Morgan Stanley) asked about VBP (Volume-Based Procurement) exposure:
"Our exposure is 4% to China. It's a large market — too large to be ignored, but too specific and too politically driven to make it an investment case. We expect China to be between low single digit negative to, at very best, flat."
On QuantiFERON Pricing — Dan Brennan (TD Cowen) asked about competitive pricing dynamics:
"Overall, we continue to price increase every year on QuantiFERON. Pricing 2025 for QuantiFERON was positive. When it's necessary to secure a deal for 2 or 3 years, we need to be flexible. But those have to be reasonable concessions."
What's the 2026 Product Launch Pipeline?
Management provided specific timelines for key launches:
Parse Biosciences contribution: ~$40M expected in 2026, weighted 40% H1 / 60% H2.
Forward Catalysts
2026 catalysts to watch:
- February: QIAspring Connect launch — QIAGEN's entry into high-throughput automation
- Q1: Blood culture ID panel FDA decision; QuantiFERON-TB Gold Plus II US launch
- Mid-2026: QIAsymphony Connect full IVDR launch
- Fall 2026: QIAmini launch for low-throughput labs
- H2: Growth acceleration to 7-8% CER; Parse contribution ramps
- Full Year: CEO succession announcement; potential bolt-on acquisitions
2028 Targets Reiterated :
- ~7% core sales CAGR (2024-2028)
- ≥31% adjusted operating income margin (management says they expect to exceed this)
- ≥$2B sales from growth pillars
- ≥$1B shareholder returns (already exceeded)
Data sourced from QIAGEN Q4 2025 earnings call transcript and presentation published February 5, 2026. Stock prices as of February 4, 2026 close and aftermarket trading.