TWIN DISC (TWIN)·Q2 2026 Earnings Summary
Twin Disc Beats Revenue by 12% on Acquisition Boost; Defense Backlog at Record
February 4, 2026 · by Fintool AI Agent
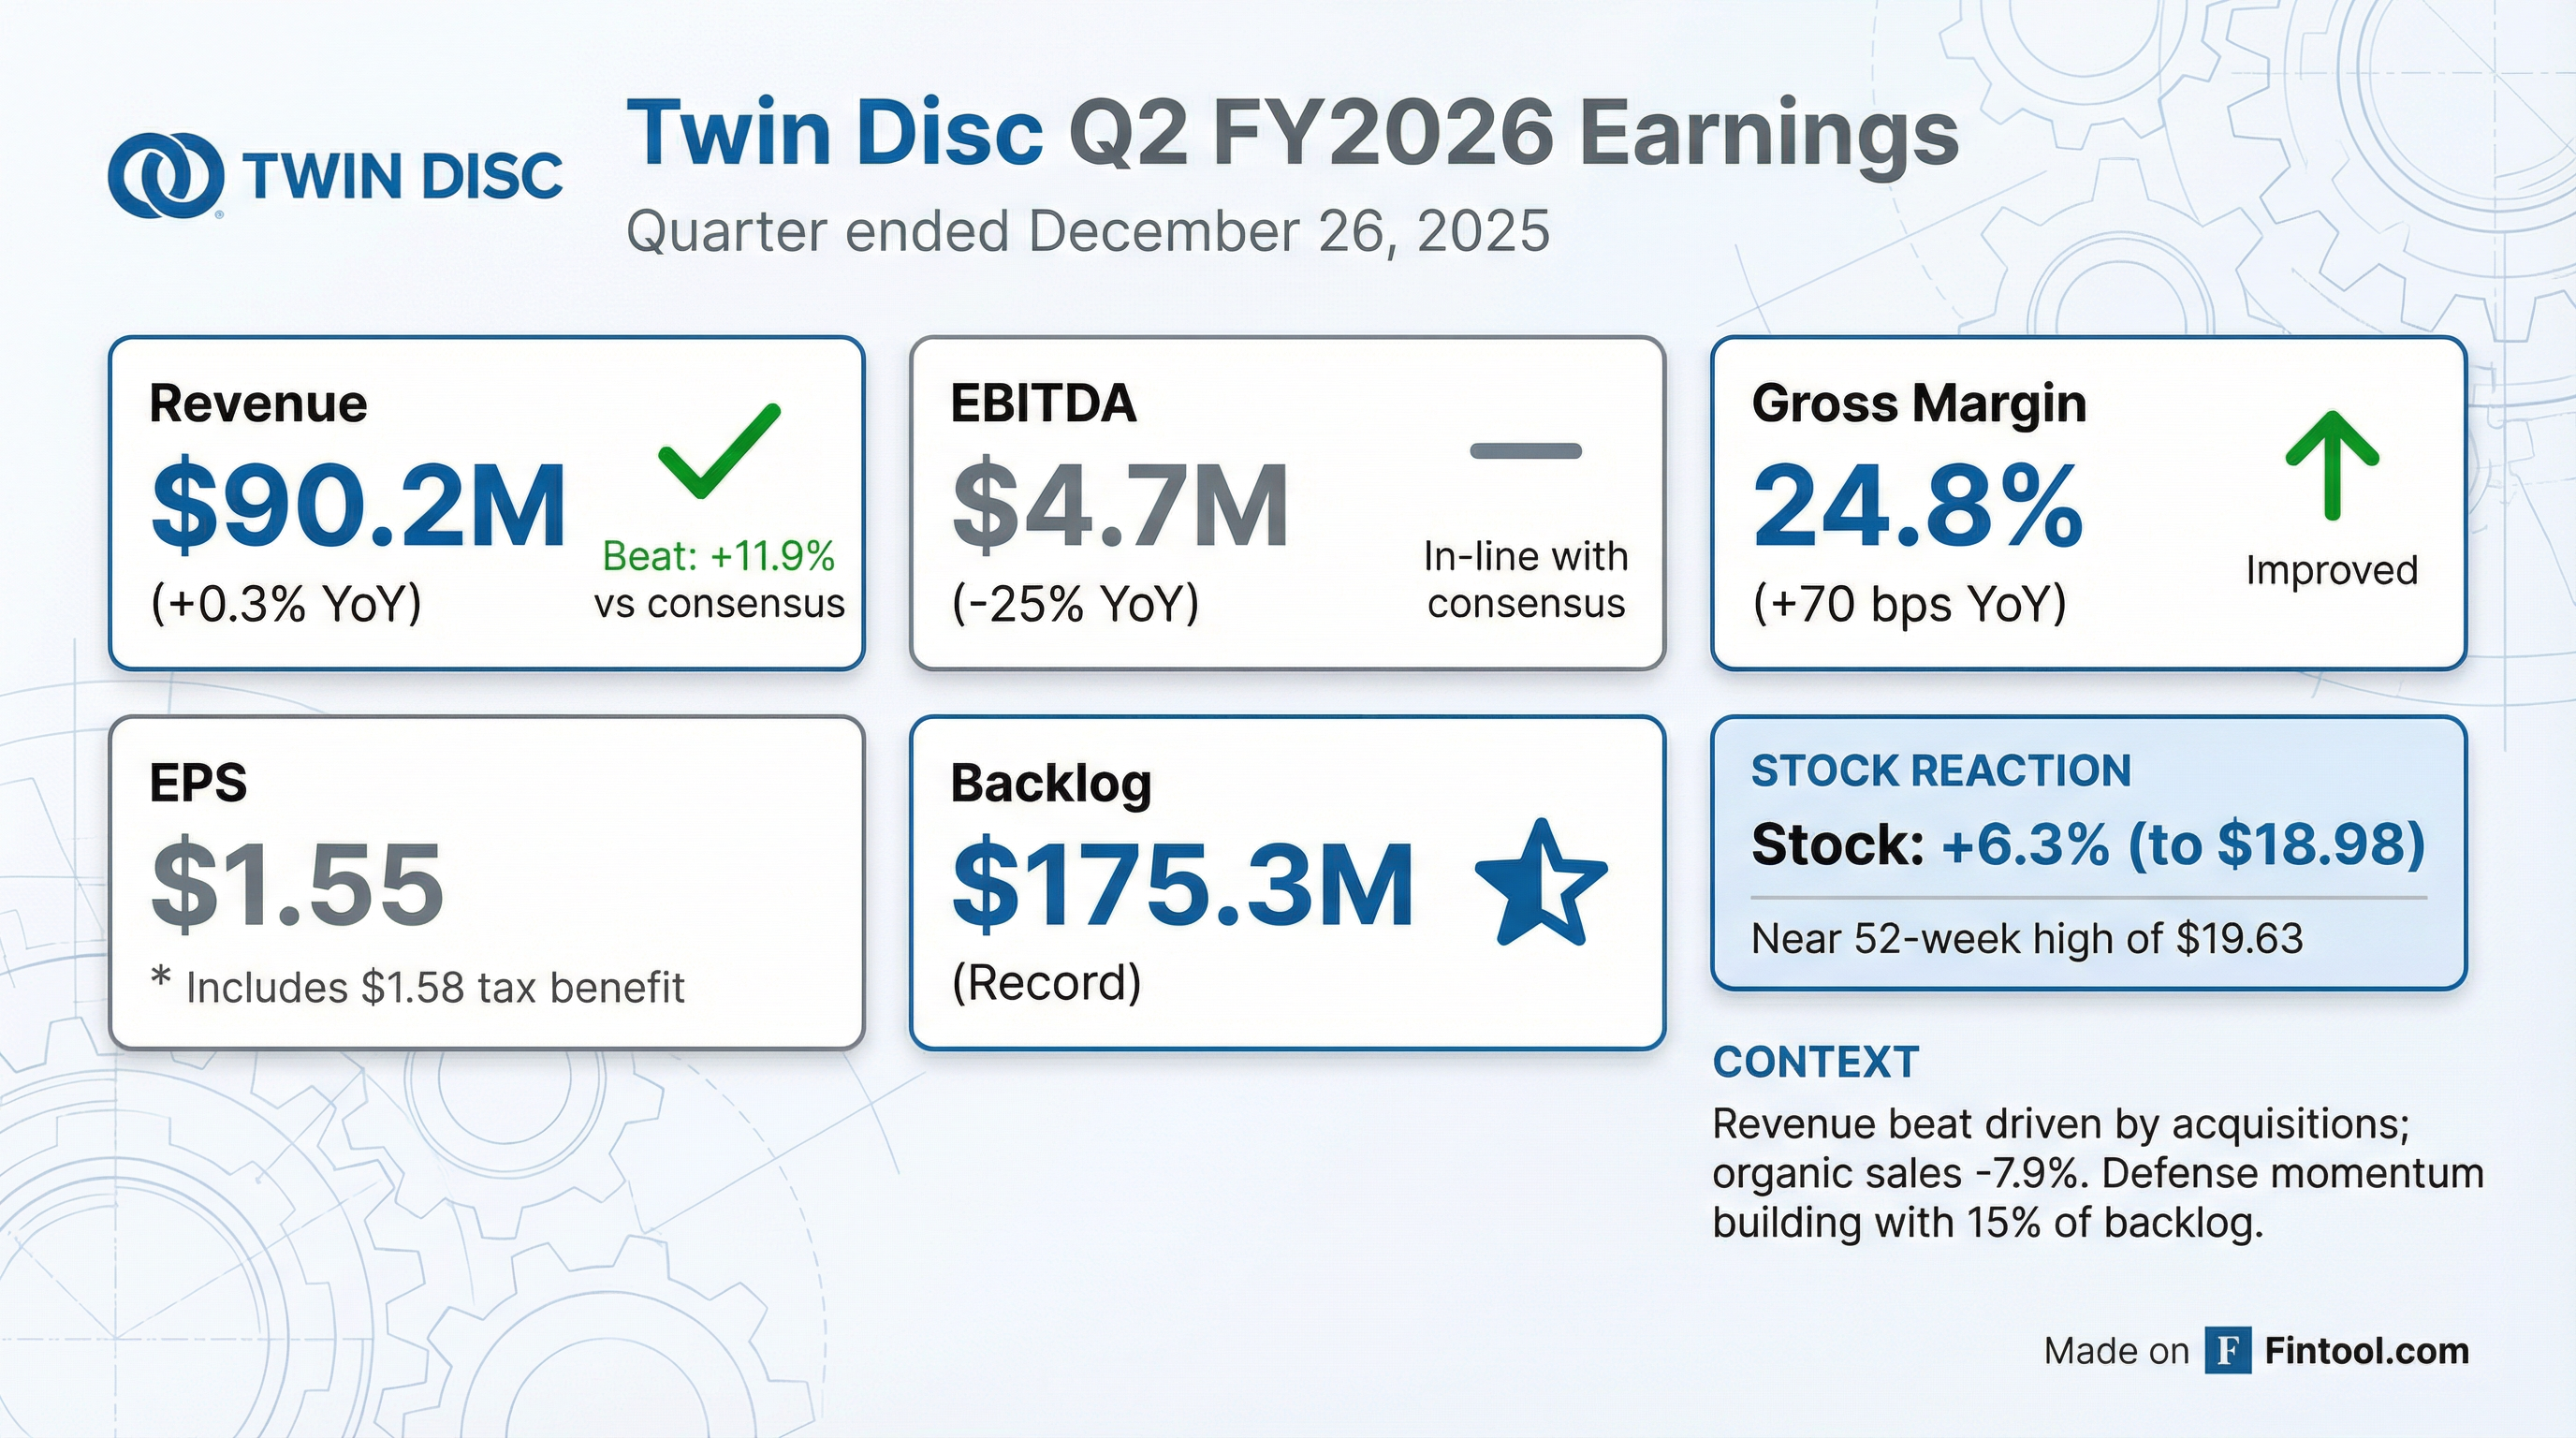
Twin Disc (NASDAQ: TWIN) delivered a double-digit revenue beat in Q2 FY2026, with sales of $90.2M topping consensus of $80.6M by nearly 12% . However, the headline number masks weaker organic trends—sales excluding the Kobelt acquisition and currency effects declined 7.9% year-over-year . The real story: defense momentum is building with backlog at record levels, gross margins expanded, and the stock is trading near 52-week highs.
Did Twin Disc Beat Earnings?
Revenue beat, EBITDA in-line, EPS distorted by tax benefit.
The EPS figure is misleading—$1.58 per diluted share came from reversing a domestic valuation allowance, a non-cash accounting adjustment . Stripping that out, the company would have posted a slight loss.
Year-over-year comparison:
How Did the Stock React?
TWIN shares surged on the results:
- Today: +6.3% to $18.98
- 52-week range: $6.16 – $19.63
- Trading at near all-time highs
The stock has more than tripled from its 52-week low, reflecting improving fundamentals and defense tailwinds.
What's Driving the Numbers?
Segment Performance
Key drivers by segment:
-
Marine & Propulsion (flat): Strength in workboats, government contracts, and Veth's ELITE thruster products offset by softness in Asia Pacific commercial marine . Growing traction for unmanned U.S. Navy vessels .
-
Land-Based Transmissions (-8.1%): Shipment delays to ARFF (aircraft rescue) customers hurt results. North American customers remain cautious, favoring rebuilds over new equipment . Early signs of improvement internationally, including a significant transmission order in China .
-
Industrial (+22%): Acquisition of Kobelt drove the growth. Steady sequential recovery in demand with expanded use of Katsa capabilities .
Geographic Mix Shift
Europe now represents 45% of sales (up from 41%), driven by strong Veth demand in the region . Asia Pacific contracted from 23% to 17%.
The Defense Story
Defense is becoming a more important growth driver for Twin Disc:
Management highlighted growing traction for unmanned U.S. Navy vessels and expanding participation across multiple defense programs, platforms, and geographies .
Record Backlog Provides Visibility
Six-month backlog reached a record $175.3M, up sequentially and year-over-year :
Backlog growth led by propulsion and defense applications, with sustained demand across other product groups . Inventory as a percentage of backlog has improved from 103% to 93%, signaling better working capital efficiency.
Margin Trends
Gross margin improved 70 basis points year-over-year to 24.8%, benefiting from:
- Absence of prior-year inventory-related charges
- Incremental volume benefits
- Successful margin improvement initiatives
However, EBITDA margin compressed from 7.0% to 5.2% due to higher operating expenses and tariff-related impacts .
Historical Gross Margin Trend:
*Values retrieved from S&P Global
Balance Sheet & Leverage
Leverage increased to 1.3x from 0.3x, primarily due to the Kobelt acquisition . Still manageable for a small-cap industrial.
Free Cash Flow:
- Q2 FY26: $1.2M
- Q2 FY25: $5.9M
FCF declined due to higher capex ($3.3M vs $2.8M) and lower operating cash flow.
Tariff Headwinds & Mitigation Timeline
Management flagged tariff impacts as a near-term headwind, with clear mitigation plans:
Current Impact:
- Q2 tariff impact: ~3% of cost of sales
- 50% tariffs on steel/aluminum components sourced overseas
- Most affected: transmissions (parts from overseas, assembled in Racine) and Lufkin industrial products (parts from India)
Mitigation Strategy:
- Moving ARFF assembly to Lufkin (free trade zone) — parts can enter tariff-free, assemble/test/ship without duty impact
- This will recover 10 full percentage points of gross margin on ARFF transmissions
- Timeline: Won't affect this fiscal year; benefits start Q1 FY2027
Near-Term Outlook:
- ARFF transmissions are a smaller % of sales in 2H vs 1H, so tariff drag naturally moderates
- Geographic mix shifting toward North America/Europe (less tariff-exposed regions)
Q&A Highlights
On sequential gross margin decline (CFO Jeff Knutson):
"Tariff expense flows through our revenue line with no margin... that has an impact of 50 or 60 basis points compared to Q1. We had an operational delay at our factory in Finland. We had an isolated quality issue... Those two, in combination, are about 60 basis points. So those are what we would call kind of noise in the quarter that wouldn't recur."
On the surprise China oil & gas order (CEO John Batten):
"I can't make a direct correlation, but we got the order, more or less within a week of Venezuela. It seems like the activity for domestic production in China started to grow when they realized that there may not be a reliable supply chain coming from someplace else... What we anticipated, we were hoping for a budget for the entire fiscal 2026. They came in with one order and exceeded that budget."
On Veth margin sustainability:
"They've done a much better job at estimating their costs, building in known inflationary increases... just on pricing discipline, understanding the value in the marketplace, and going after markets that appreciate the value of what they're selling. They've now tapped into our supply chain in India and are finding alternate sources that may have been sourced in Europe, in lower-cost countries."
On defense capacity investments:
"We've been told [both programs are gonna grow significantly]. So there's focus here in the U.S. to make sure that we have capacity for those marine transmissions, and likewise in Finland, make sure that we can grow... that we have the capacity to meet that growing demand and keep all of our other business."
Long-Term Strategy & FY2030 Targets
Management reiterated their FY2030 targets :
Strategic priorities include:
- Leading hybrid/electric solutions for niche marine and land-based applications
- Continued expansion via acquisitions
- Rationalize global footprint for efficiency
- Increased focus on controls and system integration
Key Takeaways
-
Revenue beat masks organic weakness: The 12% beat was acquisition-driven; organic sales fell 7.9%
-
Defense momentum is real: 15% of backlog, +18% sequential growth, $50-75M pipeline
-
Record backlog = visibility: $175.3M six-month backlog supports 2H expectations
-
Gross margins improving: +70bps YoY despite tariff headwinds
-
Tariff relief coming Q1 FY27: ARFF assembly moving to Lufkin free trade zone will recover 10pp of gross margin on those units
-
China surprise: Single order exceeded full-year oil & gas budget for the region
-
Stock near highs: +6% reaction, trading near 52-week high of $19.63
For the full earnings presentation, see Twin Disc Q2 FY2026 Investor Presentation.
Explore more: Twin Disc Company Profile