VALLEY NATIONAL BANCORP (VLY)·Q4 2025 Earnings Summary
Valley National Posts Strong Q4 as NIM Expansion Tops Guidance
January 29, 2026 · by Fintool AI Agent
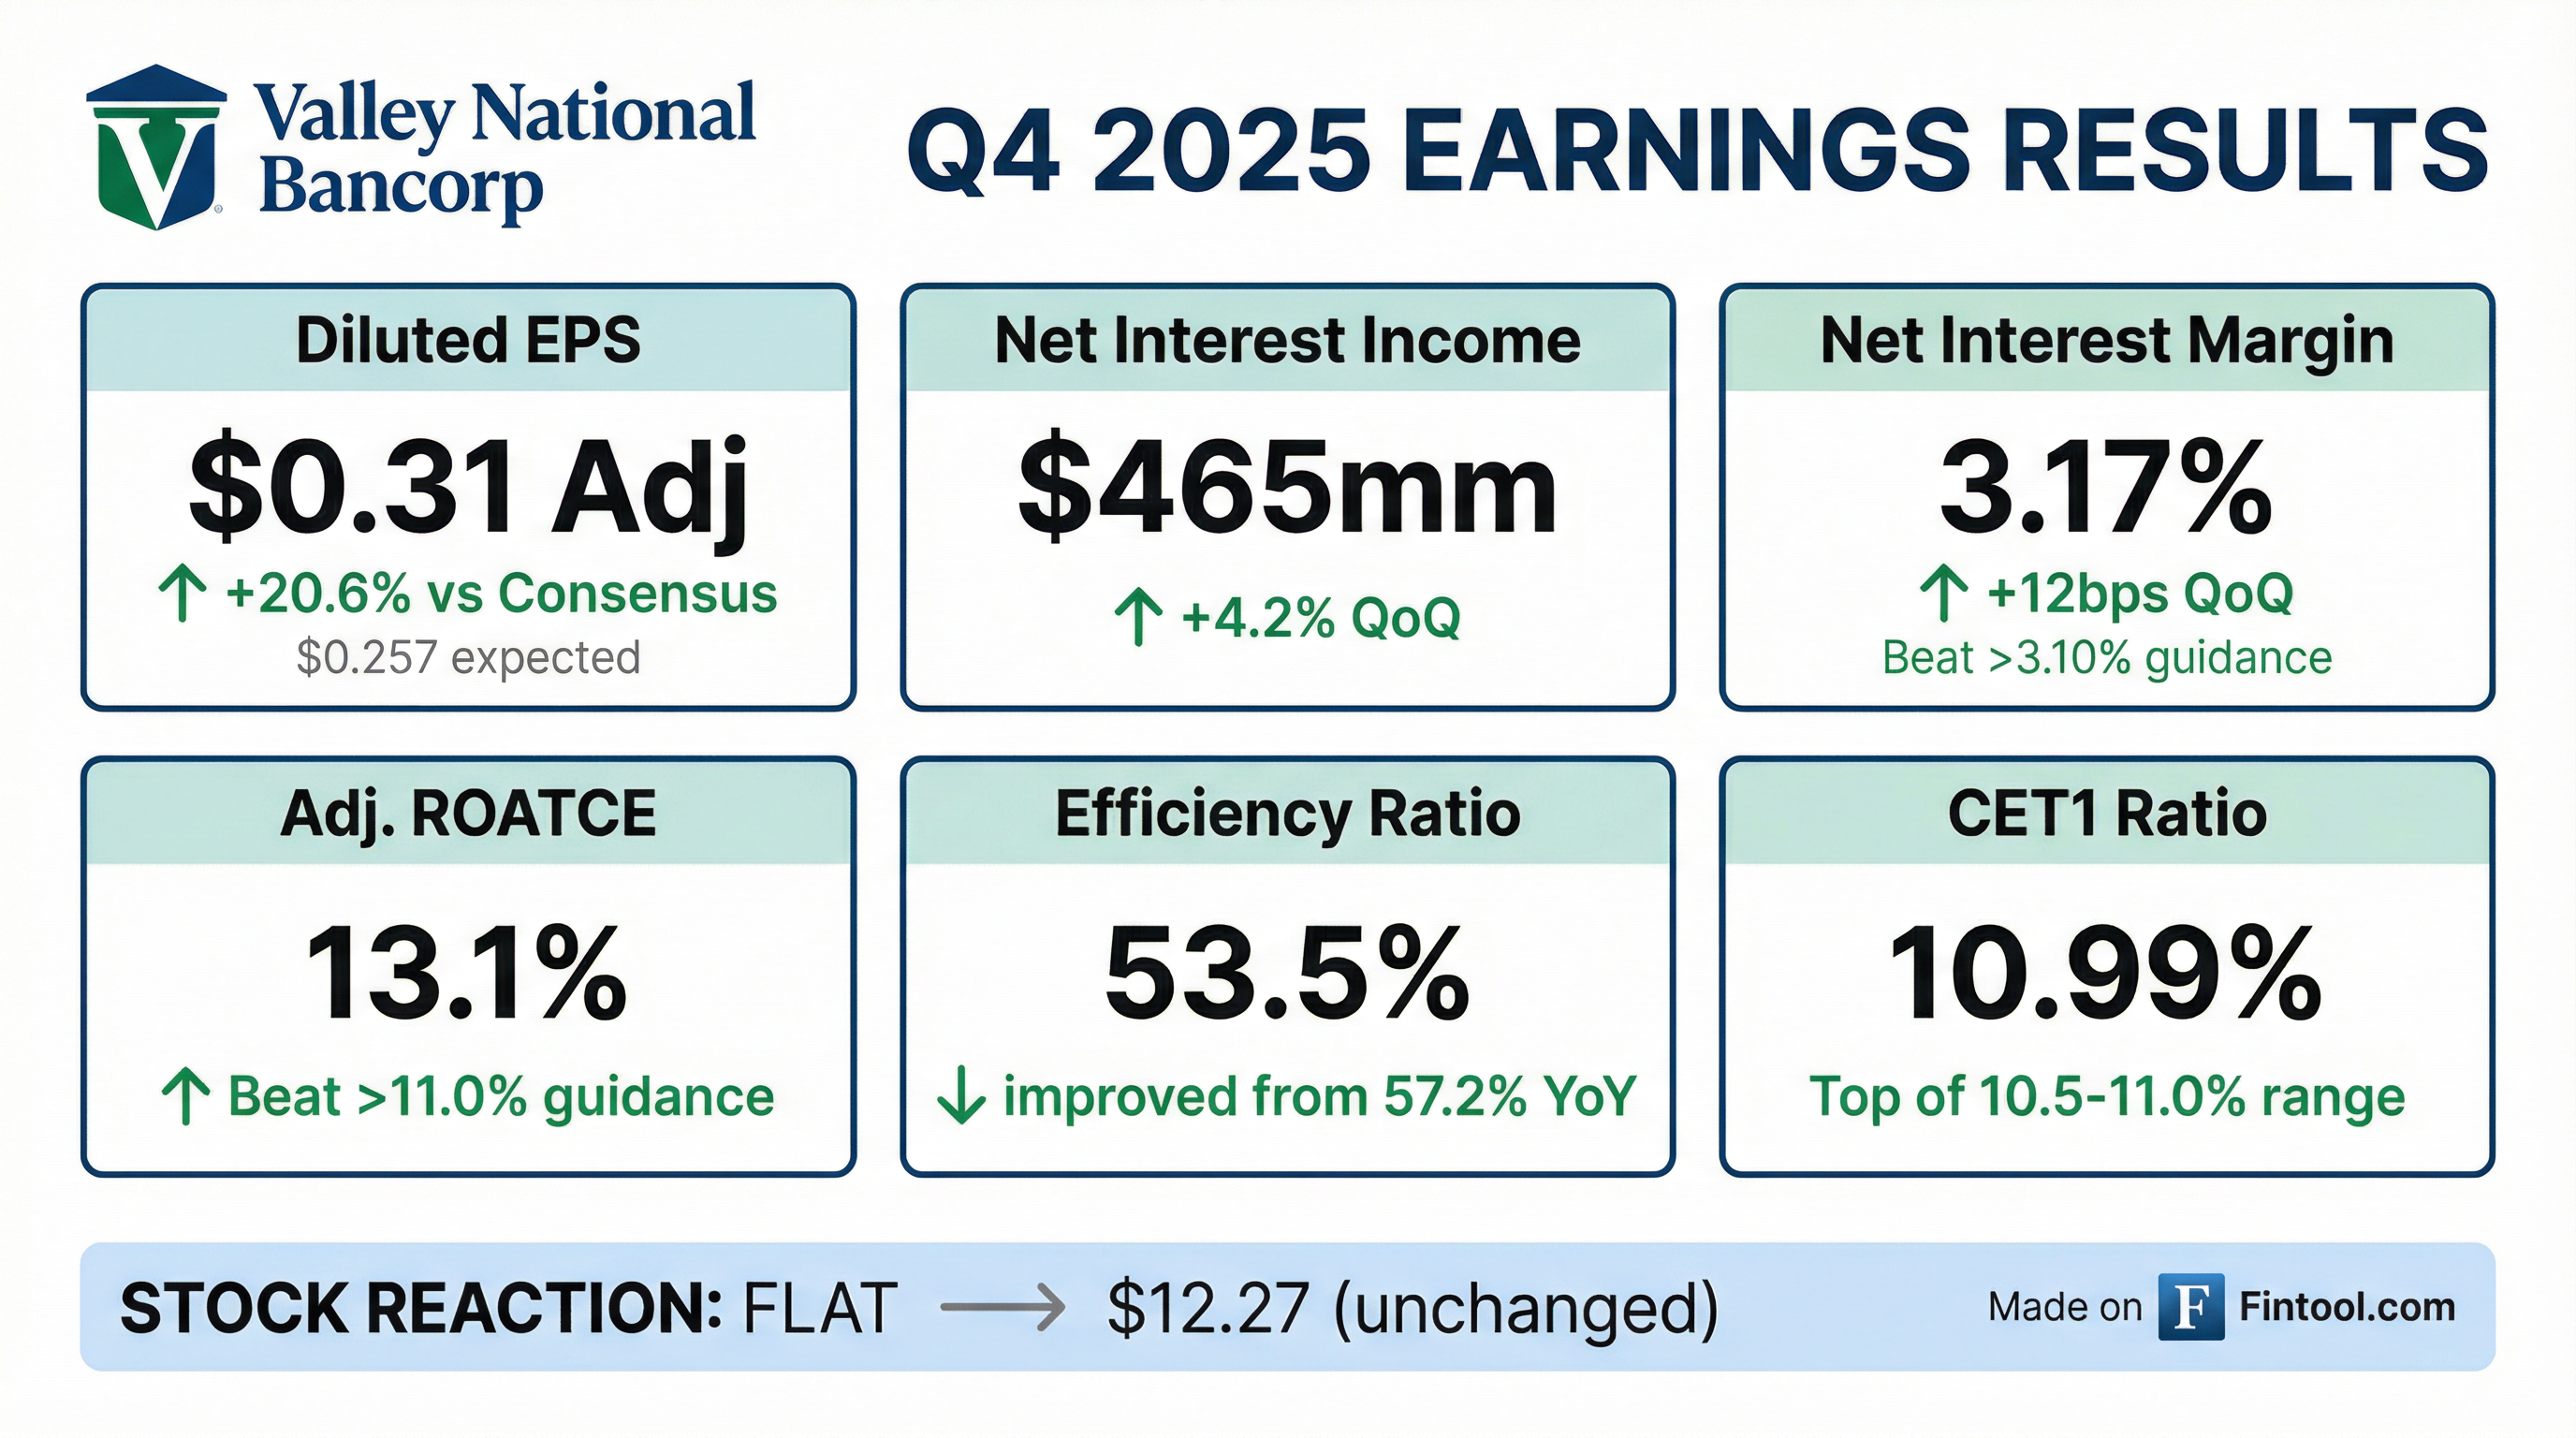
Valley National Bancorp delivered a strong finish to 2025, with adjusted EPS of $0.31 beating consensus expectations by over 20% as net interest margin expanded faster than anticipated. The $64 billion regional bank continues its profitability recovery, with Q4 representing the second consecutive quarter of meaningful beats after a challenging 2024 marked by elevated credit costs and deposit pressures.
Management raised the bar for 2026, guiding to 11-13% net interest income growth and an exit NIM above 3.30%—signaling confidence that the margin tailwinds have staying power.
Did Valley National Beat Earnings?
Yes—convincingly. Valley beat on both the top and bottom line while exceeding its own profitability targets across the board.
The beat was driven by faster-than-expected NIM expansion and continued improvement in operating leverage. Pre-provision net revenue reached $252mm (adjusted), up from $238mm in Q3 and $206mm a year ago.
Valley beat all four of its own profitability targets entering 2025:
How Did the Stock React?
Shares were essentially flat following the release, closing at $12.27. However, context matters: VLY had already rallied 64% from its 52-week low of $7.48 heading into the print, suggesting much of the improvement was already priced in.
The muted reaction likely reflects that the strong quarter was anticipated given the favorable rate environment and Valley's prior guidance, combined with valuation that had already re-rated meaningfully.
What Did Management Guide?
Valley provided a comprehensive 2026 outlook that signals continued momentum:
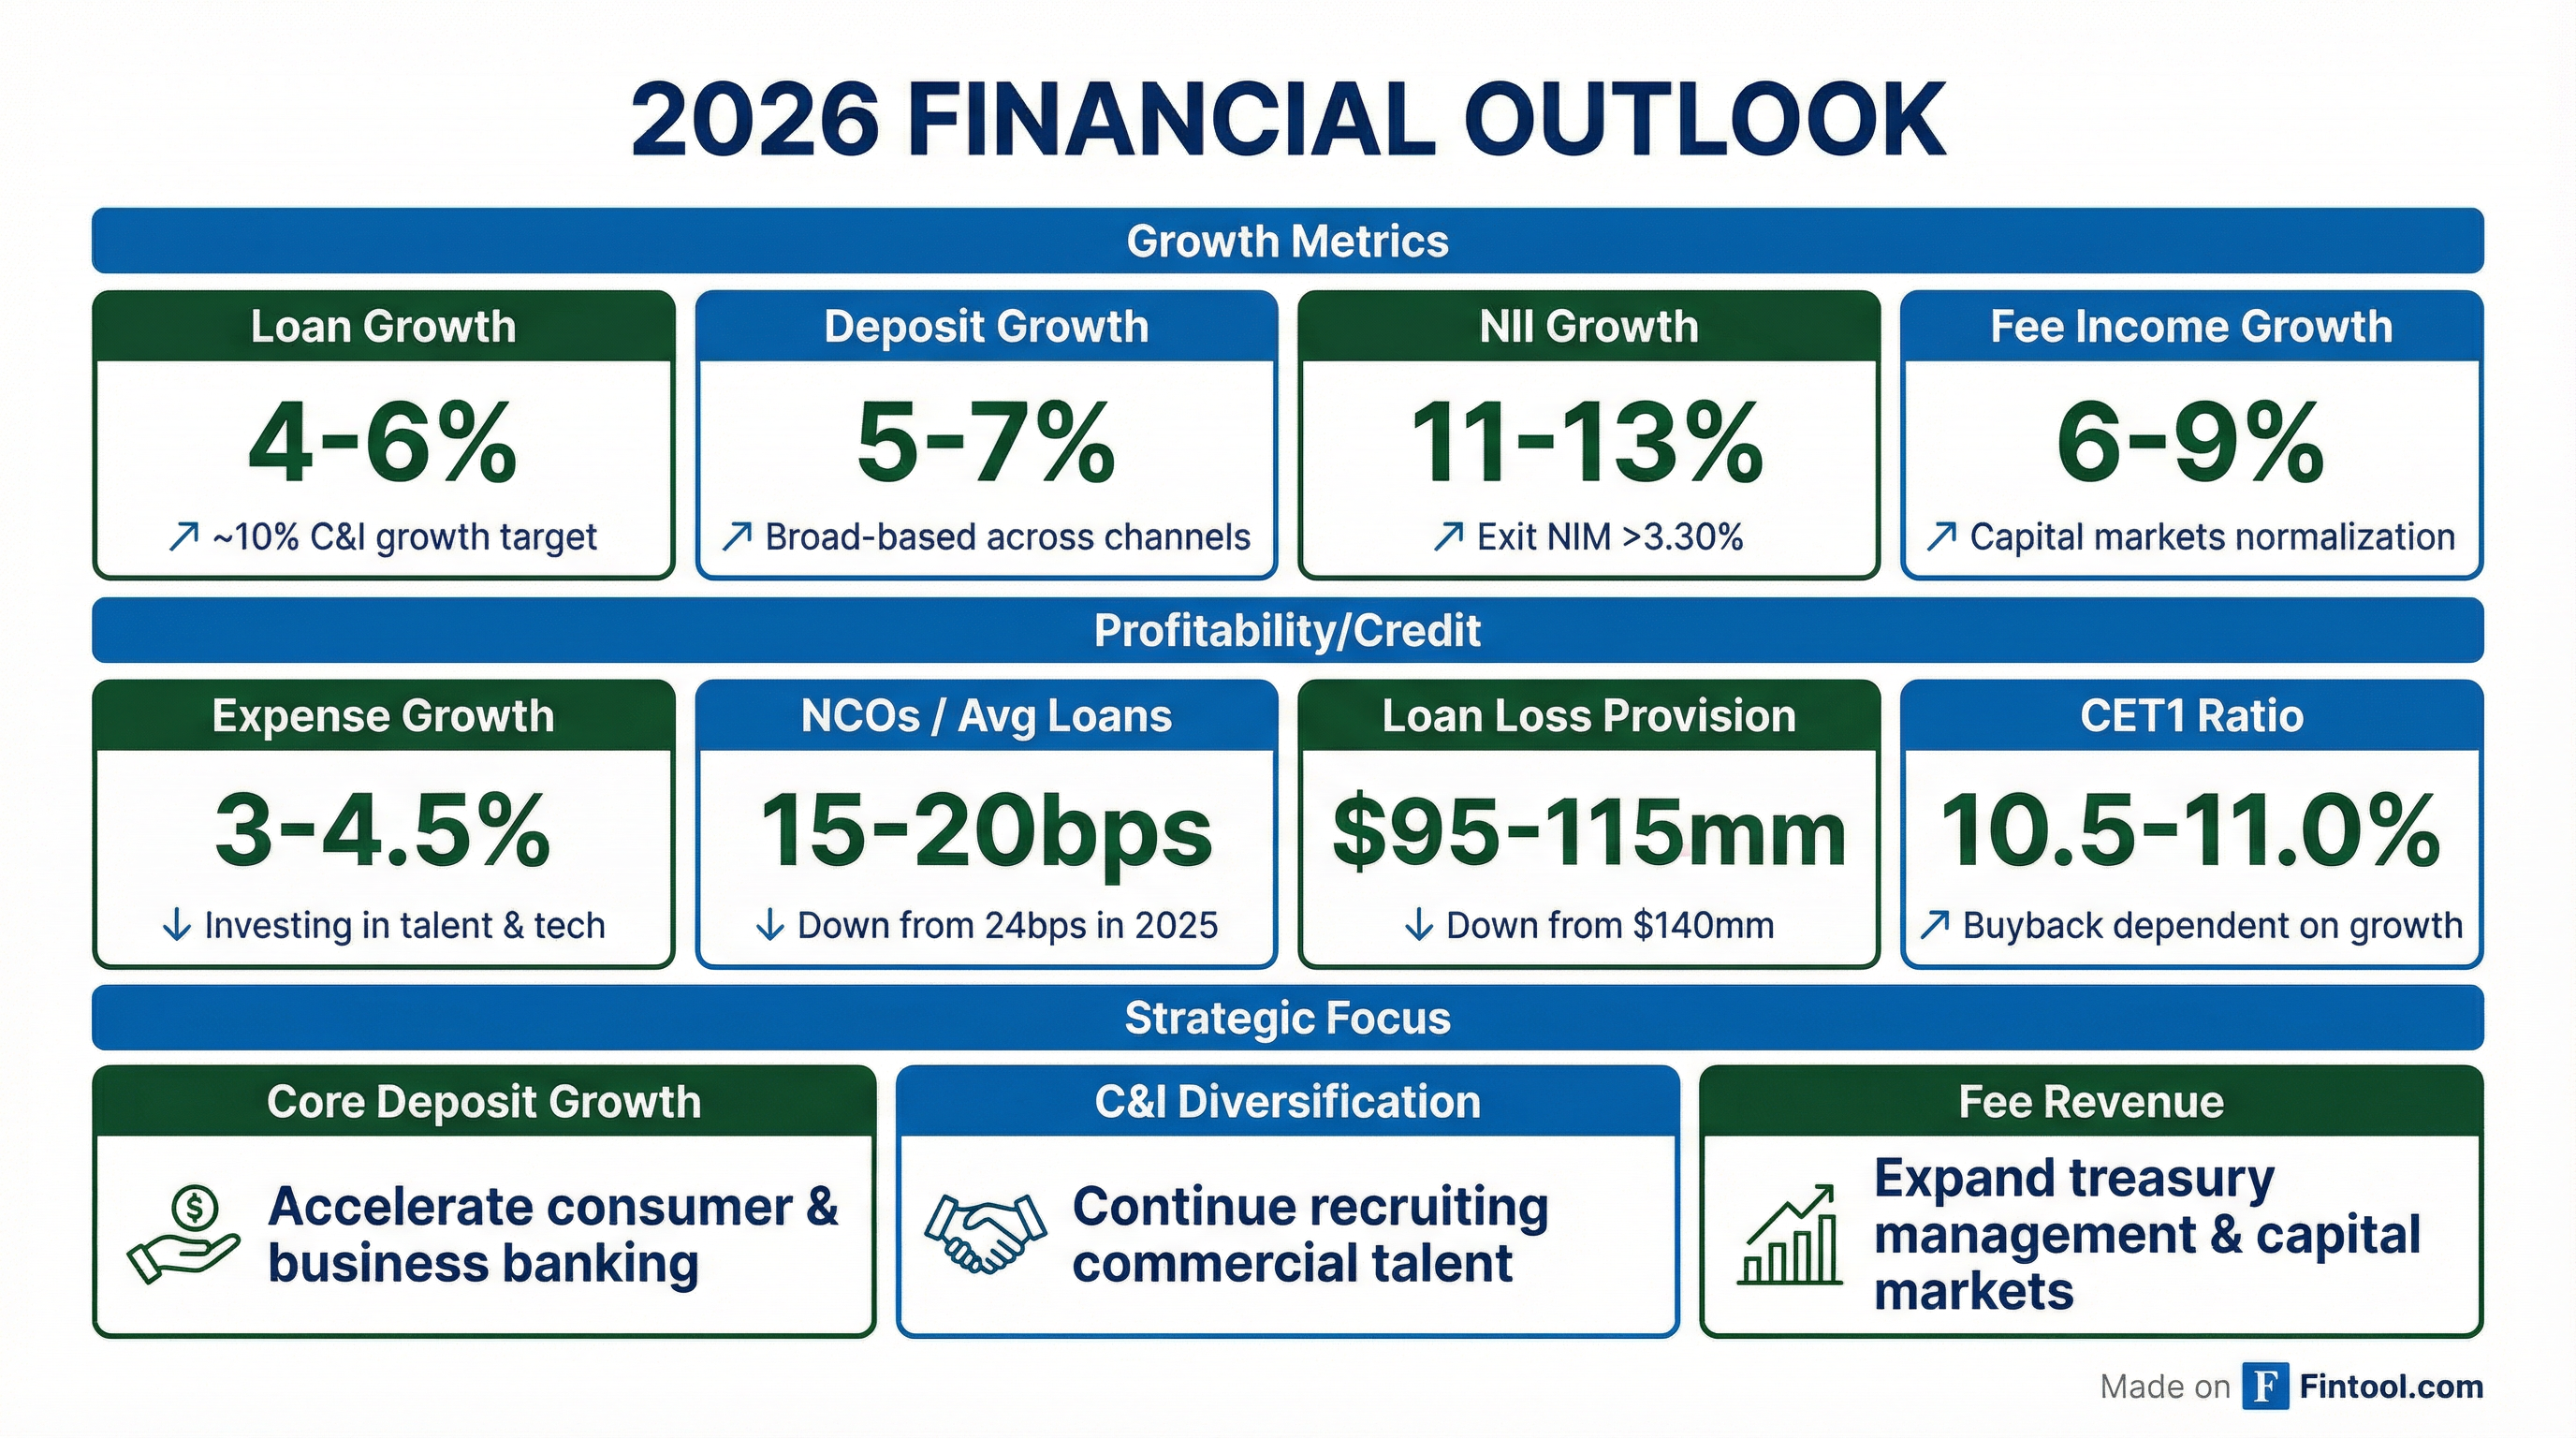
Key 2026 Targets
The NIM story is key. Management expects NIM to dip slightly in Q1 2026 due to seasonal factors (lower day count, NIB moderation), then expand back to mid-3.30s by Q4 2026. Key drivers:
- $600mm FHLB advances at 4.7% maturing in 2026, to be replaced lower
- $1.8B fixed-rate loans at ~4.7% repricing 150-200bps higher
- ~10% C&I loan growth at attractive spreads
- Continued mix shift toward lower-cost core deposits
What Changed From Last Quarter?
Several meaningful improvements from Q3 2025:
Net Interest Margin Acceleration
NIM expanded 12bps sequentially to 3.17% from 3.05%, driven by deposit cost declines outpacing loan yield compression. Deposit costs fell 44bps QoQ while Fed Funds dropped 44bps, demonstrating strong deposit beta on the way down.
Direct Deposit Momentum
Direct deposits (ex-indirect/brokered) grew to 90% of total deposits, up from 89% in Q3 and 86% a year ago. Fully insured indirect deposits fell to $5.4bn from $5.8bn.
Credit Normalization
Net charge-offs fell to $23mm (0.18% annualized) from $15mm in Q3, while criticized/classified loans declined to 8.0% of total loans from 8.8%.
Capital Returns
Valley returned $109mm to shareholders in Q4 through dividends ($62mm) and buybacks ($47mm), representing over 50% of organically generated capital. Approximately 19mm shares remain under the existing buyback authorization.
Segment Performance
Commercial Real Estate (40% of loans)
CRE concentration improved to 333% of total risk-based capital, down from 362% a year ago and 474% at year-end 2023. The portfolio has a weighted average LTV of 59% and DSCR of 1.69x.
C&I (35% of loans)
C&I loans grew to $11.0bn, with a 19% CAGR since 2017. Geographic diversification continued with 56% of commercial loans now in Southeast/Other markets vs. 21% in 2017.
Fee Income
Non-interest income reached $76mm, up 18% QoQ, driven by strong capital markets activity ($15.5mm) and deposit service charges ($17mm).
Credit Quality
Credit metrics remained stable with some continued improvement in criticized assets:
Cumulative CRE net charge-offs over the last 8 quarters totaled 0.62% of average CRE loans—well below the 9.1% assumed in the Federal Reserve's 2024 Severely Adverse DFAST scenario.
Capital Position
Valley maintained capital ratios at the high end of target ranges:
TBV per share grew 8.2% YoY, with cumulative shareholder returns (dividends + TBV growth) of 116% since 2017 vs. 106% for the peer median.
Strategic Priorities for 2026
Management outlined three key growth imperatives, supported by ongoing investments in technology and talent:
1. Grow Core Deposits
- Accelerate consumer, small business, and business banking sales
- Further penetrate commercial deposit opportunities with treasury management
- Leverage specialty niches including Partner Banking
- Geographic expansion in targeted growth markets
CEO Robbins emphasized the deposit achievement: "Our substantial core deposit growth stands out as one of our most significant achievements of the past year... On a year-over-year basis, we grew core deposits by nearly $4 billion or 9%."
2. Generate Diverse Loan Growth
- Continue recruiting experienced commercial talent in existing and new markets
- Leverage branding efforts and service model enhancements
- Utilize robust product set for C&I customer acquisition
- Identify incremental commercial specialty verticals
Robbins highlighted recent hires: "Recent additions to our teams, New Jersey, California, and Florida, have already generated loan and deposit activity and directly support the aforementioned expansion in our pipelines."
3. Drive Sustainable Fee Revenue
- Expand treasury management product utilization
- Increase capital markets activity (syndication, FX, swaps)
- Improve integration of wealth offerings with commercial sales
Technology & AI Investments
Management highlighted ongoing technology investments: "Past investments in data analytics, artificial intelligence, and sales effectiveness are making our bankers more productive across the franchise. These investments also ensure that newly onboarded relationship bankers have the tools necessary to hit the ground running and contribute more quickly to our consolidated results."
Branding Campaign
Valley launched a new "That's How" branding campaign to support consumer and small business growth. Robbins noted: "We hired Patrick Smith to come into the organization during this past year. Really strong, proven leader within that space... For me, it's a holistic approach. You can't have branding without the people."
Risks and Concerns
Office exposure: While granular ($3.3mm average size), the $3.0bn office portfolio warrants monitoring given secular headwinds. Current metrics are solid (63% LTV, 1.91x DSCR) but Manhattan and NYC exposure ($700mm combined) faces continued pressure.
Rate sensitivity: While NIM expansion is a tailwind currently, Valley's asset-sensitive positioning means a sharp decline in rates could compress margins faster than deposit costs adjust.
Expense discipline: Q4 included ~$8mm of "infrequent items" including performance compensation and branding investments. Professional and legal fees are expected to remain elevated near-term.
Q&A Highlights
The earnings call Q&A provided additional color on several key topics:
NIM Trajectory Through 2026
CFO Travis Lan outlined the expected path: "In the first quarter, I would anticipate the margin comes down a little bit from the 3.17 that we put up this quarter, and then grows from that level back to that kind of mid-3.30s that we talked about by the fourth quarter."
Key drivers supporting margin expansion:
- $600mm of FHLB advances at 4.7% maturing in 2026, to be replaced lower
- $1.8B of fixed-rate loans at ~4.7% repricing 150-200bps higher
- Deposit spot rate of 2.32% vs. 2.45% quarterly average, with new relationships at 2.17% blended rate (down from 2.91% in Q3)
Pipeline Strength
CEO Ira Robbins highlighted exceptional pipeline momentum: "Our immediate and late-stage pipelines are exceptionally strong, up over $1 billion or nearly 70% from just a year ago, driven by a $600 million increase in C&I and $700 million increase in commercial real estate."
Commercial banking head Gino Martocci added: "We finished 12/25, $1.2 billion, actually higher than 12/24. And also, since 12/25, we've grown the pipeline by another $300 million, and despite closing about $500 million worth of loans so far."
Capital Returns Outlook
Management expects $150-200mm of share repurchases in 2026, consistent with Q4 pace. Travis Lan explained: "CET1 on a gross basis would increase 130 to 140 basis points next year. About 50 basis points of that would be used to support loan growth, 50 basis points would be paid out in the dividend, and it would leave you with 30 or 40 basis points of excess CET1 for the buyback."
C&I NPL Increase Explained
Mark Saeger addressed the C&I non-performing loan increase: "C&I growth was really driven by one credit in the portfolio, a larger credit that we've had within the portfolio for over 10 years, in-market syndicated credit, unique business segment that's supported by structural payments... Because of the length of that payback, combined with a recent modification of the loan, we did move that to non-accrual and established what we feel is an adequate specific on that loan."
M&A Stance
CEO Robbins was measured on M&A: "There's an unbelievable organic story that's really unraveling here at Valley. We brought in tremendous leaders across the organization... There have to be something that would make a lot of sense for us to really divert any kind of attention away from that."
Operating Leverage
Robbins highlighted efficiency gains: "When I took over CEO, we were 3,351 employees and about $20 billion in size. Today, we're 3,634 and $60 billion in size, so in 280 ± employees and triple the size of the organization."
Key Takeaways
- Beat on all metrics: Adjusted EPS of $0.31 beat by 20.6%; NIM, ROA, and ROATCE all exceeded guidance
- NIM momentum continues: 3.17% in Q4, expected to dip in Q1 then recover to mid-3.30s by Q4 2026
- Pipeline surging: Up $1B+ or ~70% YoY, with continued growth into January
- Strong 2026 outlook: 11-13% NII growth, $150-200mm buybacks, improving credit costs
- Credit stabilizing: Criticized loans down 8% QoQ, NCOs normalizing, single credit drove C&I NPL uptick
- Organic focus: Management prioritizing organic growth over M&A given strong momentum
Valley's turnaround story gained further traction in Q4, with profitability metrics reaching their highest levels since late 2022. The combination of exceptional pipeline momentum, deposit repricing tailwinds, and disciplined expense management positions the bank well for continued profitability improvement in 2026.
Sources: Valley National Bancorp Q4 2025 Earnings Call Transcript ; Valley National Bancorp Q4 2025 Earnings Presentation ; S&P Global consensus estimates*