WESBANCO (WSBC)·Q4 2025 Earnings Summary
WesBanco Posts 45% Full-Year EPS Growth as Premier Integration Delivers Operating Leverage
January 28, 2026 · by Fintool AI Agent
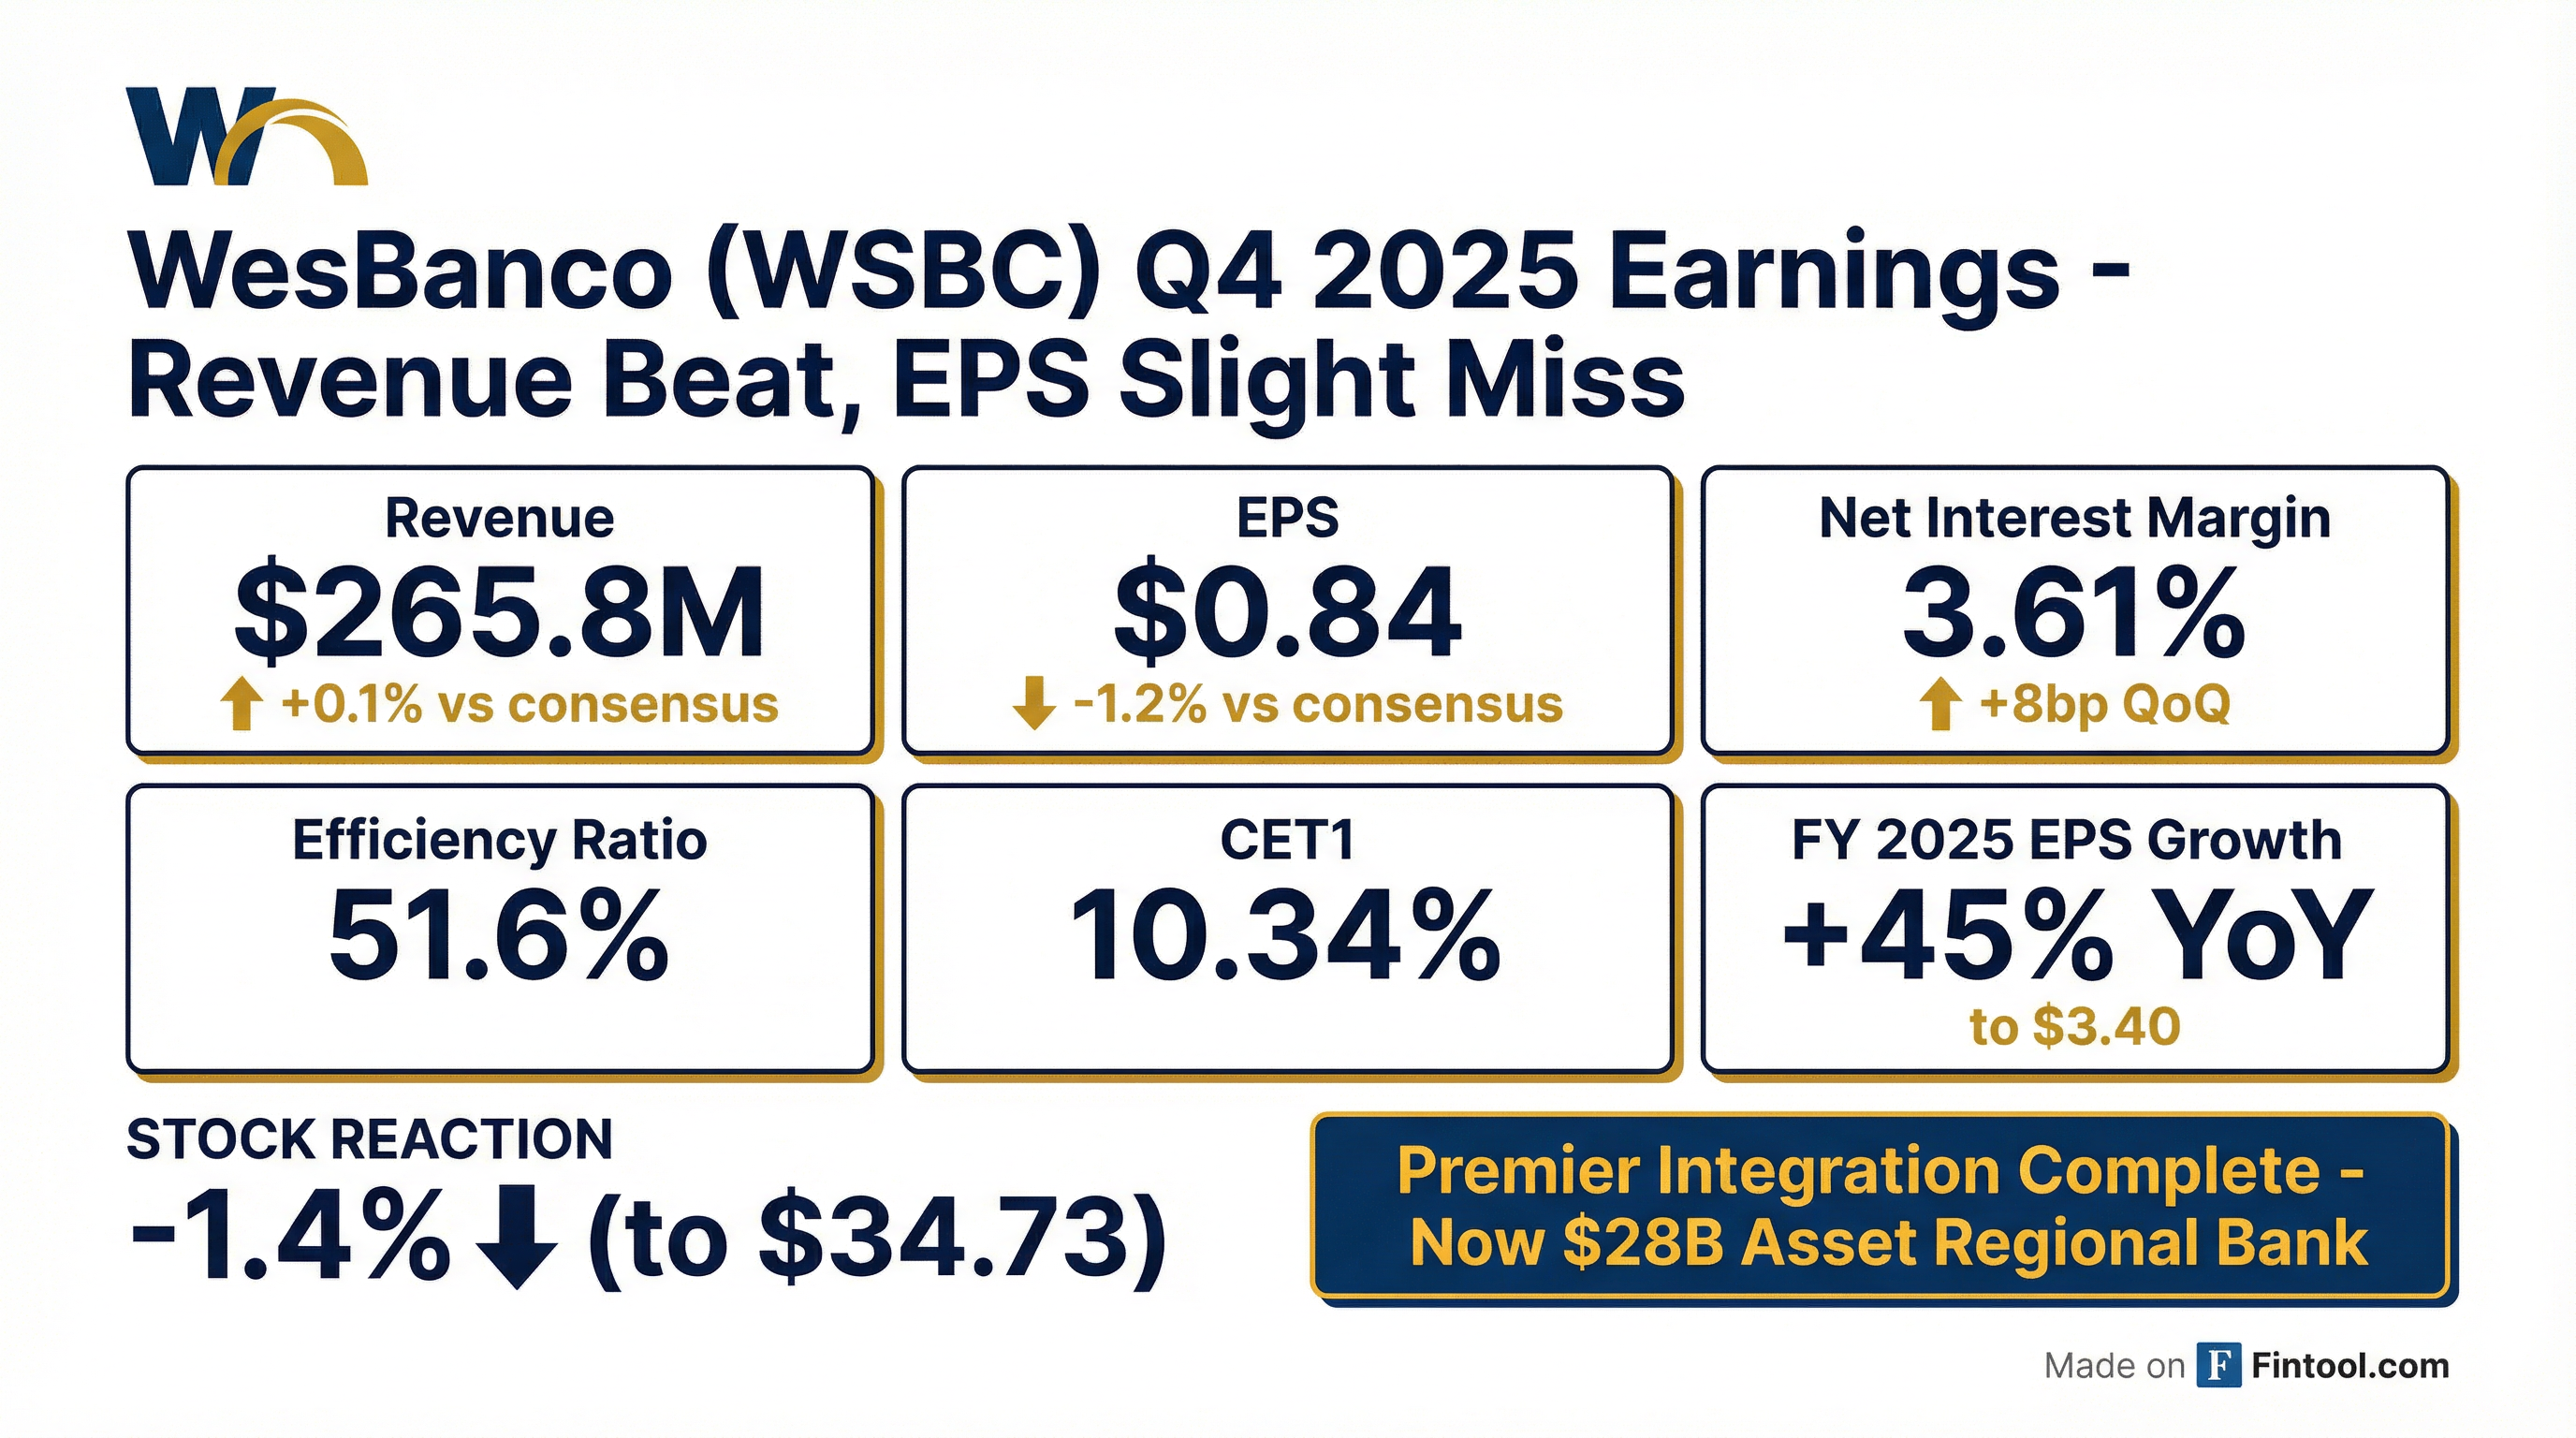
WesBanco (WSBC) reported Q4 2025 results that were essentially in-line with expectations—a slight EPS miss offset by a modest revenue beat. The real story is the full-year transformation: adjusted EPS of $3.40 represents 45% growth over 2024, driven by the Premier Financial acquisition that closed in February 2025 and pushed WesBanco into the top 50 U.S. banks by assets.
Did WesBanco Beat Earnings?
Values retrieved from S&P Global
The quarter's profitability metrics underscore solid execution:
Management highlighted that pre-tax, pre-provision earnings grew 105% year-over-year for the full year—a function of scale, margin expansion, and disciplined expense management.
How Did the Stock React?
WesBanco shares traded down 1.4% to $34.73 following the earnings release. The muted reaction suggests the strong operating performance was largely priced in—the stock rallied 33% from its 52-week low heading into earnings.
What Did Management Guide for 2026?
Management provided comprehensive 2026 guidance anchored on two Fed rate cuts (April and July):
Net Interest Margin Trajectory
CFO Dan Weiss explained the Q1 pause: "We really effectively pulled forward the next 3-5 basis points that would have otherwise been projected for the first quarter into the fourth quarter" due to exceptional deposit growth.
Loan Growth vs. CRE Payoff Headwinds
CRE payoffs are expected to remain elevated but weighted toward the first half—down from the $415M surge in Q4 2025 alone.
Expense & Profitability Targets
- Q1 expense run rate: Roughly flat vs Q4
- Branch savings: 27 closures (Jan 23rd) generate ~$6M annual savings, realized mid-Q1
- Marketing: Up ~$800K/quarter for brand awareness in new markets
- Tax rate: 20.5%-21.5%
- Profitability targets: ROA ~1.30%, ROATCE high teens
What's Driving Growth? Healthcare Vertical & LPO Expansion
Healthcare Vertical Momentum
The new Healthcare Vertical—launched in 2025—emerged as a significant growth engine:
- New loans: ~$500M in first year
- Swap fees: $3M contribution
- Deposits & Treasury: Full relationship banking approach
- Marquee deal: Lead bank on skilled nursing provider syndication in Virginia
CEO Jeff Jackson on the opportunity: "We feel like that will be one of the main growth engines for us this year, and a great offset to many of the CRE payoffs."
Loan Production Office Strategy
The LPO model is working—40%+ of the pipeline comes from new markets:
Jackson emphasized the model's success: "We've really kind of feel like we've perfected the LPO strategy, and we're seeing in our results, we're seeing in our pipelines, and we're gonna continue doing that."
NIM Expansion: The Puts and Takes
The 8bp sequential NIM expansion to 3.61% exceeded the 3-5bp guidance due to exceptional deposit growth:
Tailwinds
- CD repricing: $1B in Q1 from 3.75% down 25-50bp; $1.1B in Q2
- Securities cash flows: $250M/quarter at 3.3% reinvesting at 4.7% (+140bp pickup)
- FHLB borrowings: 96% of $1.2B maturing at ~4%, repricing lower
- Spot deposit rate: 2.38% (vs 2.45% Q4 avg)—trending down
Headwinds
- Seasonal deposit outflows: Typical Q1 pattern
- New loan yields: December spot rate ~6.01% (vs 6.15% Q4 originations)
- Accretion runoff: ~25bp in Q1, declining 1-2bp per quarter
Capital Deployment Priorities
CEO Jackson laid out the capital allocation hierarchy clearly:
- Dividends — committed
- Loan growth — primary focus
- Buybacks — CET1 target 10.5%-11%, building 15-20bp/quarter
- M&A — "far distant fourth... we don't see that happening this year"
With CET1 building 15-20bp per quarter, buyback optionality emerges by mid-2026 if loan growth doesn't fully absorb capital generation.
Fee Business Momentum
Record fee income reflects both Premier scale and organic initiatives:
Commercial purchase card spend grew from $100K/month to $7M/month with 130+ customers (up from 5 in March 2025). Management expects $10M+/month in 2026.
Credit Quality: Still Outperforming Peers
Credit metrics remain pristine and better than the $20-50B asset peer group:
Criticized and classified loans continued declining in Q4. The ACL of $219M (1.14%) is supplemented by fair value marks on acquired loans providing additional loss absorption.
Full-Year 2025 Transformation
The Premier integration transformed WesBanco from a $19B regional into a top-50 U.S. bank by assets—all while improving operating metrics.
Q&A Highlights
On CRE payoff trajectory (Daniel Tamayo, Raymond James): Management expects $600-800M in 2026 payoffs, weighted to H1, as developers continue refinancing to permanent markets. The elevated payoffs are a sector-wide phenomenon as loans originated at lower rates finally roll off bank balance sheets.
On branch optimization (Russell Gunther, Stephens): The 27 closures are fully reflected in guidance. Management will "absolutely" evaluate additional closures in the back half of 2026—having closed 93 branches since 2019.
On M&A appetite (Manuel Navas, Piper Sandler): Jackson was emphatic: "dividends, growth, buybacks, and then, far distant M&A... we don't see that happening this year." The focus is on organic expansion through LPOs and talent acquisition.
On securities portfolio (Catherine Mealor): Targeting 15-17% of total assets, currently at 16%. Balance between liquidity and maximizing return on equity through the higher-yielding loan book.
What to Watch Going Forward
-
CRE payoff normalization: Can H2 2026 payoffs decelerate enough to accelerate net loan growth?
-
Healthcare vertical scale: Management targeting continued expansion—watch for new syndication wins and geographic reach
-
LPO conversion: Chattanooga branch opening (April) will test the model's retail deposit-gathering capability
-
Buyback initiation: CET1 should exceed 10.5% target by Q2, opening buyback optionality
-
Fee momentum: Purchase card, treasury management, and swap fees all tracking well—sustainability matters
Data sourced from WesBanco Q4 2025 Earnings Conference Call (January 28, 2026) and S&P Global Market Intelligence.