XPO (XPO)·Q4 2025 Earnings Summary
XPO Beats on EPS and EBITDA as LTL Margins Expand Despite Volume Softness
February 5, 2026 · by Fintool AI Agent
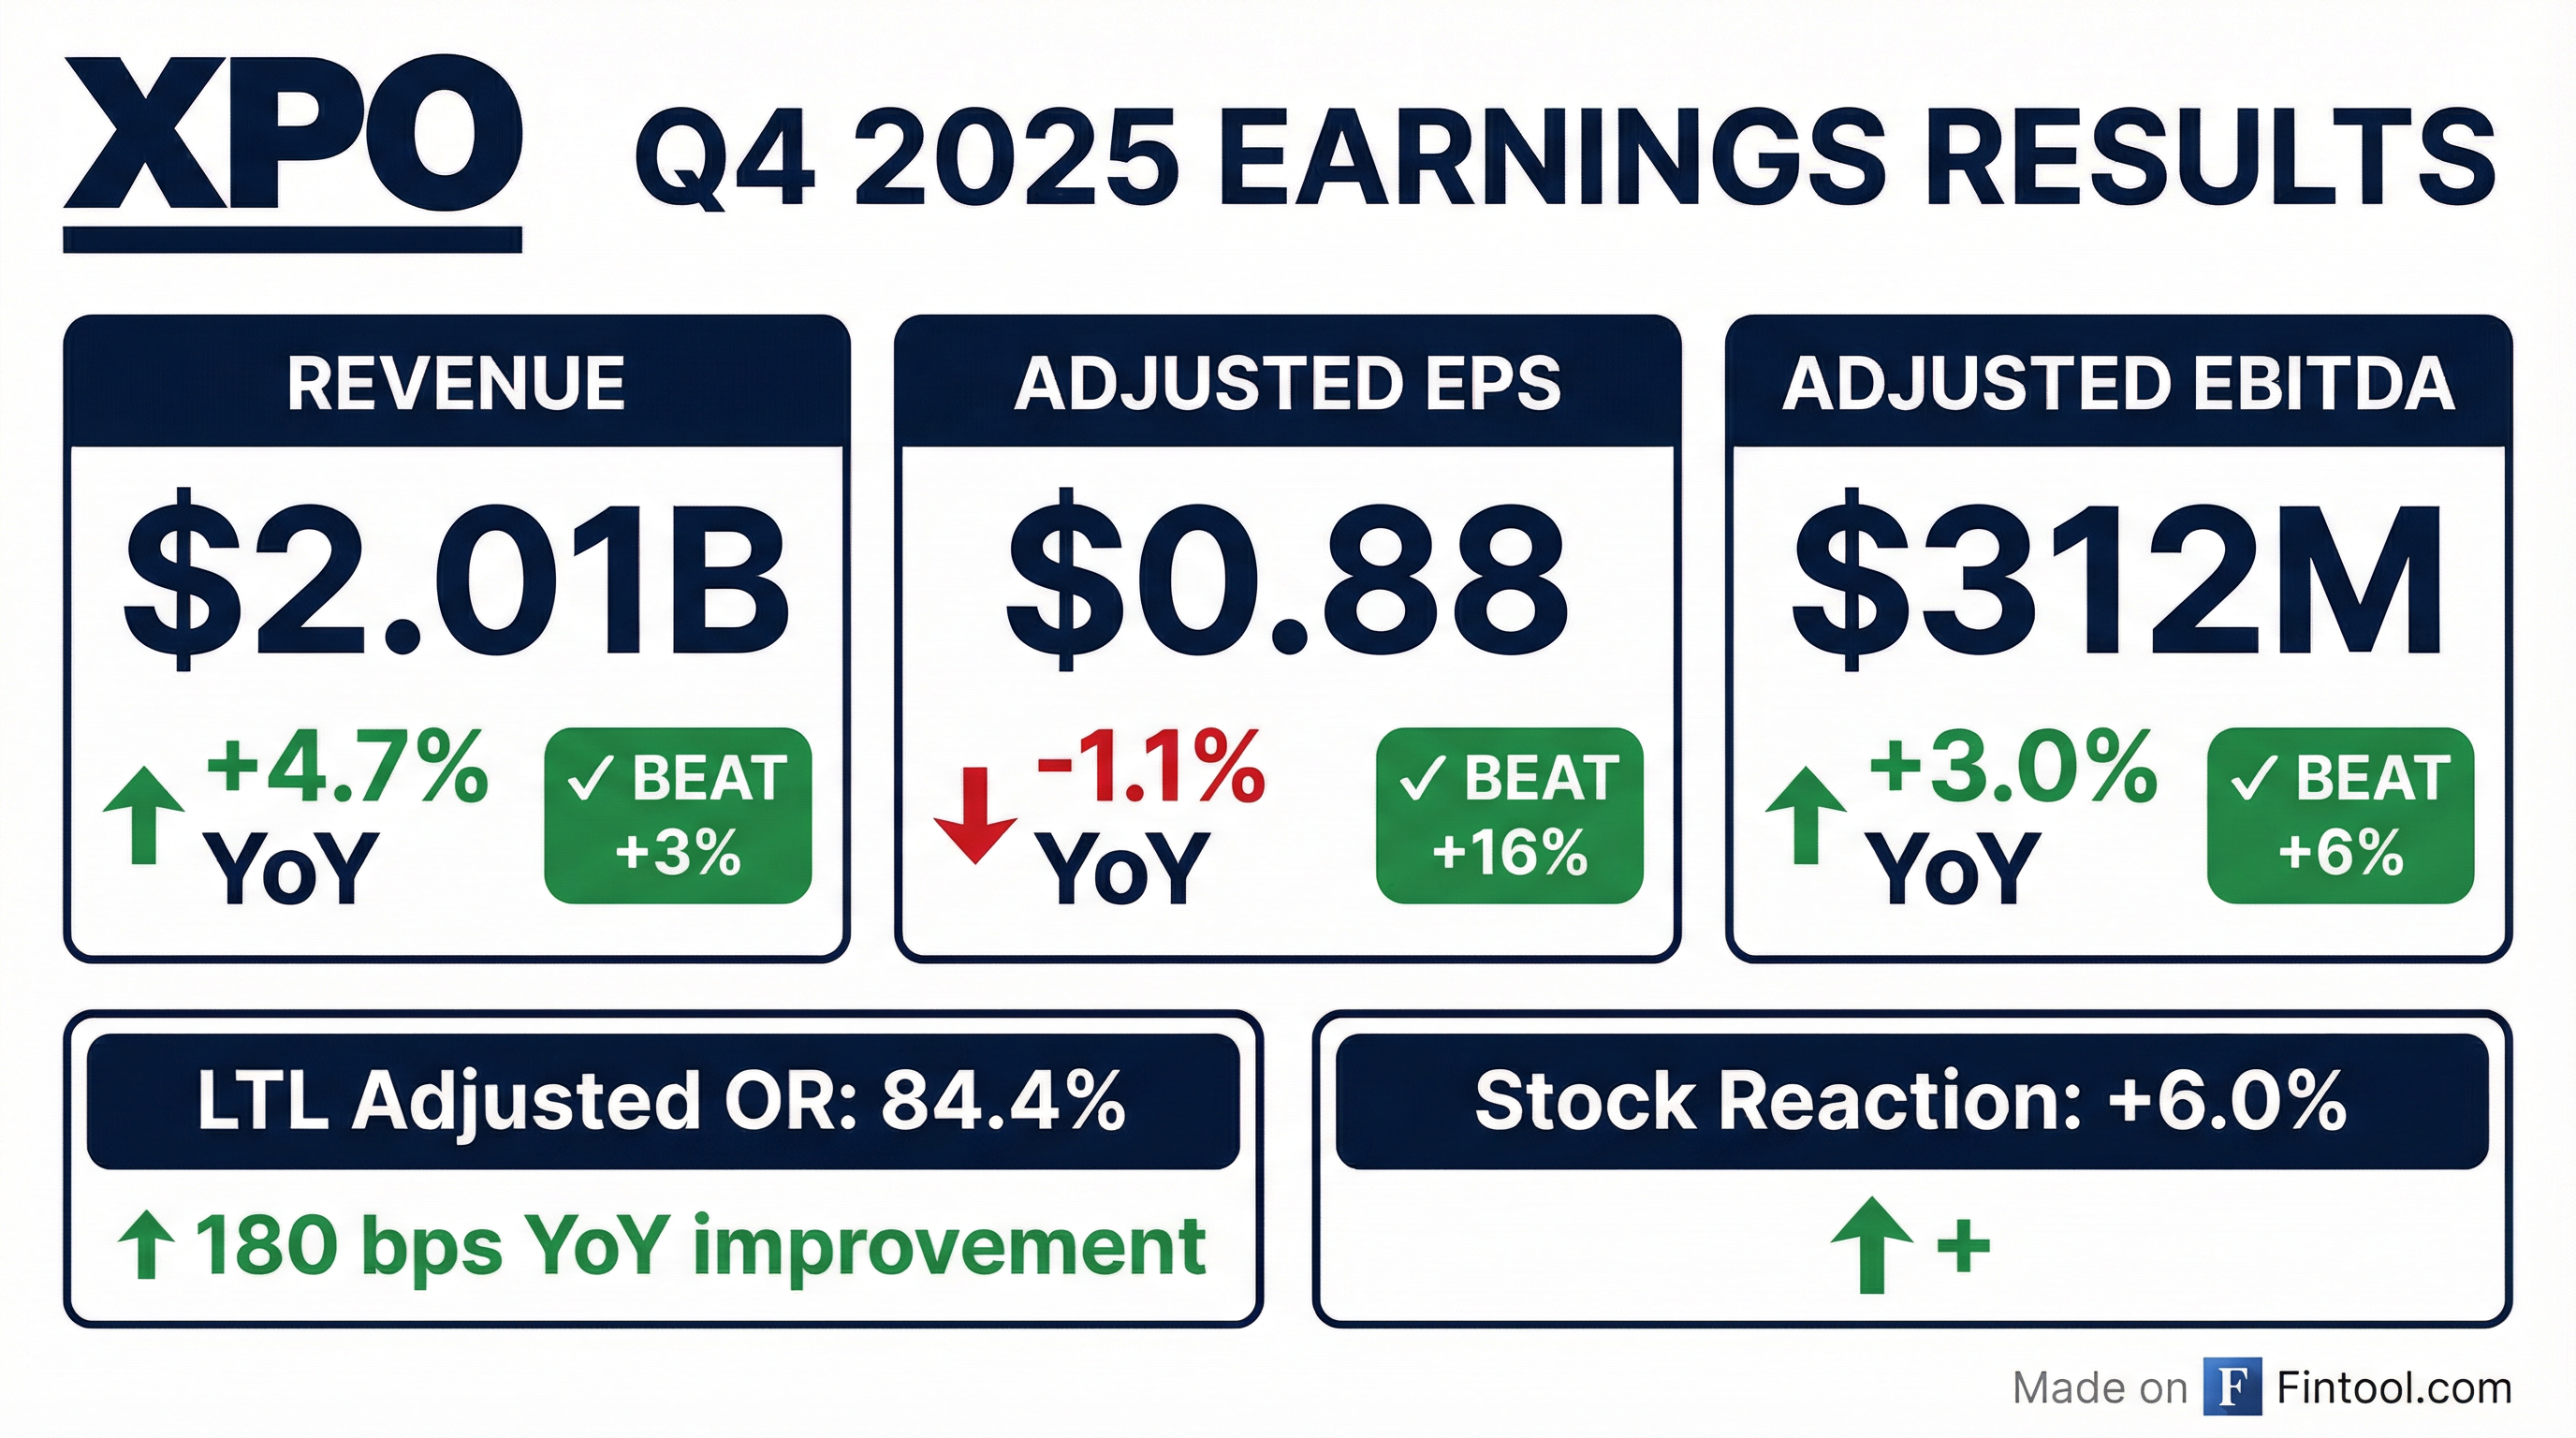
XPO delivered a strong Q4 2025, beating consensus on all key metrics despite volume headwinds in its core LTL business. The company reported adjusted EPS of $0.88, exceeding expectations by 16%, while revenue of $2.01 billion beat by 3% . The standout was continued margin expansion in North American LTL, where the adjusted operating ratio improved 180 basis points to 84.4% . Shares jumped 6% on the news.
Did XPO Beat Earnings?
XPO beat across all three headline metrics:
Consensus estimates from S&P Global
This marks XPO's eighth consecutive quarter of beating EPS estimates. The company has consistently outperformed on profitability metrics even as LTL volumes have been under pressure.
GAAP diluted EPS was $0.50, down 21% year-over-year, primarily due to lower real estate gains ($13M pre-tax vs $34M in Q4 2024) and $33M in restructuring costs related to the board leadership transition .
How Did XPO's Segments Perform?
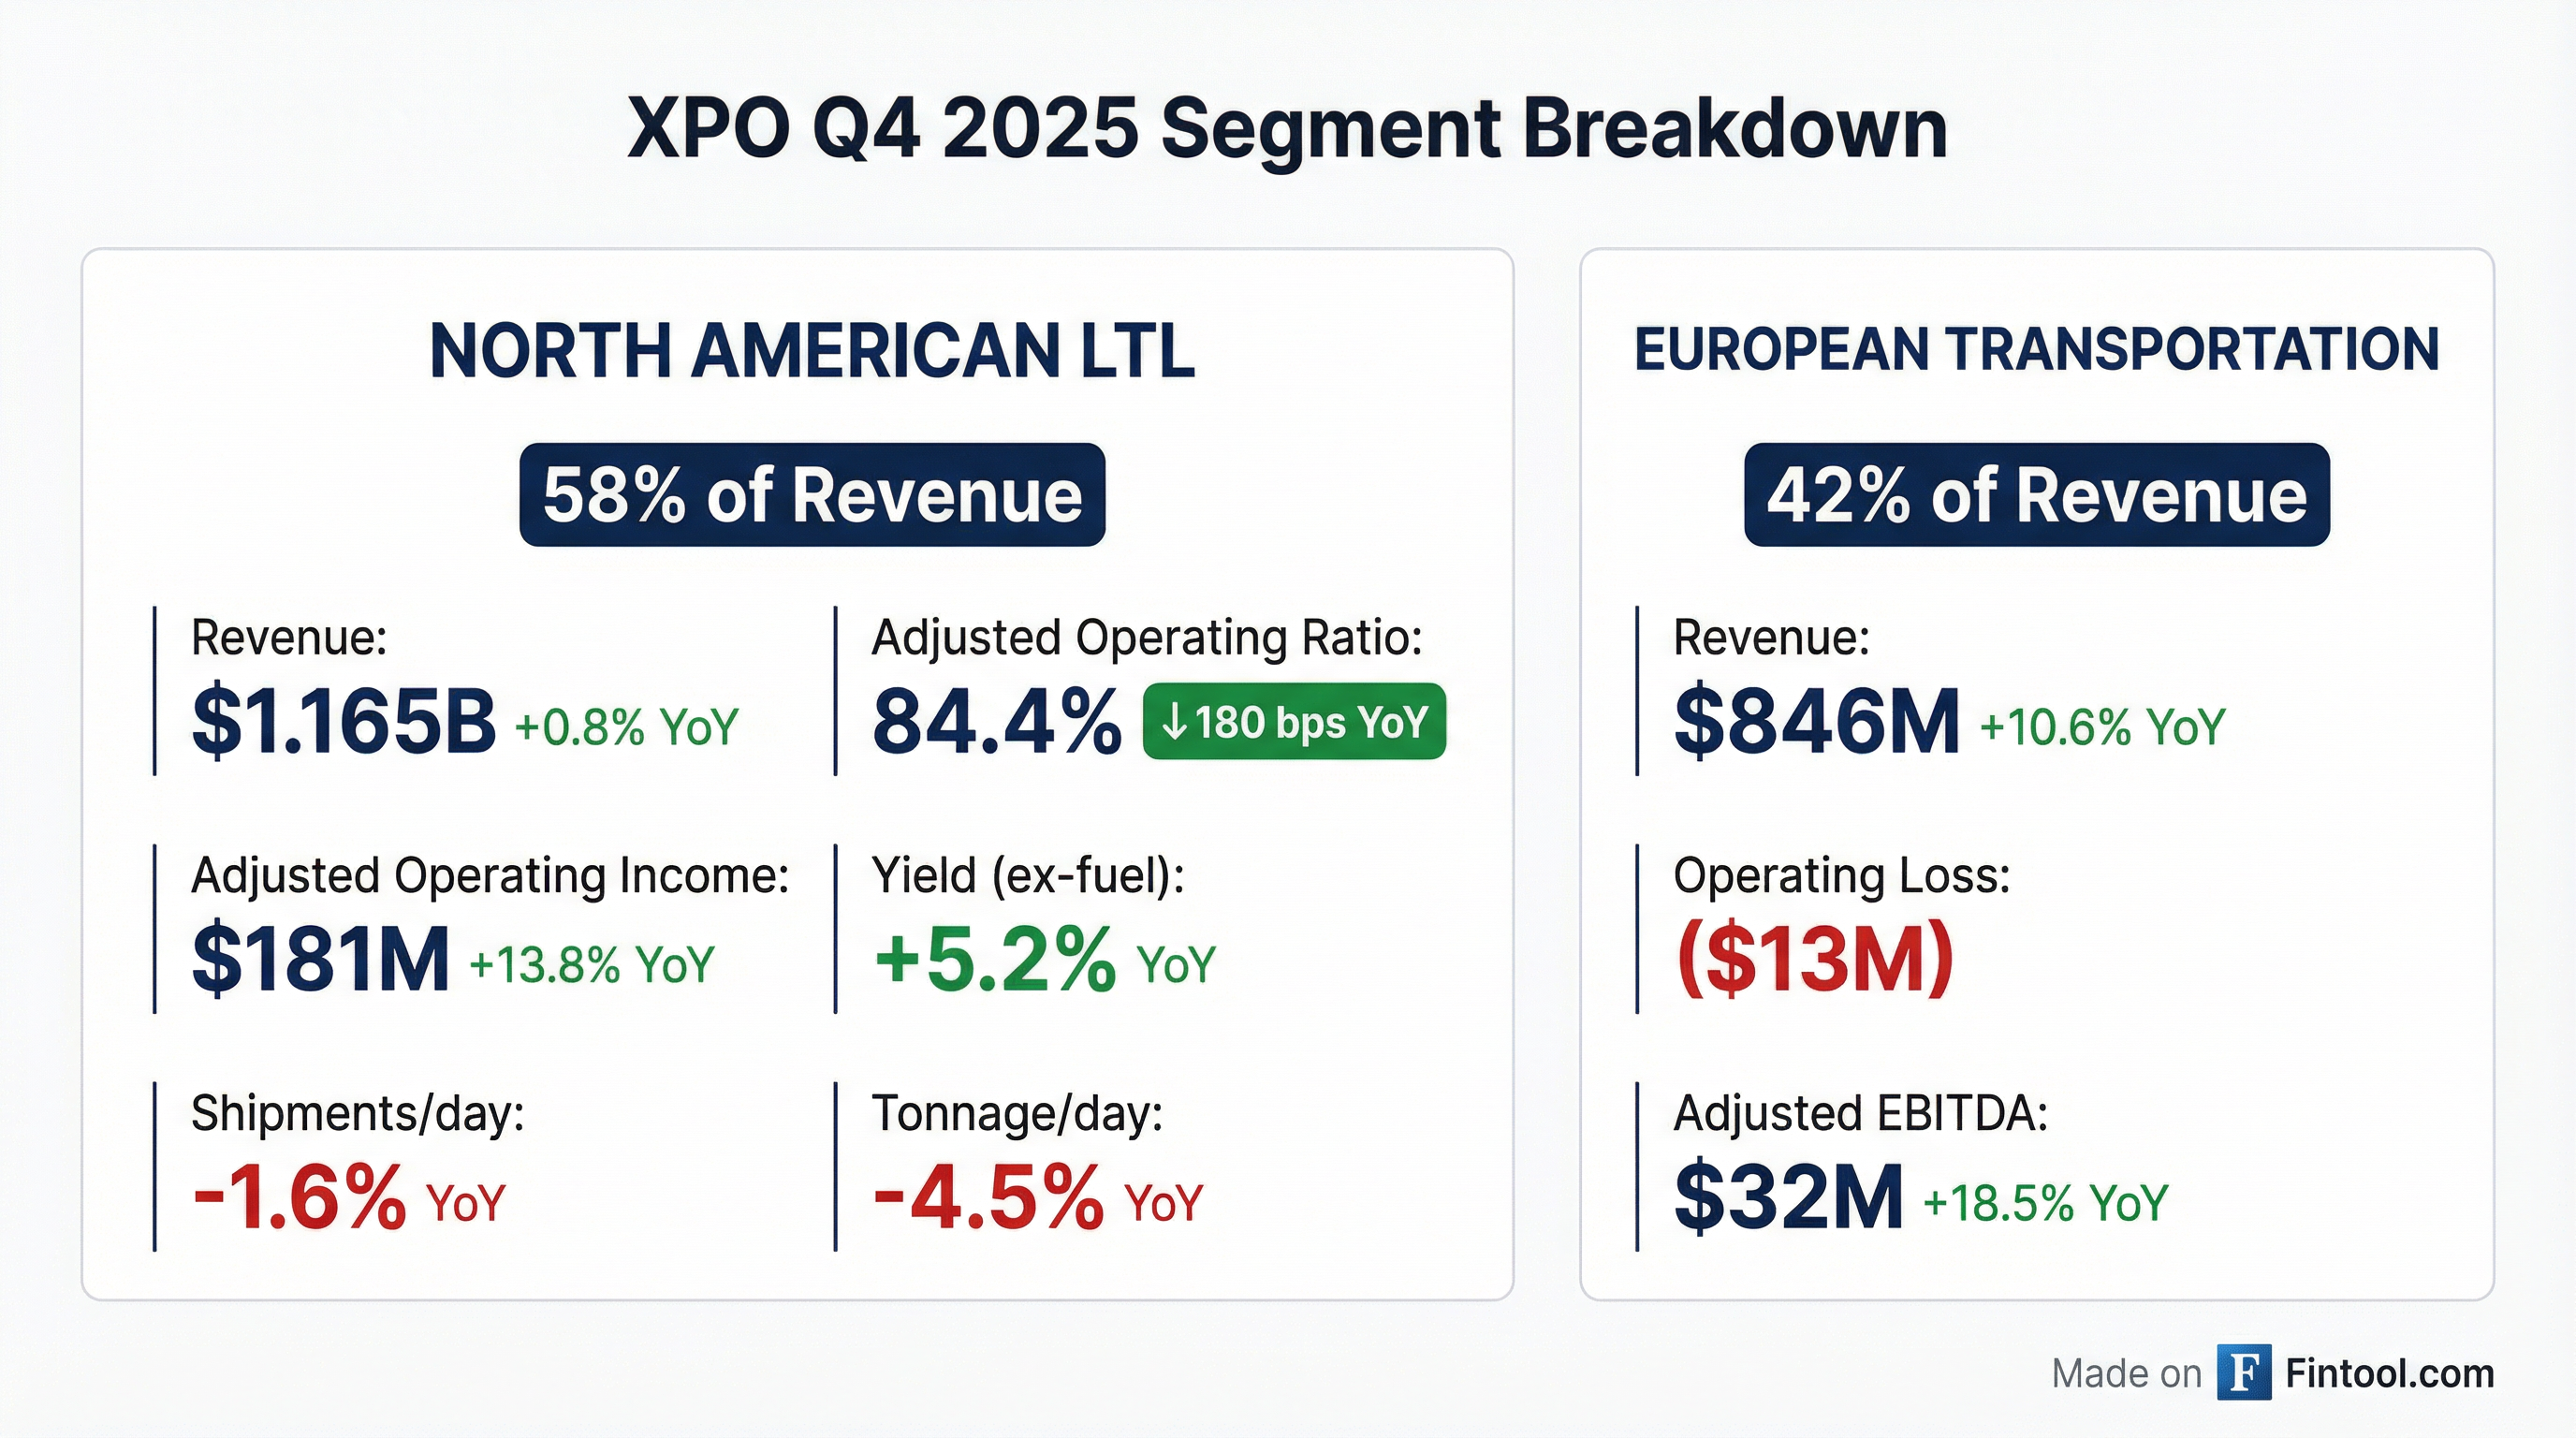
North American LTL (58% of Revenue)
The core LTL business drove the earnings beat through continued margin expansion and yield discipline:
The story in LTL remains consistent: XPO is prioritizing pricing over volume. Revenue per shipment (excluding fuel) increased 3.0% year-over-year to $335.28, marking the twelfth consecutive quarter of sequential growth in yield .
CEO Mario Harik attributed margin expansion to "service excellence and continuous improvement," noting that AI developments are lowering cost to serve through better network efficiency and labor productivity .
European Transportation (42% of Revenue)
Europe showed strong revenue growth but remains a drag on profitability:
The segment posted an operating loss due to continued restructuring charges ($11M in severance costs). However, underlying adjusted EBITDA improved 18.5%, suggesting operational progress beneath the noise.
XPO maintains strong market positions across European geographies :
- France: #1 full truckload (FTL) broker and #1 pallet network (LTL) provider
- Iberia (Spain & Portugal): #1 FTL broker and #1 LTL provider
- UK: Market leader in warehousing, top-tier dedicated truckload, largest single-owner LTL network
The Margin Expansion Playbook
XPO's 180 bps year-over-year operating ratio improvement is part of a multi-year transformation. The company has improved its LTL adjusted operating ratio by 590 basis points over three years (Q4 2022: 90.3% → Q4 2025: 84.4%) .
Linehaul Insourcing: The Hidden Margin Driver
One of the most significant drivers of margin expansion has been XPO's systematic insourcing of linehaul miles:
XPO exited 2025 with the lowest level of outsourced miles in company history at 5.1% . This insourcing improves margins by reducing reliance on higher-cost third-party carriers and positions XPO for even higher incremental margins in a freight recovery. As truckload rates eventually recover 20-30%, XPO's low purchased transportation exposure provides meaningful P&L insulation .
Service Quality: The Foundation for Yield
XPO's ability to command premium pricing stems from sustained service improvements:
Damage frequency has improved by more than 85% since Q4 2021, while on-time performance has improved year-over-year for 15 consecutive quarters. These service gains justify XPO's pricing power—gross revenue per hundredweight (ex-fuel) has grown from $18.63 in 2020 to $25.39 in 2025, a 36% increase .
What Did Management Say?
CEO Mario Harik struck an optimistic tone on the call, emphasizing the durability of XPO's earnings power:
"We've entered 2026 from a position of strength, following a year of significant progress in our performance... We have multiple drivers to improve our LTL operating ratio well into the 70s in the years to come."
Key commentary themes:
-
AI-Driven Productivity: XPO completed a successful pilot of AI-driven route optimization for pickup and delivery, and is expanding this technology to nearly half of service centers this quarter. This targets a $900M cost category, with each 1 point of P&D efficiency improvement worth $9M annually
-
Yield Discipline: The twelfth consecutive quarter of sequential yield growth (ex-fuel) signals continued pricing power despite soft volumes. Management expects mid-single-digit revenue per shipment growth in 2026
-
Free Cash Flow Acceleration: Management expects free cash flow to be up more than 50% year-over-year in 2026, driven by lower CapEx and continued income growth. This will fund accelerated share repurchases and debt paydown
-
Long-Term Margin Ambition: Harik stated the company aims to get its operating ratio "well into the 70s and eventually at some point in the 60s"
Q&A Highlights: Growth Initiatives
The Q&A session revealed important details on XPO's mix-shift strategy:
Local Accounts: Halfway to Target
XPO added approximately 10,000 new local (small/medium-sized) customers in 2025. These accounts carry higher margins because they lack the density and negotiating leverage of national accounts.
Premium Services: Room to Expand
Grocery Consolidation: New Vertical Taking Off
XPO is ramping into grocery consolidation—a high-margin vertical where the company consolidates freight from smaller suppliers at destination terminals before delivering to grocers:
- Addressable market: ~$1 billion
- Current share: Low single-digit %
- Progress: "Nearly tripled shipments" in H2 2025
- Status: Achieved preferred carrier status with multiple large grocers
- Pipeline: ~200 incremental customers targeted
Industry Capacity: Positioned for Recovery
Harik provided context on LTL industry capacity constraints that should support pricing in a recovery:
"If you compare pre-COVID, so 2019, to where we are today on overall service center count, the industry is down 11 points over that period. And on door count, it's down 6 points."
XPO has 30%+ excess door capacity, positioning the company to absorb 15-20%+ incremental tonnage without adding real estate .
How Did the Stock React?
XPO shares rose 6.0% on earnings day to $179.83, hitting a new 52-week high. The stock has been on a tear heading into earnings, rallying over 20% in the week prior as investors anticipated strong results.
The positive reaction reflects investor confidence in XPO's margin expansion story. The company has now delivered eight consecutive quarters of EPS beats, and the stock has roughly doubled from its 52-week low.
What Changed From Last Quarter?
Comparing Q4 2025 to Q3 2025:
The sequential decline in revenue and EBITDA is typical seasonality (Q4 is generally softer than Q3 in LTL). Management noted the company "outperformed seasonality" on operating ratio, meaning the 40 bps sequential deterioration was better than historical patterns .
Capital Allocation Update
XPO deployed capital across multiple priorities in Q4:
For the full year 2025, operating cash flow totaled $986M, up from $808M in 2024 . The company repurchased $125M of stock and paid down $115M in debt during 2025.
What Are the Risks?
Several concerns emerged from the quarter:
-
Volume Weakness: LTL shipments declined 1.6% and tonnage declined 4.5% year-over-year . While pricing is offsetting volume, a deeper freight recession could pressure margins.
-
European Drag: The European segment continues to post operating losses and absorb restructuring charges. Profitability progress has been slow.
-
Restructuring Noise: The $33M in restructuring costs (including $21M related to board leadership transition) obscured underlying results .
-
Insurance Costs: Insurance and claims expense spiked 66% year-over-year to $48M in Q4, a potential headwind to watch .
What Did Management Guide?
2026 Operating Ratio Outlook
Management provided explicit guidance on margin improvement for 2026:
"For the full year, we'd expect our OR to be in the 100-150 basis points of improvement for the full year, which would be an acceleration relative to what we saw last year. That's without a meaningful macro recovery."
If macro conditions improve (ISM sustaining above 50), management sees meaningful upside to these targets.
Q1 2026: OR Expected to Improve Sequentially
Notably, management expects Q1 2026 operating ratio to improve sequentially from Q4—a departure from typical seasonality, which normally sees OR deteriorate by ~50 bps from Q4 to Q1 .
This confidence is supported by January trends:
- Tonnage: Roughly flat YoY (despite a 3-point headwind from the late-January winter storm)
- Shipments: Up ~1% YoY
- Sequential performance: ~2 points better than normal seasonality from December to January
2026 Planning Assumptions
XPO provided key planning assumptions for fiscal 2026 :
CFO Kyle Wismans noted that CapEx will moderate from 2025 (12.4% of LTL revenue) as the company laps significant network expansion and fleet additions .
Long-Term LTL Targets
Management reiterated ambitious long-term targets:
Key levers for margin expansion :
- Pricing: ~1 point/year from service quality + mix
- Accessorials: Growing from 12% to 15% of revenue (~1 pt/year)
- Local customers: Growing from 25% to 30% of book (~0.5 pt/year yield benefit)
- AI productivity: 1.5 pts/year (potentially higher)
- Volume leverage: 30%+ excess door capacity ready for recovery
Key catalysts to monitor:
- Freight Market Recovery: ISM new orders at 57 in January—if sustained, meaningful upside to OR guidance
- AI Implementation: P&D optimization to ~50% of network this quarter; dock and linehaul AI ongoing
- Grocery Consolidation: $1B TAM with ~200 customers in pipeline
Key Takeaways
- Triple Beat: XPO beat on revenue (+3%), adjusted EPS (+16%), and adjusted EBITDA (+6%)
- Margin Expansion: LTL operating ratio improved 180 bps YoY to 84.4%, and 590 bps over three years
- 2026 OR Guidance: Management expects 100-150 bps OR improvement (acceleration), with FCF up 50%+
- Linehaul Insourcing: Outsourced miles at record-low 5.1% (from 25.2% in 2020), a key margin driver
- Yield Power: Twelfth consecutive quarter of sequential yield growth; expect mid-single-digit growth in 2026
- Mix Shift Progress: Local accounts at 25% (targeting 30%), premium services at 12% (targeting 15%+)
- AI Rollout: P&D route optimization expanding to ~50% of network this quarter
- Long-Term Ambition: OR targeted "well into the 70s and eventually in the 60s"
- Stock Reaction: Shares up 6% to new 52-week highs
Data sourced from XPO 8-K and Q4 2025 earnings call transcript filed February 5, 2026. Consensus estimates from S&P Global.