Acadian Asset Management (AAMI)·Q4 2025 Earnings Summary
Acadian Posts Record AUM and ENI EPS, But Stock Drops 8% on Fee Mix Concerns
February 5, 2026 · by Fintool AI Agent
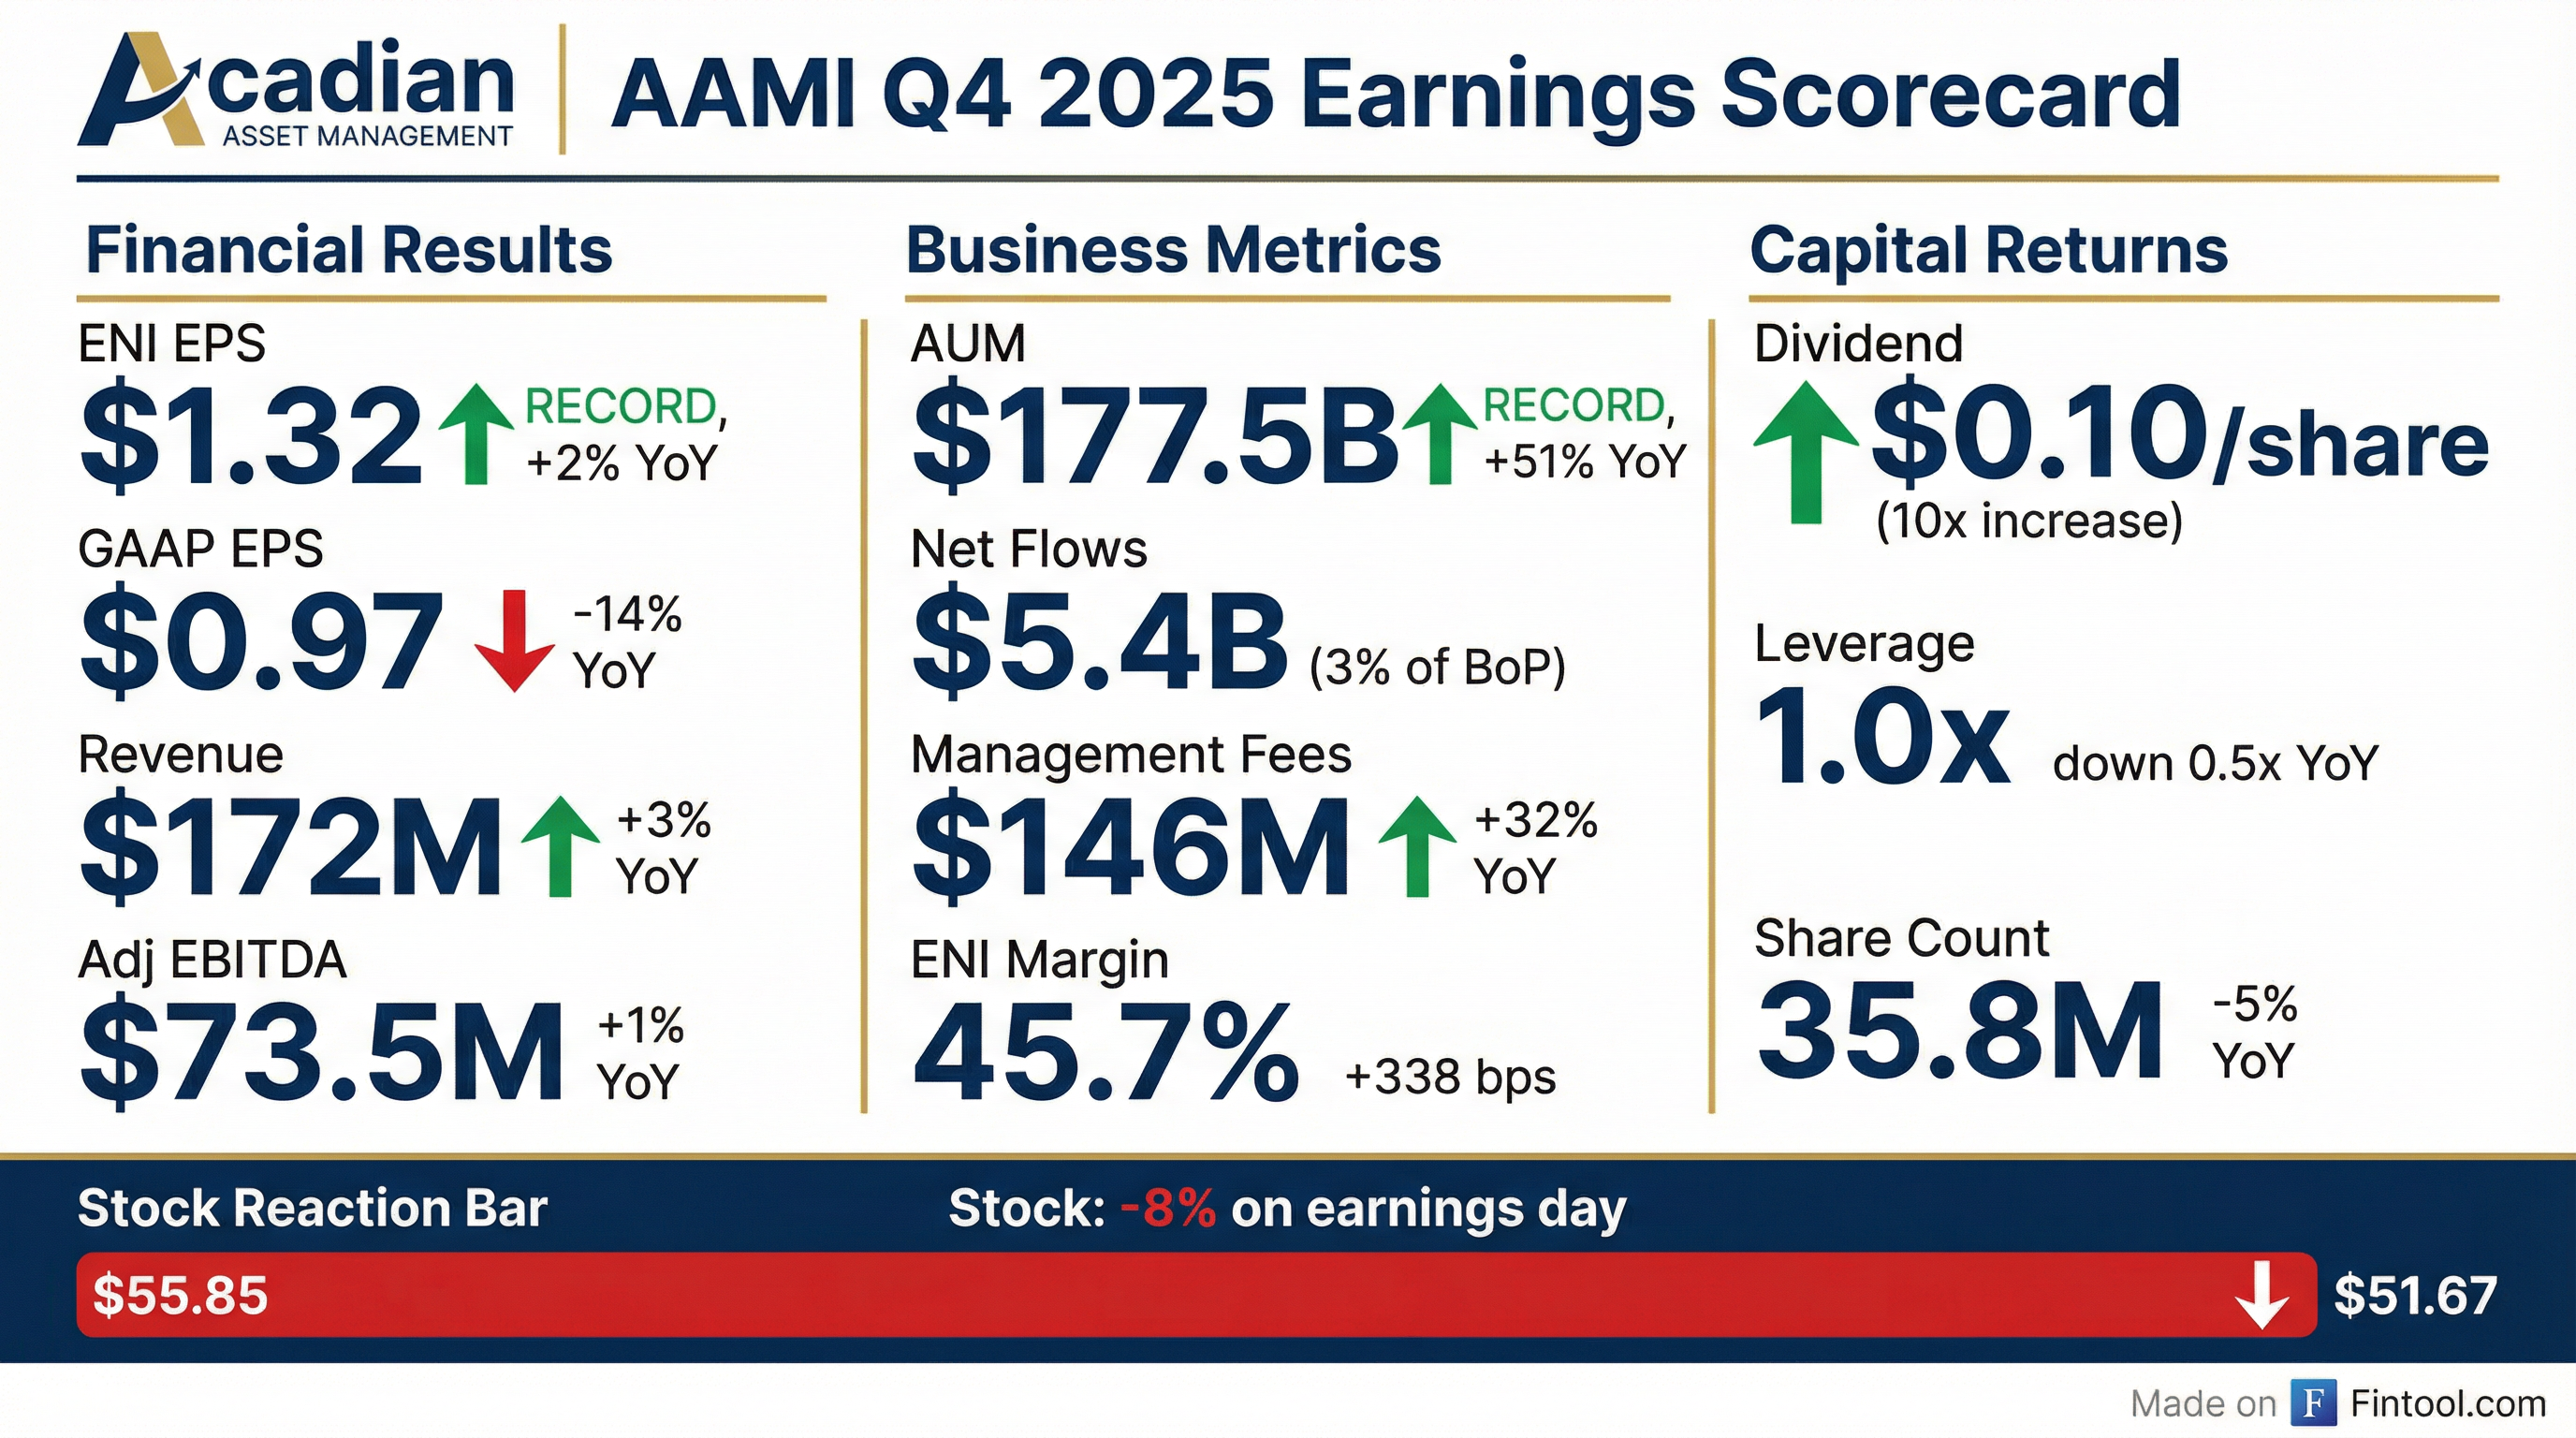
Acadian Asset Management delivered a quarter of contradictions: record assets under management ($177.5B), record economic net income EPS ($1.32), and the highest annual net flows in firm history ($29.4B) — yet shares tumbled 8% as investors focused on a 58% collapse in performance fees and concerning forward guidance on variable compensation ratios.
The pure-play systematic quant manager hit all-time highs across nearly every fundamental metric, but the market punished a GAAP EPS decline of 14% and signaled skepticism about the sustainability of fee rates as the asset mix shifts.
Did Acadian Beat Earnings?
The short answer: Yes on ENI, mixed on GAAP. The company uses Economic Net Income (ENI) as its primary performance measure, stripping out non-cash compensation expenses.
The GAAP vs ENI divergence reflects non-cash expenses from changes in the value of Acadian LLC equity and profit interests held by key employees — a $12.0M charge in Q4 2025 vs $3.6M a year ago.
How Did the Stock React?
Down 8% on earnings day — one of the worst reactions in recent quarters despite record fundamentals.
The pattern shows investors have become increasingly skeptical in recent quarters. Q4 2025's 8% drop came despite:
- Record-high AUM (+51% YoY)
- Record-high ENI EPS
- 10x dividend increase
- Balance sheet deleveraging to 1.0x
What spooked the market?
- Performance fees collapsed 58% — down to $23.3M from $55.4M, signaling potential alpha decay or benchmark underperformance in key strategies
- 1-year investment performance dropped — only 57% of assets beating benchmarks on 1-year basis vs 91% a year ago
- Higher variable compensation guidance — 2026 VC ratio expected at 40-43% vs 39.4% in 2025
What Changed From Last Quarter?
Revenue Mix Shifted Dramatically
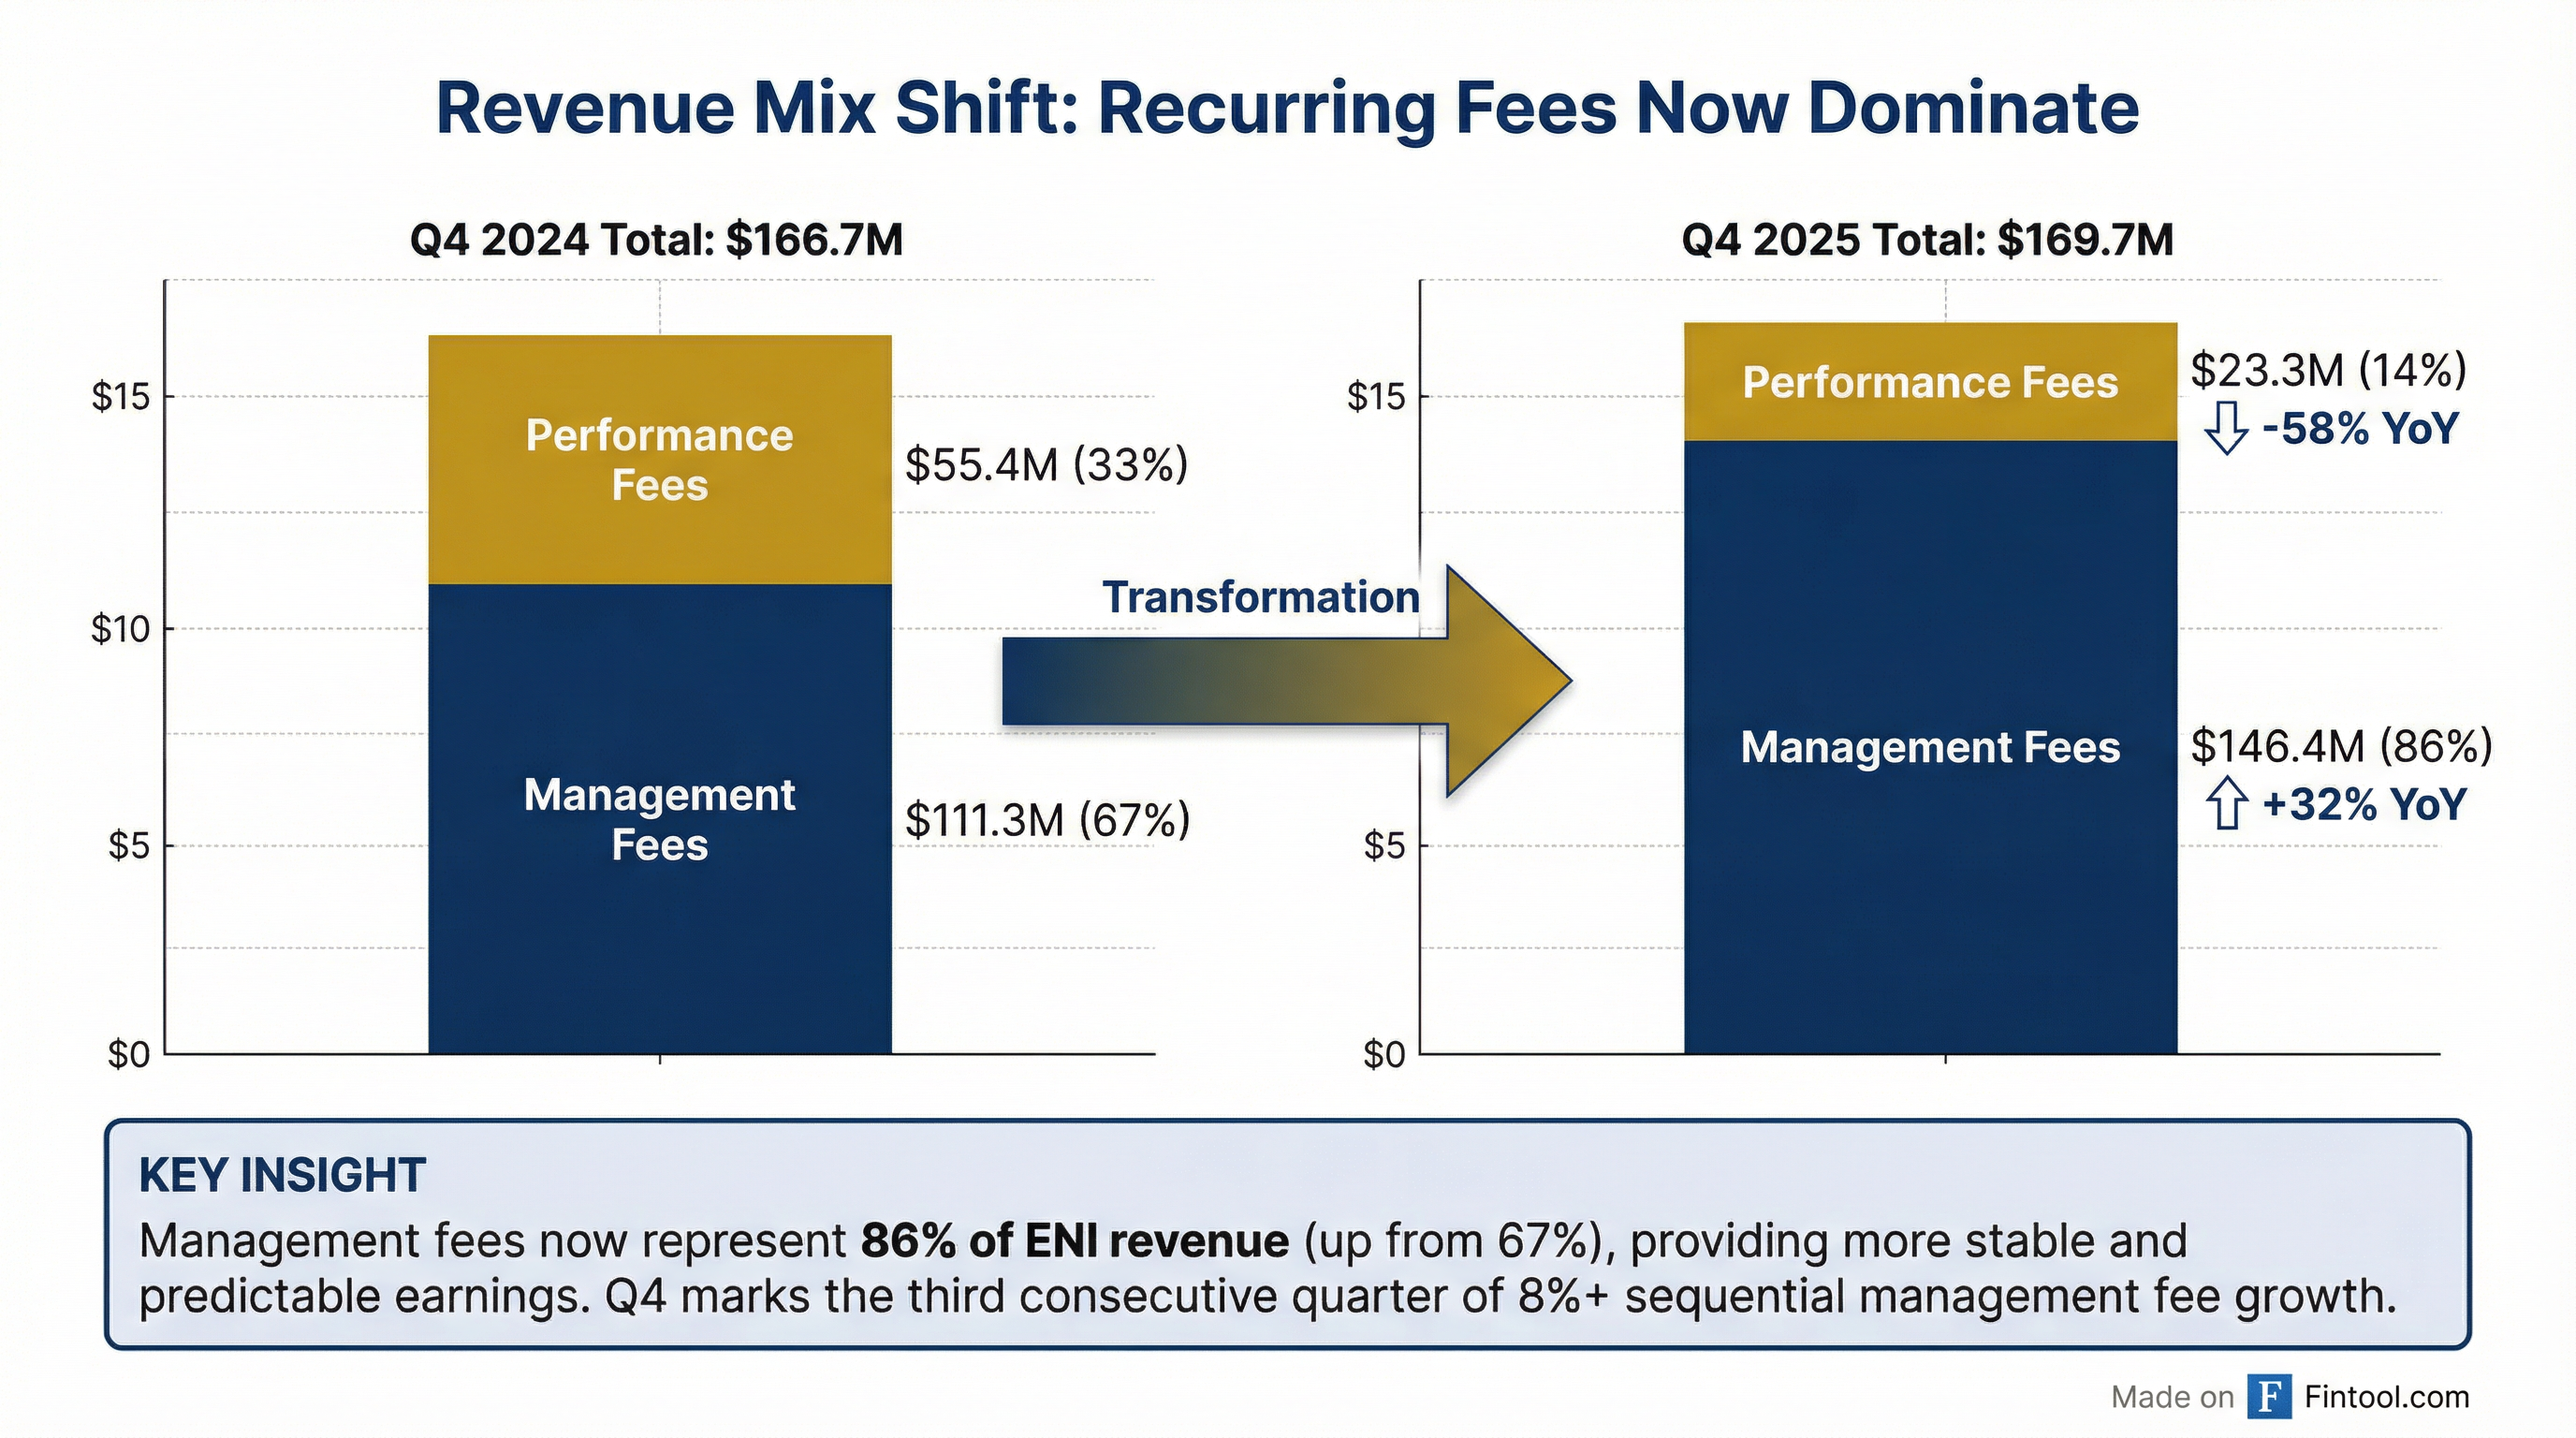
Management fees now represent 86% of ENI revenue (up from 67% a year ago), providing more predictable earnings but at potentially lower margins than performance-fee-driven income.
This is the third consecutive quarter of 8%+ sequential management fee growth, driven by AUM expansion.
AUM Reached All-Time High
Key concern: Average management fee rate declined 320 bps YoY as asset mix shifted toward lower-fee strategies like Enhanced and Extension products.
Operating Margin Expanded Despite Fee Compression
Operating leverage improved significantly as fixed costs grew slower than revenue.
What Did Management Say?
CEO Kelly Young and CFO Scott Hynes provided key color on the earnings call:
On the Pipeline:
"The pipeline remains very strong... very diverse by product type, by geographies, and by vehicle. We continue to see a lot of interest in enhanced [strategies]. On the other end of the risk spectrum, our extension strategies, we've seen real interest there... And then a real resurgence of interest in some of our core strategies, like areas like EM."
On Capital Returns:
"That pause in repurchasing is over... With more than $100 million on balance sheet, let's put it this way, it wouldn't be our intention to just sit on that. We're going to be athletic. We're going to be active." — CFO Scott Hynes
On Investment Performance:
"Crowding in lesser quality, high beta stocks created a more challenging environment for the fundamentally driven signals, such as quality, that drive Acadian's approach... Toward the end of the year, value and quality-oriented stocks performed better, a welcome change."
On Long-Term Balance Sheet:
"Over time, and this is over the long term, I do think it is our intention to march nearer toward a net cash position versus a net debt position." — CFO Scott Hynes
Q&A Highlights
On Pipeline Composition (John Dunn, Evercore):
Management emphasized the pipeline has refilled remarkably well even after digesting large 2025 wins. Key drivers:
- Enhanced Equity — clients seeking lower risk, consistent returns at lower fees
- Extension Strategies — strong interest from North America and increasingly globally
- Emerging Markets — resurgence driven by diversification demand and dollar weakening
On Share Repurchases (Kenneth Lee, RBC):
CFO clarified the Q4 buyback pause was specifically for the refinancing, which is now complete. The 10x dividend increase is not an either/or trade-off with repurchases — it reflects confidence in durable free cash flow. No specific payout ratio target, but buybacks are a priority for 2026.
On Investment Areas:
Ongoing investments in:
- Systematic Credit — dedicated salespeople for the initiative
- Technology/Data — including AI investments to improve research team efficiency
- No "step change" in expense levels expected — organic self-funding
On Flow Composition (Kenneth Lee, RBC):
Q4 flows were "exactly what we really want to see" — diverse with no single dominant mandate. Balanced between international and U.S. clients, across enhanced, extensions, and EM strategies, spanning separate accounts and pooled vehicles.
What Did Management Guide?
Dividend Raised 10x
The board declared a quarterly dividend of $0.10 per share, up from the prior $0.01 level — a 10x increase reflecting confidence in cash generation and the strengthened balance sheet.
Balance Sheet Deleveraged
Acadian refinanced its senior notes and Term Loan A, reducing debt by $74M and improving flexibility for future capital returns.
Forward Compensation Guidance Disappointed
Management guided 2026 variable compensation ratio of 40-43%, up from 39.4% in 2025 and 42.3% in 2024.
Additionally, the Acadian LLC key employee distribution ratio is expected to rise to 12-14% in 2026, up from 11.0% in 2025.
These higher ratios reduce the share of profits flowing to public shareholders.
Investment Performance: A Warning Sign?
While long-term track records remain stellar (95%+ of revenue from strategies outperforming over 3/5/10 years), near-term performance has weakened:
The sharp decline in 1-year outperformance (from 91% to 57%) explains the collapse in performance fees and raises questions about alpha generation in the current market environment.
Key Highlights from Q4 2025
Record Business Metrics
- $177.5B AUM — all-time high, 40-year firm history
- $29.4B annual net flows — highest ever, 25% organic growth
- $1.32 ENI EPS — record quarterly earnings
- 8 consecutive quarters of positive net flows
Capital Return Story Improving
- 10x dividend increase to $0.10/share
- $1.4B returned to shareholders since 2019 via buybacks and dividends
- 58% share count reduction since Q4 2019 (86M → 35.8M)
Product Momentum
- Enhanced Equity and Extension strategies driving flows
- Emerging Markets Equity strategies contributing
- 100% of major strategy groups outperforming over 3/5/10 years
Forward Catalysts
Positive:
- Continued AUM growth driving management fee expansion
- Share buybacks to resume as deleveraging completes
- 100+ fund platform providing distribution leverage
Risks:
- 1-year performance deterioration could accelerate redemptions
- Fee rate compression as mix shifts to lower-fee products
- Rising compensation ratios squeezing profit margins
- Market volatility could reverse AUM gains
The Bottom Line
Acadian delivered record fundamentals across nearly every operating metric — AUM, net flows, management fees, ENI EPS, and operating margin. Yet the stock dropped 8% as investors focused on:
- 58% performance fee collapse signaling near-term alpha challenges
- 1-year investment performance falling from 91% to 57% outperformance
- Fee rate compression (34.3 bps vs 37.5 bps) as mix shifts to lower-fee strategies
- Higher 2026 compensation guidance reducing profit sharing to shareholders
The 10x dividend increase and balance sheet deleveraging are positives, but the market is clearly questioning whether the growth story is sustainable as the firm's fee rates compress and near-term investment performance lags.
At current prices (~$52), AAMI trades at roughly 16x trailing ENI EPS — a discount to the asset management peer group, potentially reflecting these concerns about fee sustainability and alpha generation.
Management's Final Word:
"We were delighted by the 25% increase in net client cash flow in the period, the 52% increase in AUM, and the 32% growth in management fees. We remain incredibly confident for the trajectory for Acadian in 2026, as we continue strong growth ahead." — CEO Kelly Young
Data sourced from Acadian Asset Management Q4 2025 Earnings Presentation and Earnings Call Transcript, filed February 5, 2026.