Adaptive Biotechnologies (ADPT)·Q4 2025 Earnings Summary
Adaptive Biotechnologies Crushes Q4 as MRD Business Turns Profitable
February 5, 2026 · by Fintool AI Agent
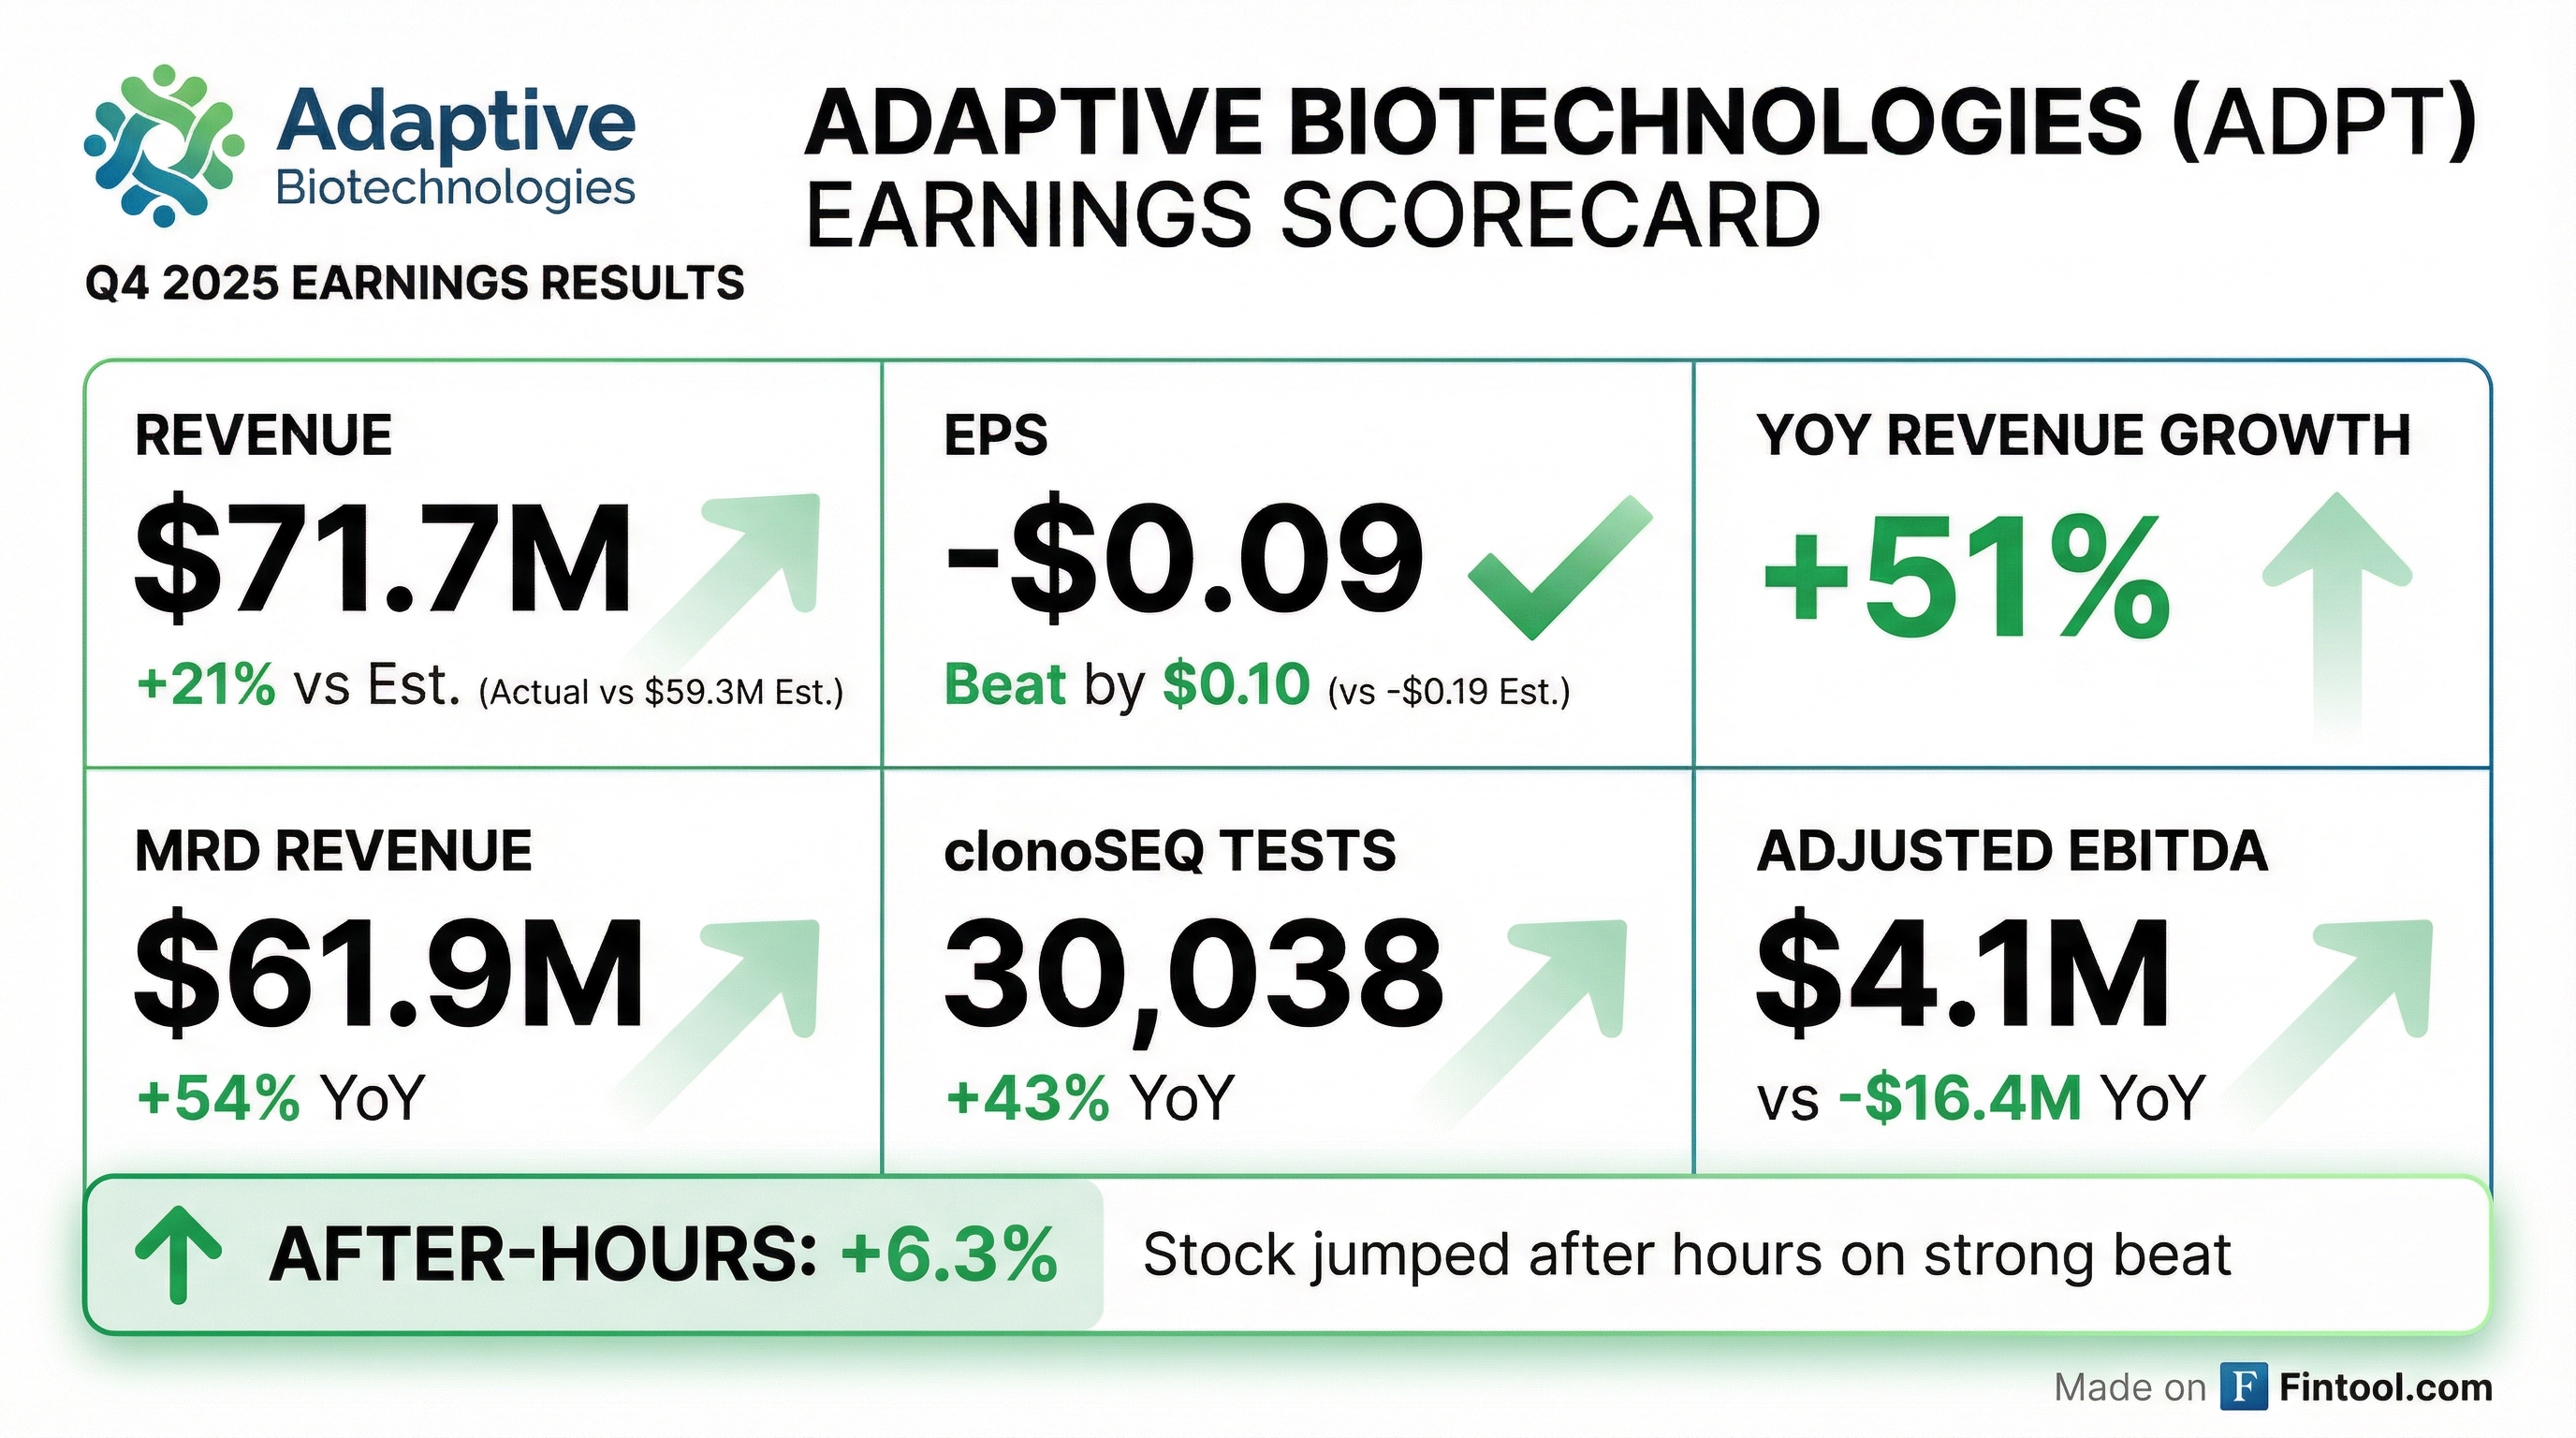
Adaptive Biotechnologies (NASDAQ: ADPT) delivered a standout Q4 2025, handily beating analyst expectations on both revenue and earnings while achieving a landmark milestone: profitability in its core MRD (Minimal Residual Disease) business. Revenue of $71.7M came in 21% above consensus, and EPS of -$0.09 crushed the -$0.19 estimate by more than 50%.
The stock, which closed the regular session down 4.8% at $16.47, reversed sharply after hours to trade at $17.51—a 6.3% gain from the close—as investors digested the MRD profitability milestone and strong guidance.
Did Adaptive Biotechnologies Beat Earnings?
Adaptive beat across the board in Q4 2025:
This marks Adaptive's fifth consecutive quarter of beating EPS estimates. The company has built a strong track record:
What Did Management Guide?
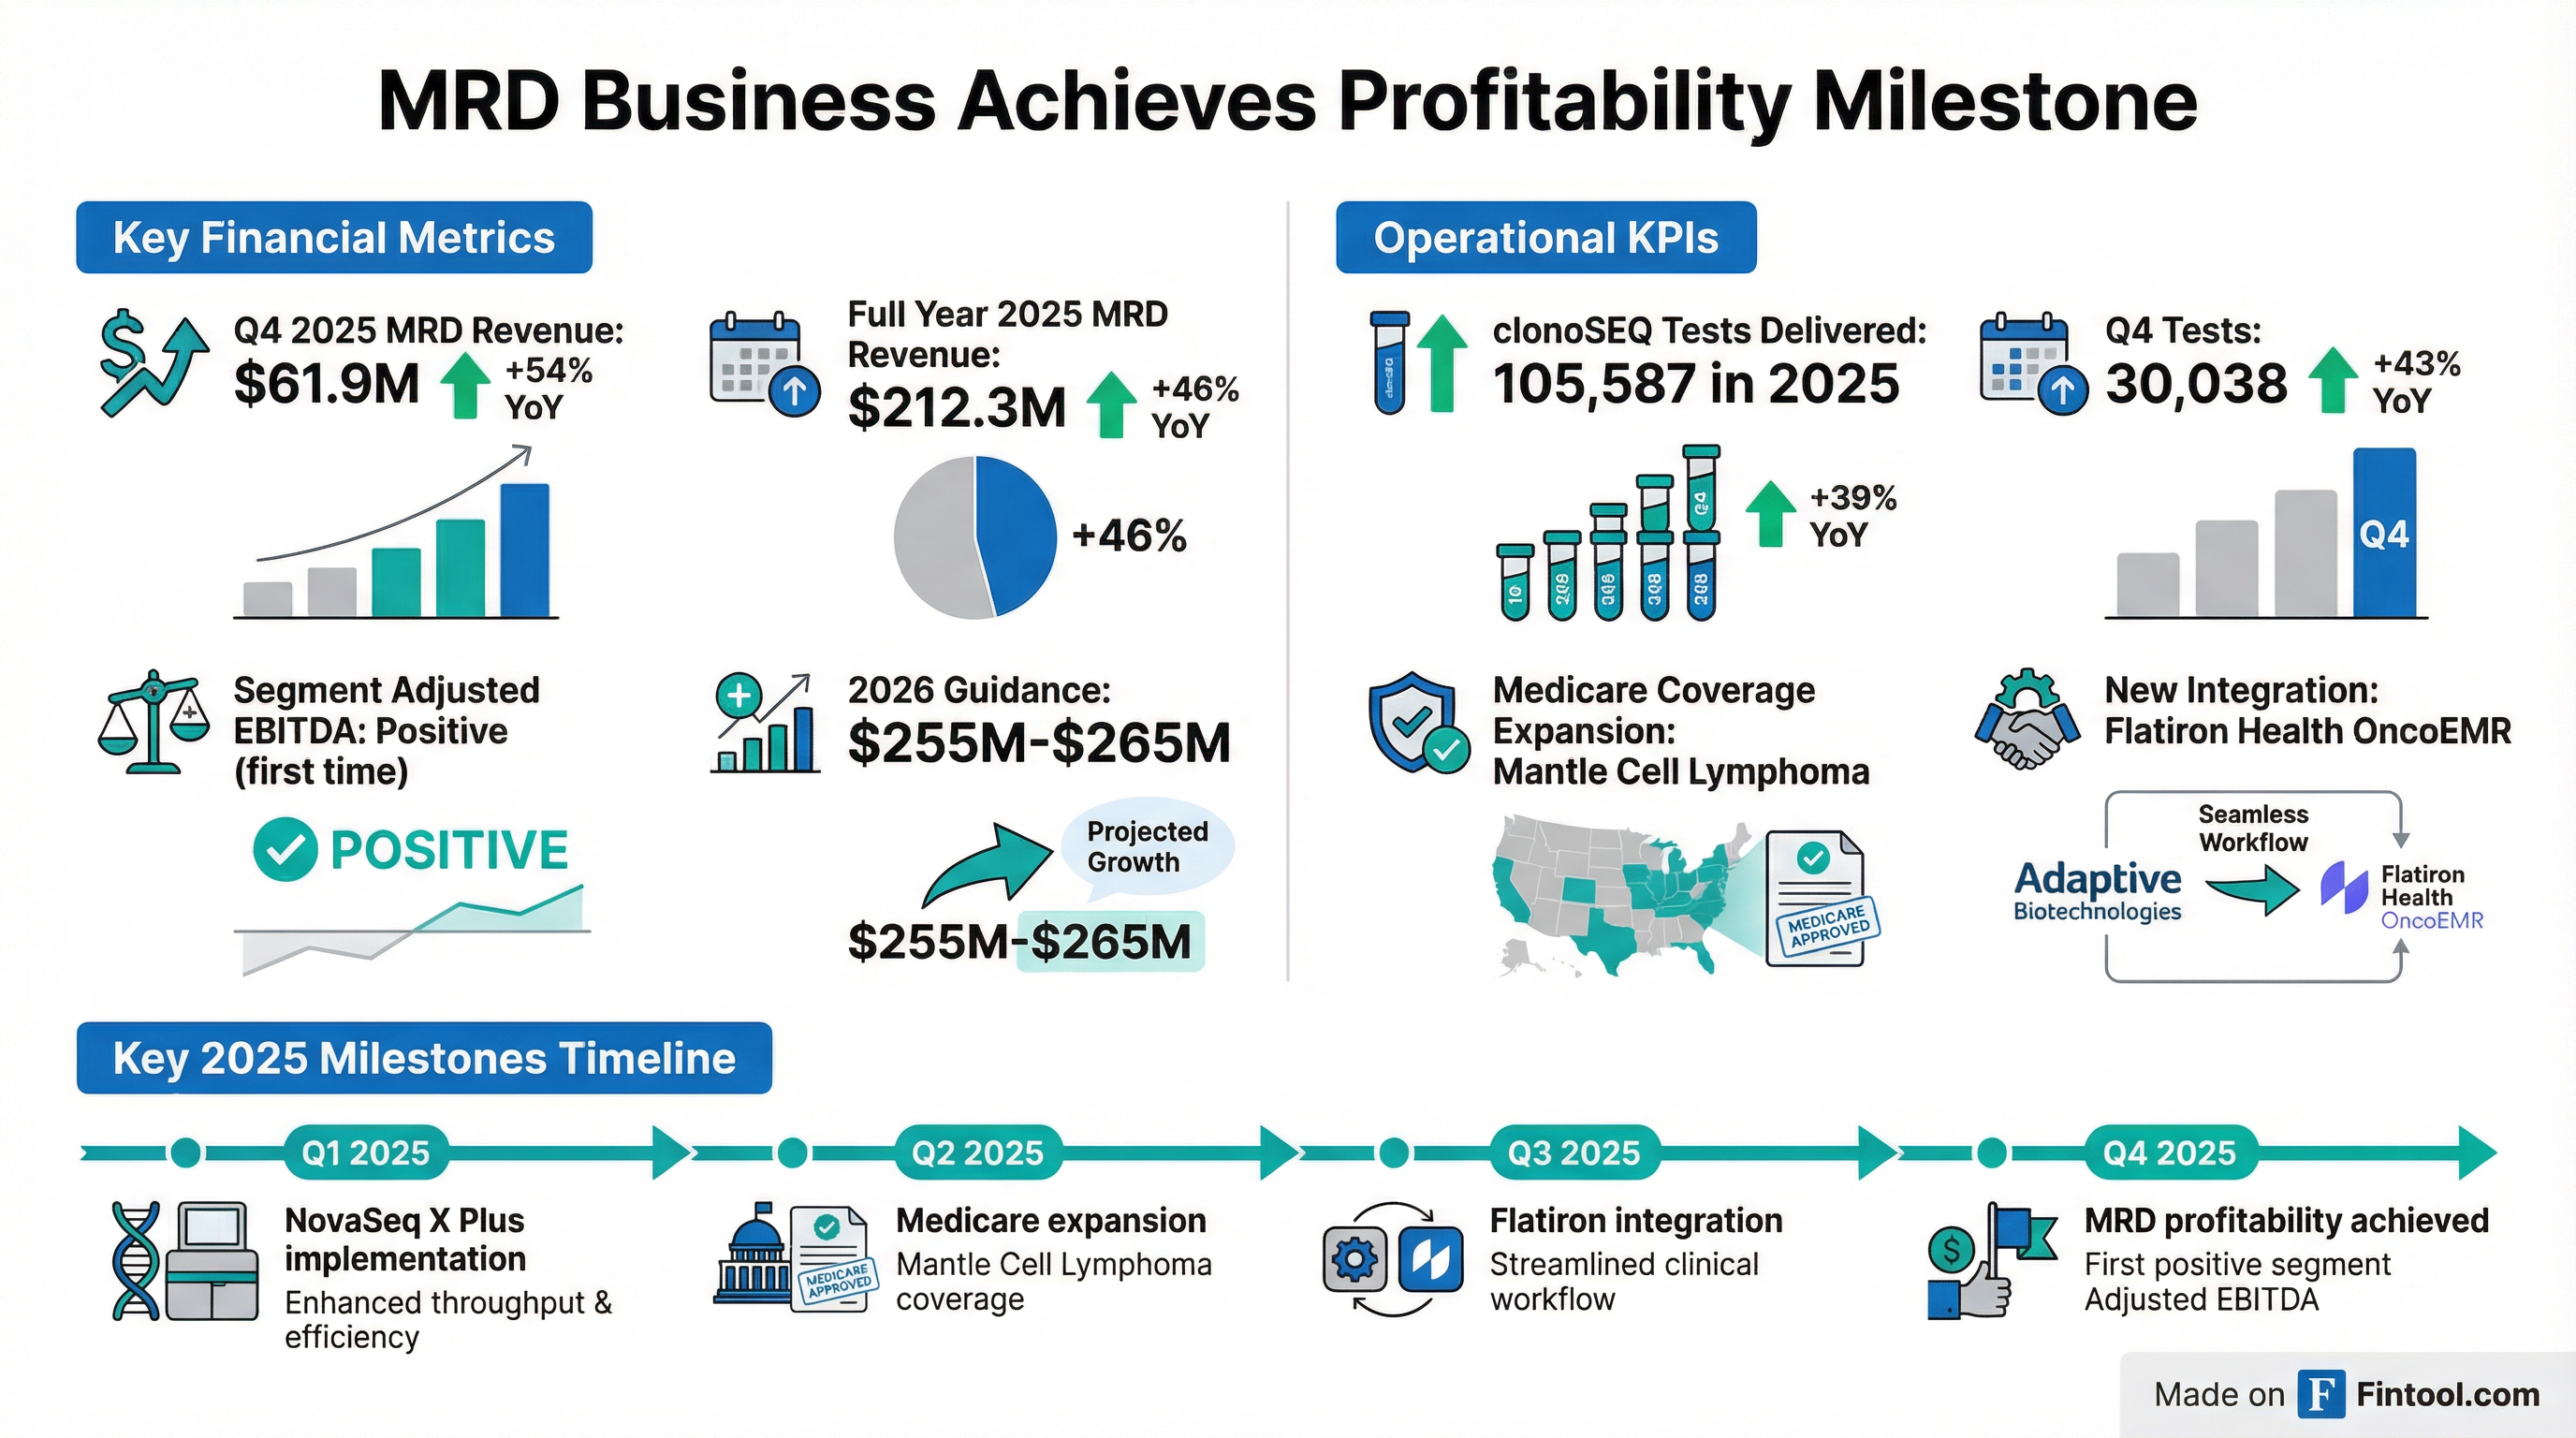
For 2026, Adaptive provided guidance that exceeded expectations on MRD revenue:
Notable: Management did not provide revenue guidance for the Immune Medicine segment, which contributes roughly 23% of total revenue. This segment saw $41.3M recognized in 2025 from the full amortization of prior Genentech Agreement payments—a one-time benefit that won't recur.
CEO Chad Robins emphasized the path to company-wide profitability: "We delivered 46% revenue growth and achieved profitability in our MRD business, while advancing our Immune Medicine platform through scaled TCR-antigen data generation and two data partnerships. As we enter 2026, we are well positioned to drive continued growth, expand margins and achieve company-wide profitability."
How Did the Stock React?
The stock's regular-session decline (likely driven by broader market volatility) reversed sharply after the earnings release. The after-hours move reflects investor enthusiasm for the MRD profitability milestone and beat-and-raise quarter.
2026 Operational Targets
Management laid out aggressive operational targets for the MRD business in 2026:
Pharma Pipeline Strength: The company exited 2025 with a ~$210M pharma backlog, with CLL/ALL bookings more than tripling YoY.
FDA Regulatory Tailwind: Approximately 60% of pharma portfolio now includes MRD as an endpoint, up from ~40% in 2024. This shift was driven by the ODAC recommendation and subsequent FDA draft guidance supporting MRD as a primary endpoint in multiple myeloma accelerated approvals.
What Changed From Last Quarter?
MRD Business Achieves Profitability
The most significant development is the MRD segment achieving positive Adjusted EBITDA—a first for the company:
Full Year Profitability Trajectory
clonoSEQ Test Volume Acceleration
Quarterly Volume Progression:
Volume growth is accelerating as EMR integrations scale (173 integrated accounts driving ~40% of ordering volume) and blood-based testing expands (47% of tests in Q4'25).
Q4 2025 Volume by Indication:
Ordering HCPs: Increased 9% sequentially and 45% YoY in Q4, with particularly strong adoption in community settings.
Key Operational Highlights
2025 Achievements
-
Medicare Coverage Expansion: Received expanded clonoSEQ coverage for recurrence monitoring in mantle cell lymphoma
-
Flatiron Health Integration: Launched clonoSEQ integration into OncoEMR®, a leading electronic medical record platform for community oncology
-
Technology Upgrade: Implemented NovaSeq X Plus for clonoSEQ clinical sequencing, enhancing throughput and efficiency
-
Pharma Partnerships: Recognized $19.5M in MRD pharma regulatory milestone revenue
-
Pfizer Data Deals: Signed two distinct, non-exclusive immune receptor data licensing agreements with Pfizer Inc.
Financial Position
The company's liquidity position remains solid at $240.2M, inclusive of $13.1M held by Digital Biotechnologies, Inc.
Segment Breakdown
MRD (Minimal Residual Disease) — 86% of Q4 Revenue
The MRD segment, anchored by the clonoSEQ test, continues to drive the business:
Immune Medicine — 14% of Q4 Revenue
Important context: FY 2025 Immune Medicine revenue includes $41.3M from full amortization of prior Genentech Agreement payments. Excluding this, Immune Medicine revenue was $23.4M (+17% YoY).
Strategic Pivot: Management announced a decision to discontinue therapeutic development and explore out-licensing or publishing the pre-clinical antibody data for the TCR-depleting antibody in ankylosing spondylitis. This sharpens focus on the core MRD business and reduces IM annual cash burn from ~$30M in 2025 to $15-20M targeted in 2026.
The IM segment has built significant proprietary assets: >5M paired TCRs spanning over 20,000 antigens and nearly 50 HLA types—orders of magnitude larger than publicly available data. Management believes this scale is sufficient to train predictive models of the adaptive immune response across diseases including cancer, autoimmunity, and infectious diseases.
Disease Focus Areas: Type 1 diabetes, celiac disease, multiple sclerosis, rheumatoid arthritis (Pfizer partnership).
Q&A Highlights
Quest Diagnostics Competitive Entry
A key topic in the Q&A was Quest Diagnostics launching a flow cytometry-based MRD assay for multiple myeloma. Susan O'Brien addressed the competitive threat directly:
"It's interesting to see that Quest had launched a product in the space. From our perspective, it's not particularly a new dynamic for us... flow-based methods for MRD assessment are inherently less sensitive than clonoSEQ, and they always will be for any given amount of sample material."
Key differentiators management highlighted:
- Sensitivity Gap: Quest claims 1 in 200,000 sensitivity with 10mL blood; clonoSEQ achieves 1 in 1 million with just 2mL blood (5-7x more sensitive)
- Market Direction: Myeloma treatments are driving deeper responses, requiring more sensitivity, not less
- Blood Testing Advantage: Over 60% of community myeloma MRD testing is blood-based, where clonoSEQ's sensitivity advantage is magnified (100x less disease burden in blood vs. marrow)
- Competitive Moat: 90%+ of patients have zero out-of-pocket cost; broadly EMR integrated; established hematologist relationships
DLBCL Penetration Opportunity
"In DLBCL... we saw 14% quarter-over-quarter growth sequentially, 115% versus Q4 of the prior year. But we're still only at 3% of penetration of the patient opportunity." — Susan O'Brien
Management believes competitive entry could actually expand the market and is focused on:
- Enhanced ctDNA assay launched in early 2025
- Broadening commercial payer coverage
- Deepening pharma engagement for MRD-guided trial designs
Gross Margin Expansion Path
CEO Chad Robins confirmed upgraded long-term margin targets at JP Morgan:
"At J.P. Morgan, we came out and kind of moved that number already up from 70% to 75%. And you're absolutely right. We're not fully loaded in the sense that the transition to NovaSeq X Plus just happened in the back half of this year."
Drivers of margin expansion:
- NovaSeq X Plus transition: 5-8% cost reduction in first 12 months, 10%+ ongoing
- Continued ASP growth (targeting $1,700-$1,800 by 2029)
- Operating leverage as volume scales
Weather Impact on Q1
"We have seen some weather-related impacts... in recent weeks, primarily on timing of sample arrival as opposed to volume, although some impacts, of course, on volume as well. FedEx was not delivering for some number of days. Hospitals and practices closed down. Good news is samples are starting to flow back in in large volumes, and we had a very strong start to the beginning of Q1."
ASP and Reimbursement Progress
Management provided detailed commentary on the path to $1,400 ASP in 2026:
2025 Payer Contract Wins
"These include the successful renegotiation of eight major payer contracts with national and regional payers, including Humana, Aetna, Horizon, and multiple Blue Cross plans, as well as the signing of new agreements with Anthem, Centene, Florida, and L.A. Care."
Key reimbursement achievements:
- Expanded commercial coverage in DLBCL and CLL
- Revenue cycle improvements: Medicaid collections, appeals, prior authorization, time to cash
- AI-enabled workflows: Driving higher paid claim rates and more consistent realization
- Commercial payer cash collections: Up 74% YoY
2026 Payer Priorities
Two large national payer contracts in negotiations, representing 17-18% of volume. Management cautioned timing could impact ASP trajectory but expressed confidence in achieving the $1,400 target through multiple levers.
Gross Margin Expansion
Sequencing gross margin (excluding milestones and licensing revenue) showed strong improvement:
Drivers: Production efficiencies, labor leverage, NovaSeq X Plus transition
Sales Force and Commercial Strategy
Current sales team structure: 65 reps split 50/50 between academic and community focus. Management believes this is the right footprint for now—no significant expansion planned for 2026.
"We believe this is the right number of reps for now as our territories are manageable in terms of potential. The reps are calling on the right number of accounts and HCPs, and most of the territories are reasonable size." — Susan O'Brien
Community setting priorities:
- MIDAS data supporting potential transplant avoidance (significant for community clinicians)
- Guideline updates (particularly important in community)
- New testing pathways in large community practice networks
- Flatiron EMR integration enabling serial testing
EMR Integration Upside
Management highlighted potential upside from EMR optimization initiatives:
"On the EMR side, we've increased the focus on already integrated sites to what we call optimize those sites. This is things like standardizing order sets to increase testing consistency or further reducing the friction in integrated workflows, which will improve order pull-through. Those kinds of initiatives are new, but the early results from pilots that we've completed have been very strong."
Serial Testing Progress: About 60% of scheduled serial tests are showing up—management sees potential upside from optimizing this rate.
Operating Expense Discipline
Despite 51% revenue growth, operating expenses increased just 4%—demonstrating strong operating leverage.
Forward Catalysts
-
Company-Wide Profitability by Year-End 2026: Management is targeting positive adjusted EBITDA and positive FCF for the whole company, with MRD already profitable
-
Continued MRD Growth: Guidance of $255-265M implies 22% YoY growth; targeting >30% volume growth and clinical ASP of ~$1,400/test
-
Clinical Data Readouts: Multiple studies expected in 2026: MM (MASTER-2), ALL (CAR-CURE), plus EndRAD, Veneto-STOP, and BOVen readouts
-
Medicare Expansion: Expect to file for CLL recurrence monitoring coverage in 2026 after receiving first MCL recurrence monitoring coverage
-
IM Data Monetization: Additional data partnership opportunities following two Pfizer deals; exploring out-licensing of antibody pre-clinical data
Analyst Coverage
Key Takeaways
-
Beat-and-raise quarter: Revenue beat by 21%, EPS beat by 53%, and guidance implies continued strong growth
-
MRD profitability achieved: The core business segment turned Adjusted EBITDA positive—a significant inflection point
-
Operating leverage emerging: Revenue up 51% YoY while operating expenses up just 4%
-
Path to company-wide profitability: Management targeting positive adjusted EBITDA and positive FCF for the whole company by year-end 2026
-
Strong test volume growth: clonoSEQ volumes up 43% in Q4; $210M pharma backlog provides visibility; FDA guidance supporting MRD as primary endpoint provides regulatory tailwind
-
Gross margin expansion: Q4 sequencing gross margin hit 71%, with path to 75%+ long-term via NovaSeq X Plus and ASP growth
-
Competitive moat intact: Quest's new flow cytometry product is 5-7x less sensitive than clonoSEQ; management confident in differentiation
-
IM strategic pivot: Discontinuing therapeutic development to focus on data monetization and out-licensing, reducing IM cash burn to $15-20M
This analysis is based on Adaptive Biotechnologies' Q4 2025 8-K filing, press release, earnings slide deck, and earnings call transcript dated February 5, 2026.