Arthur J. Gallagher & (AJG)·Q4 2025 Earnings Summary
Arthur J. Gallagher Q4 2025: Misses Estimates But Guides 5.5% Organic Growth; Stock Rallies 2.4%
January 29, 2026 · by Fintool AI Agent
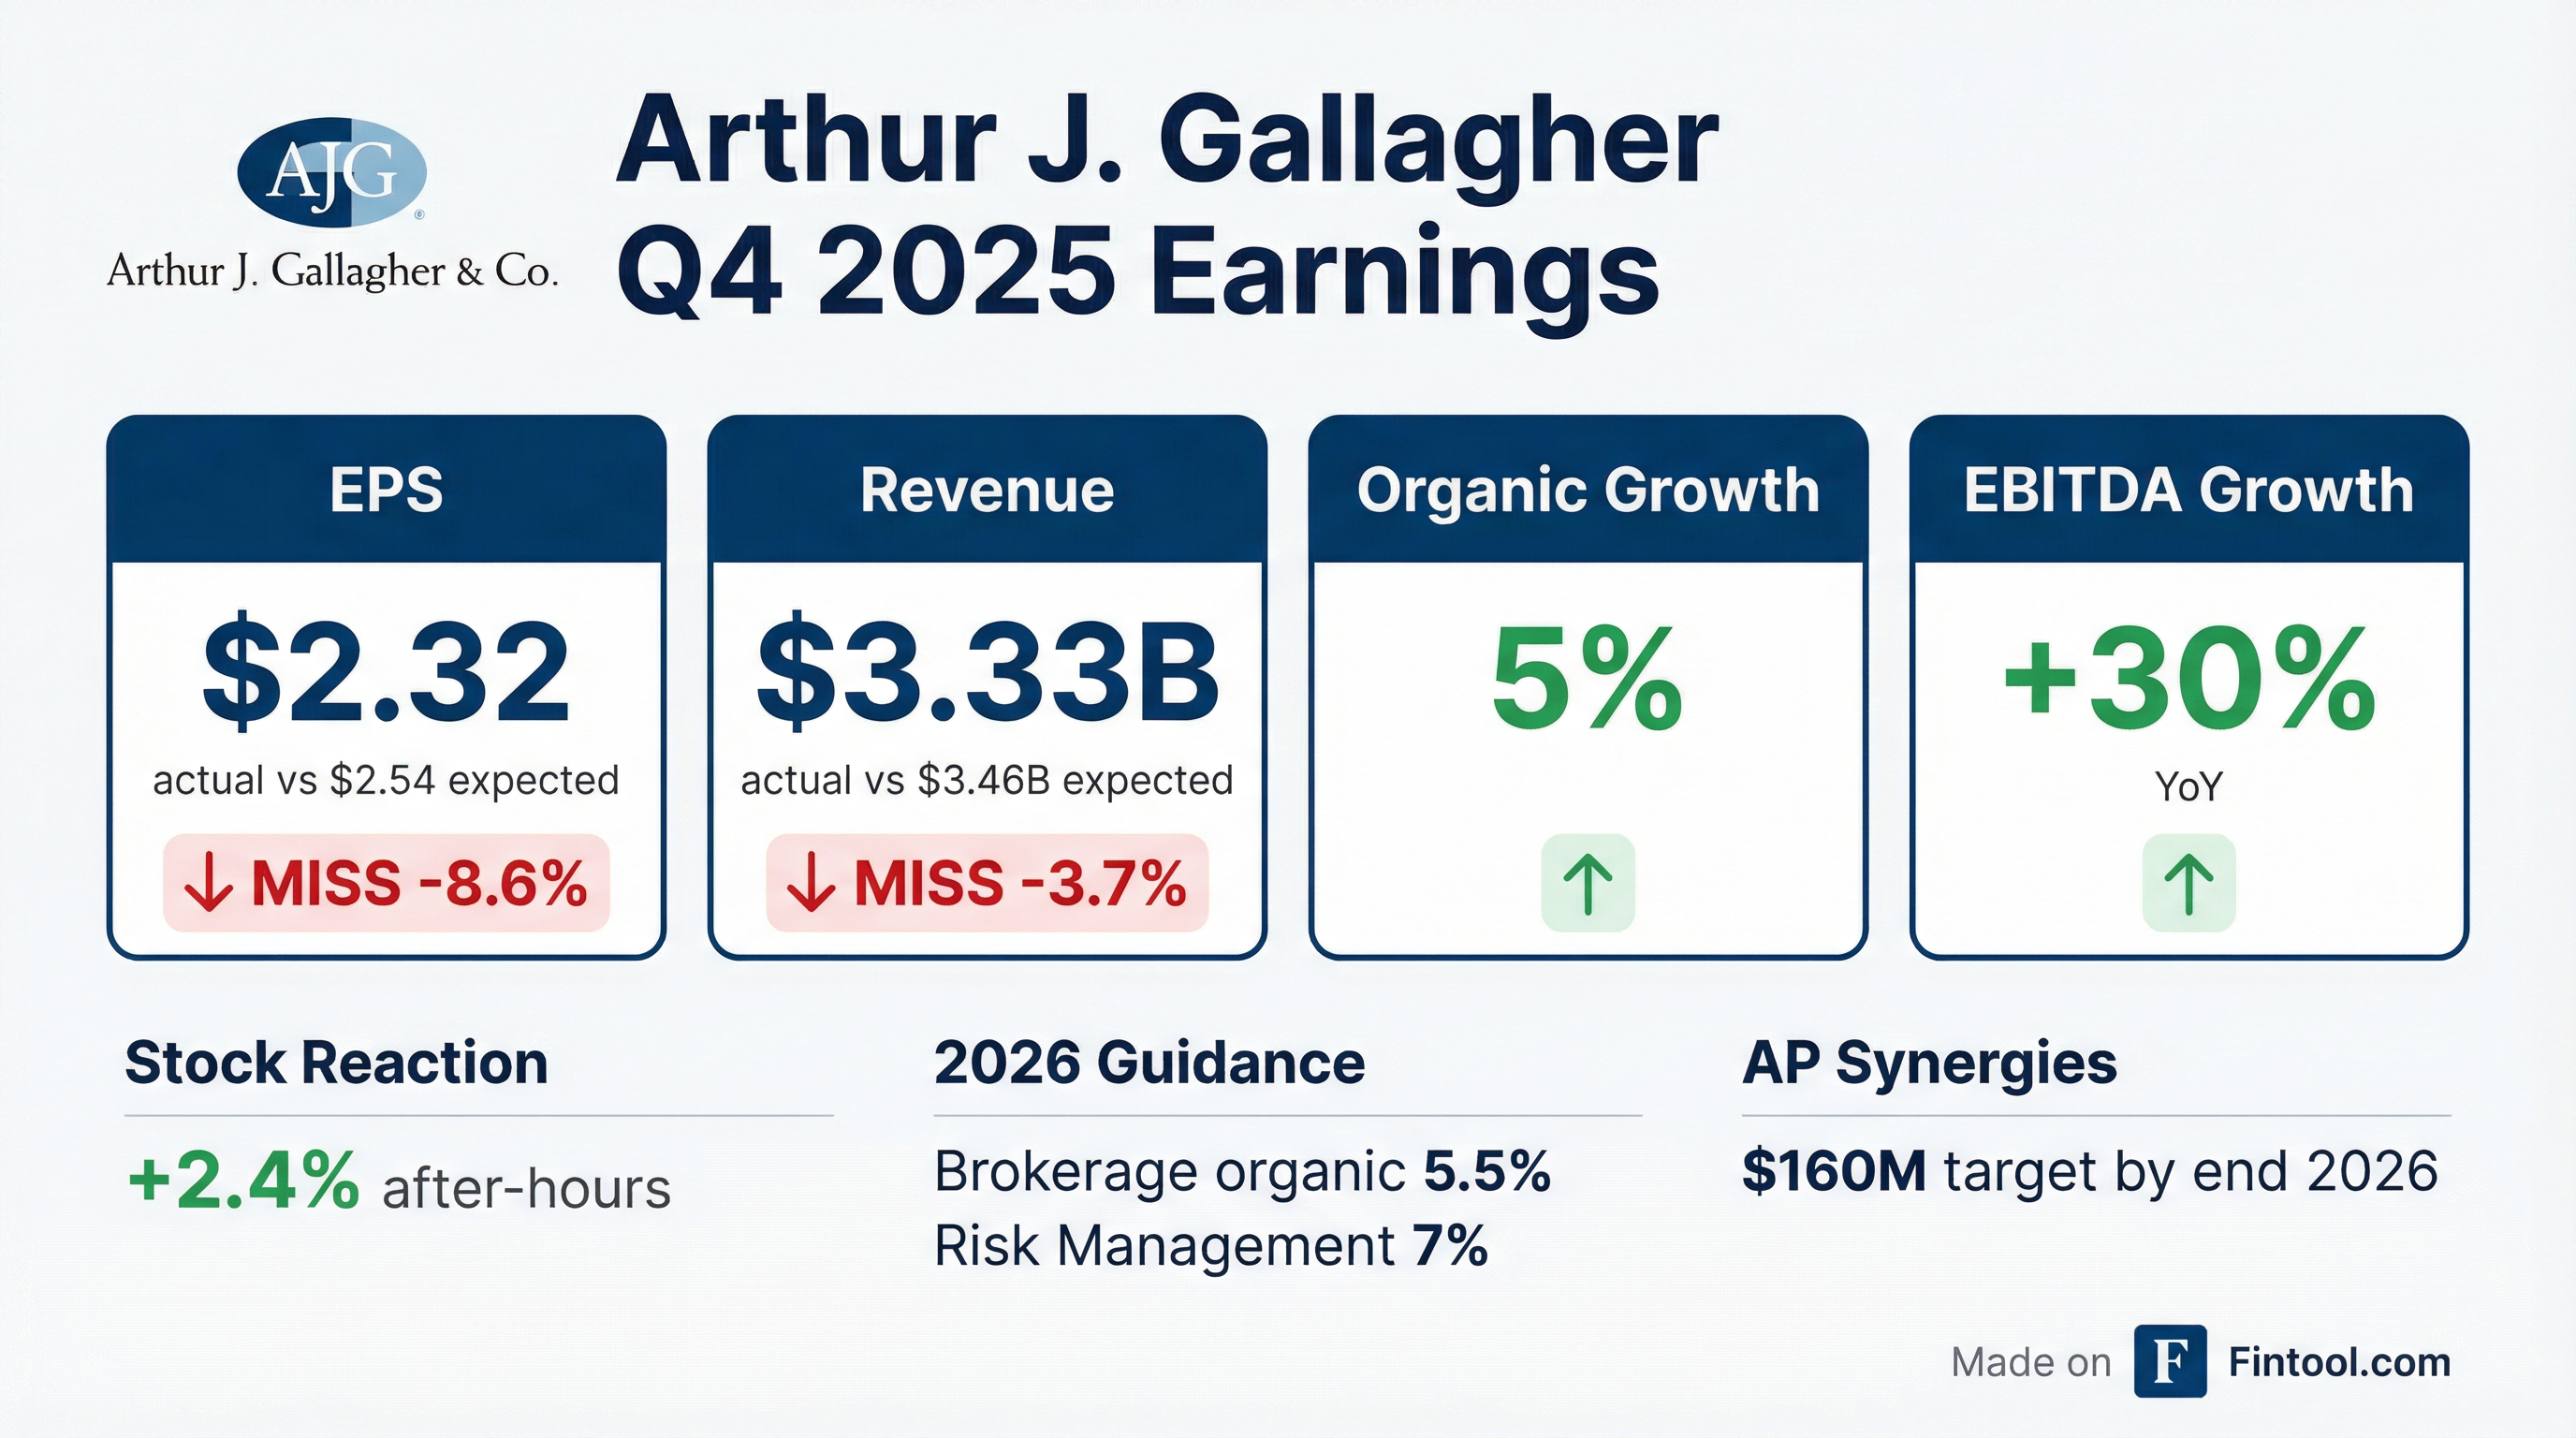
Arthur J. Gallagher (NYSE: AJG) reported Q4 2025 results that missed Wall Street expectations on both EPS and revenue, but the stock rallied 2.4% after-hours as management delivered confident 2026 guidance and detailed strong integration progress on the transformative $13.5 billion AssuredPartners acquisition. Revenue surged 30%+ year-over-year driven by the AP deal, while organic growth of 5% and margin expansion of 50 basis points demonstrated the underlying health of the business.
CEO Pat Gallagher's opening: "We had an excellent fourth quarter and a terrific year. Our two-pronged revenue growth strategy (that's organic and M&A) delivered revenue growth of more than 30% during the fourth quarter. That includes organic growth of 5%. Adjusted EBITDA growth was 30%, marking our 23rd consecutive quarter of double-digit growth."
Did Arthur J. Gallagher Beat Earnings?
No — AJG missed on both EPS and revenue, but the misses are nuanced.
Why the miss doesn't tell the full story:
CFO Doug Howell explained that Q4 2025 margins weren't comparable to Q4 2024 due to: (1) no longer earning investment income on funds held pre-AP closing, and (2) rolling M&A impact. After adjusting for these factors, "the quick math shows... 50 basis points of underlying expansion, right at the midpoint of our 40-60 basis points of expansion we estimated during our December IR day."
Beat/Miss History (Last 8 Quarters):
What Did Management Guide for 2026?
Management provided detailed 2026 outlook that was unchanged from their December Investor Day, signaling confidence in the business trajectory.
Brokerage Segment:
- Organic growth: ~5.5%
- Underlying margin expansion: 40-60 basis points
Brokerage Organic Growth by Business Line (2026 Estimate):
3-Year Organic Growth History by Segment:
Risk Management Segment:
- Organic growth: ~7%
- Margins: 21-22% range
CFO Doug Howell on margin outlook: "Your recollection is right. We believe that you can start seeing some margin expansion at 4%, and then you go up 5%, 6%, 7%, you get more margin expansion... I think that we've got two levers that are going to be pulled — just the natural increase as we grow more, and then also the rolling synergies of AP."
AssuredPartners Synergy Targets
"We remain firmly on track with our integration plans and are confident we will be able to deliver on our synergy targets."
AssuredPartners 2026 Financial Estimates
Management provided detailed AssuredPartners financial projections for 2026 (pre-synergies):
Note: Estimates are mid-point of forecasted range, before impact of synergies. Results depend on final closing balance sheet valuations and accounting policy harmonization.
Integration progress highlights:
- All U.S. retail operations rebranded to Gallagher (as of ~Jan 20, 2026)
- General ledger, HR, payroll, treasury, and T&E systems now live
- Gallagher Drive (digital sales platform) deployed to all AP salespeople within 2 weeks of close
- 90% of AP employees met in person through executive visits
How Is the Insurance Pricing Environment?
Management provided a detailed breakdown of the Q4 2025 insurance renewal pricing environment, which shows a bifurcated market with property softening offset by casualty firming.
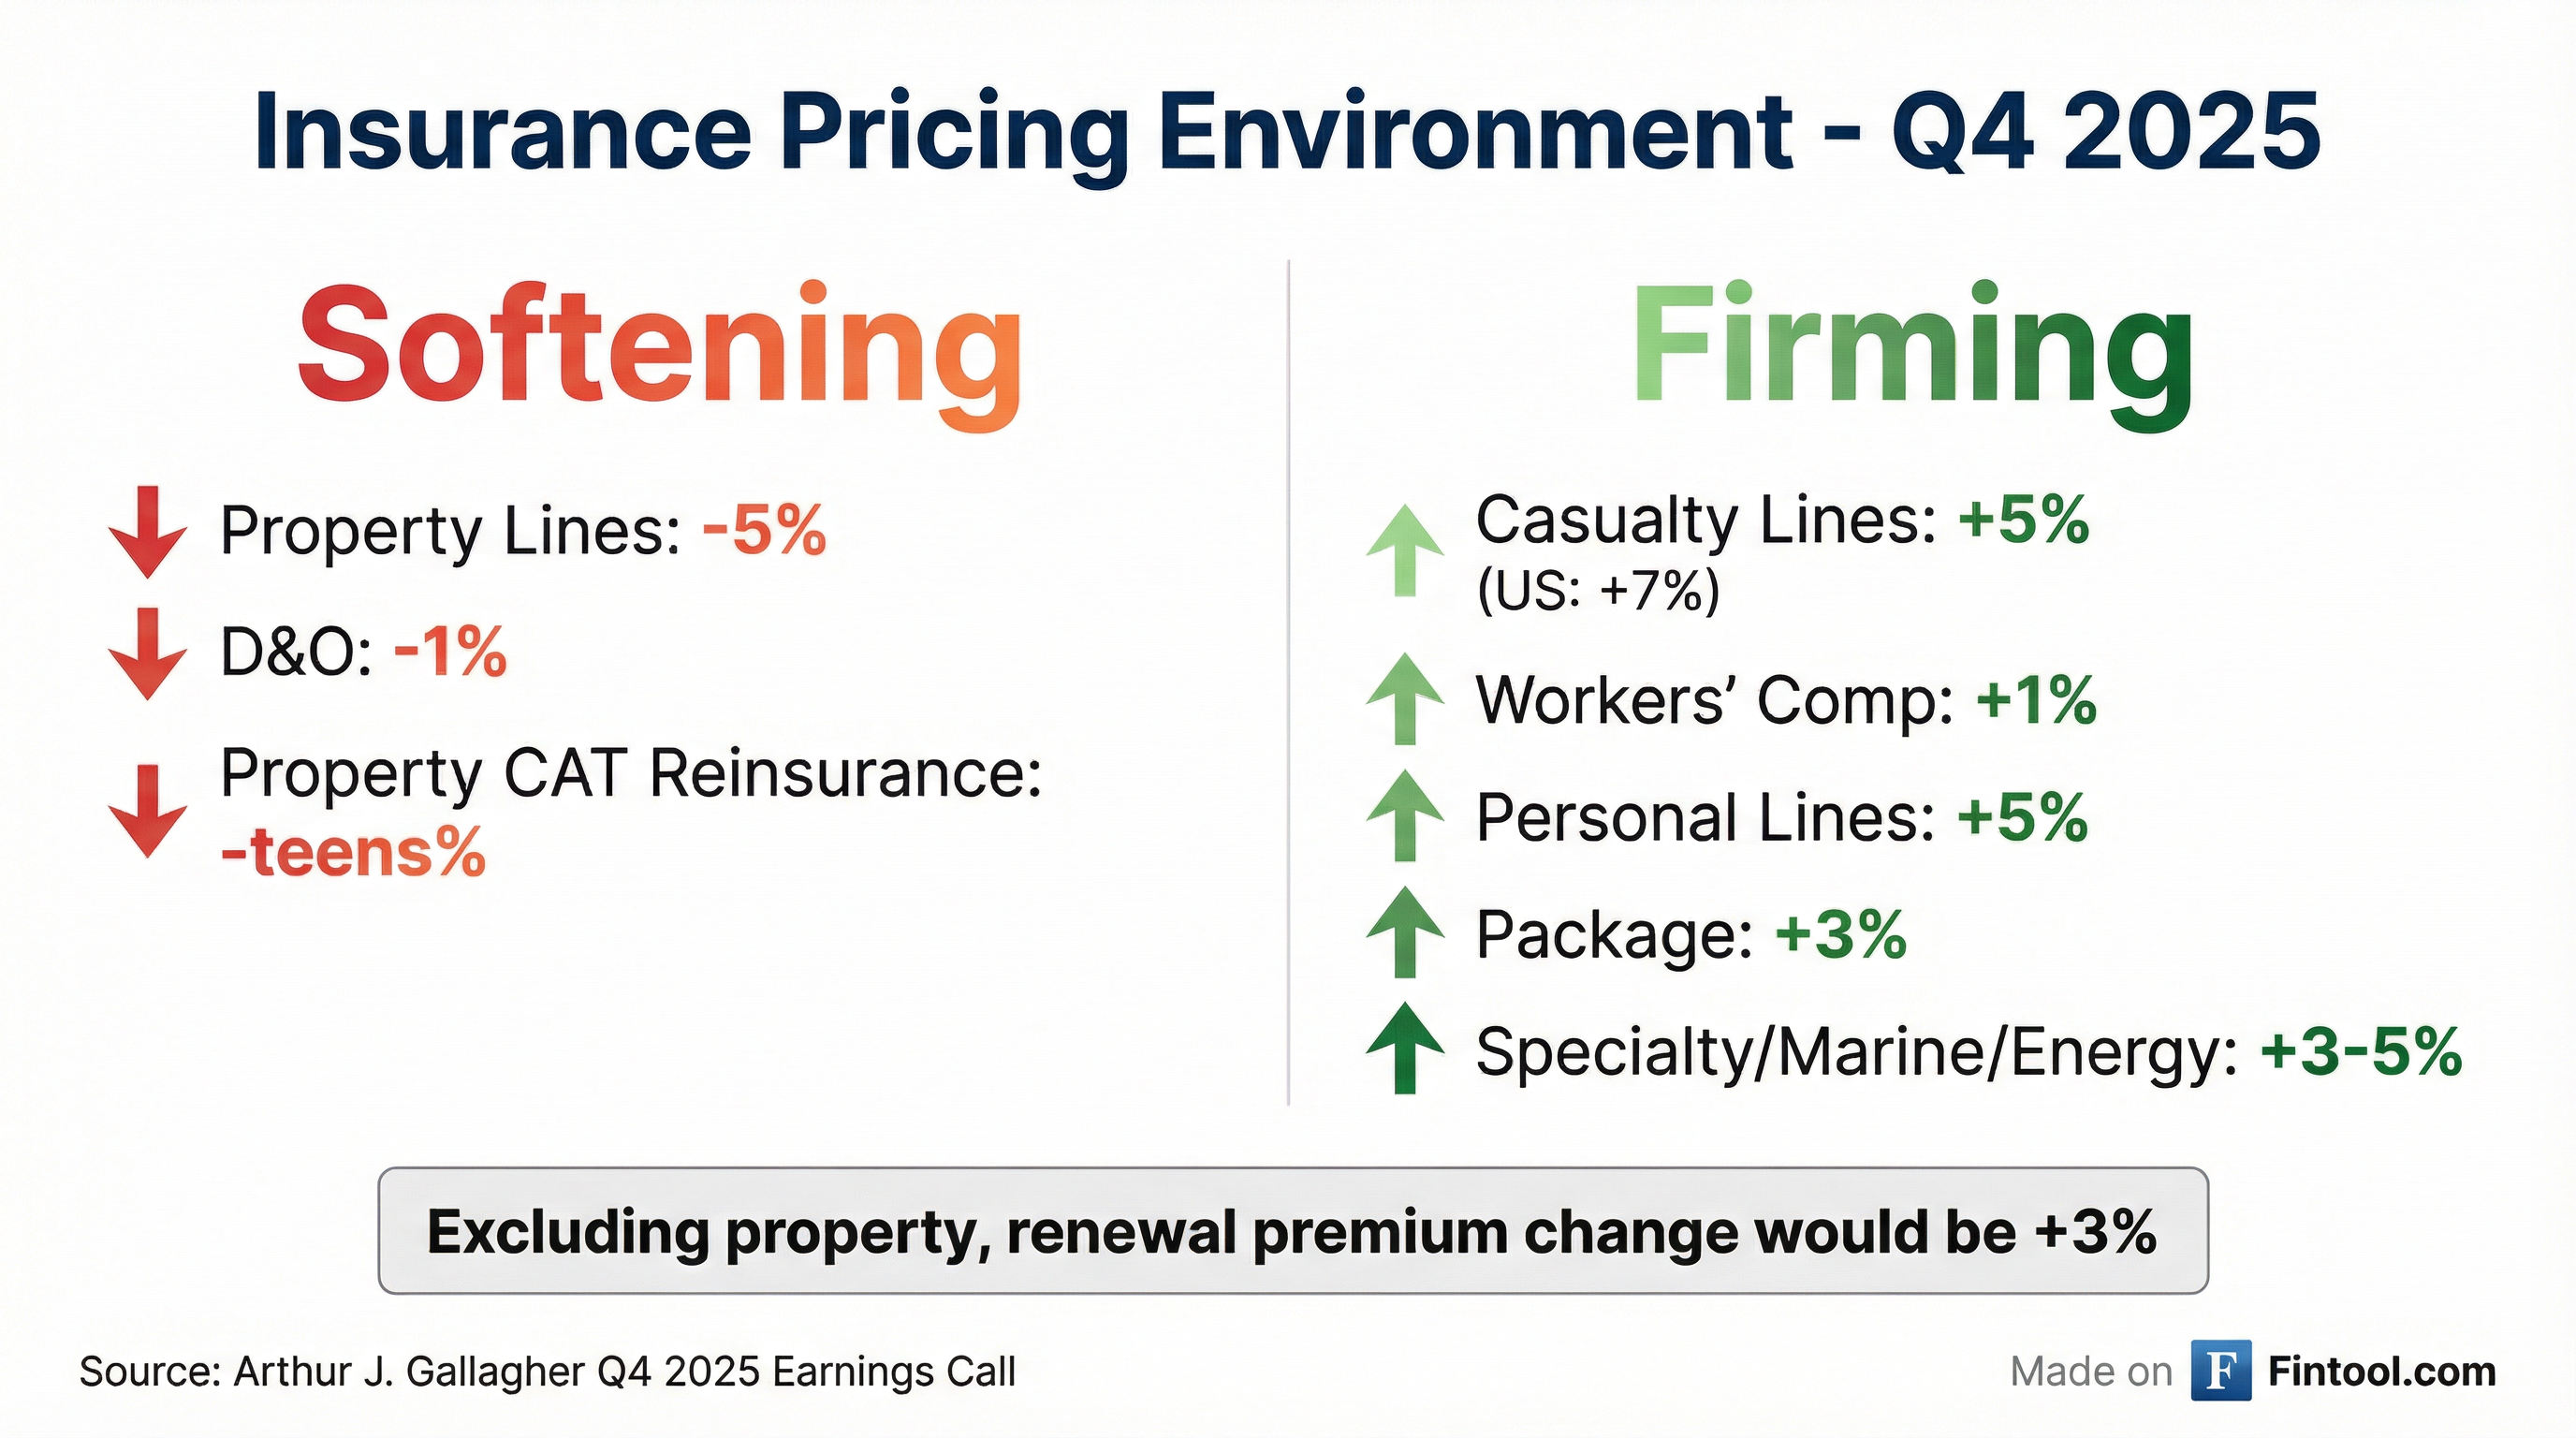
Q4 2025 Renewal Premium Changes:
Key insight: "Excluding property, renewal premium change we'd be up about 3% during the quarter."
2026 Casualty Outlook: CFO Doug Howell expects casualty rates to remain elevated: "What do we assume for next year as we're thinking about it? We're assuming that casualty rates will be up in that 7%-8% range."
Reinsurance 1/1 Renewals
The one-to-one renewal season showed a buyer's market:
- Property CAT rates down in the teens (double-digits)
- Lower layers holding up better than top of towers
- Property reinsurance premiums down only mid-to-high single digits (due to increased buying)
- Casualty reinsurance broadly stable — reinsurers remain "very cautious of U.S.-focused casualty risks"
- Marine and energy seeing increased carrier competition
"Looking ahead, we expect the buyer's market will persist through 2026, absent any outsized current year or prior year loss activity."
How Did the Stock React?
Market reaction: Positive despite the miss
The positive after-hours reaction suggests investors are looking through the consensus miss to focus on:
- Strong underlying organic growth (5%)
- Margin expansion on comparable basis (50 bps)
- Successful AP integration with synergies on track
- Confident 2026 guidance (5.5% organic)
- Robust M&A pipeline
What Changed From Last Quarter?
Customer Business Activity
Management highlighted that proprietary data continues to show solid economic conditions:
"Fourth quarter revenue indications from audits, endorsements, and cancellations remain nicely positive and were more favorable compared to both fourth quarter 2024 and third quarter 2025. And through the first three weeks of January, these favorable trends continue."
"We're watching our customers' business activity daily, and we are just not seeing signs of economic weakness."
M&A Pipeline
M&A valuations trending lower: "They're coming down. I can't remember the last time I saw an ask for 16. These are over 10 on the tuck-in acquisitions, and you're down in that 12-13 times when you're talking about the bigger ones now."
Q&A Highlights
Digital Infrastructure & Data Centers
Asked about digital infrastructure opportunities, CEO Pat Gallagher highlighted the significant opportunity:
"Our construction practices are our largest practice... We have the ecosystem to do the job for clients across the entire span of what needs to go into a data center construction site. You've got real estate issues, you've got supply chain issues, you've got energy issues, et cetera, et cetera."
"A great bit of that opportunity is just the subs and all the activity that has to go into the whole process of building it. There's a huge drain on capabilities locally just for the construction expertise."
Producer Retention
Management pushed back strongly on concerns about talent poaching in the industry:
"I'm very pleased about the fact that just our retention of producers has not changed against historical norms in any way, literally over the past number of years."
CFO Doug Howell added specifics: "On a number-based percentage of producer retention is exactly dead flat. It's been that way since I've got us here going back to 2019, and it's dead flat on it."
AI and Disintermediation
CEO Pat Gallagher provided a colorful take on AI replacing insurance brokers:
"I addressed the same thing when we had the dawn of the internet. Goodbye, intermediaries. This is all going to be done by me at home on my computer. And that showed just not to be true... Guess what? People make a difference."
"The trusted advisor is more important today because of AI than it was before AI because everybody's confused because AI tells it it knows exactly what you should do, and we all know it lies."
However, AJG sees AI as an operational benefit: "We see AI as being a terrific benefit for us to get better, faster, at lower cost... The service layer, I think that we're going to be able to deliver a better, faster, and less expensive service offering."
London Wholesale Market Opportunity
When asked about disruption in London wholesaling (referencing Howden building a U.S. retail platform), Gallagher saw opportunity:
"It's a big opportunity. The answer is yes. Both in RPS and in our London-based wholesaling operations with customers that sell through that unnamed Howden company, and we're looking for a new outlet for their wholesale placements."
Full Year 2025 Results
CFO Doug Howell's summary: "An excellent 2025 for our combined brokerage and risk management segments. Organic growth of 6%, more than $3.5 billion of estimated acquired revenues, adjusted EBITDA growth of 26%, and adjusted EBITDA margin of 35%, up 70 basis points this year on an underlying comparable basis."
"It might be worth a reminder that since COVID hit us, every year our margins have marched higher. We're up over 400 basis points since then, and we still see many more opportunities to improve."
2026 Margin Bridge
Management provided a detailed margin bridge showing expected impacts on EBITDAC margin for 2026:
Key insight: Q3 2026 will see the largest AP margin benefit (+200 to +240 bps roll-in impact, +70 to +90 bps synergies) as AssuredPartners reaches full year-over-year comparability.
Clean Energy Investments
AJG's legacy clean energy investments continue to generate significant cash flows:
All 2009 and 2011 era investments have sunset, resulting in minimal adjusted after-tax earnings impact going forward. The cash flows are primarily driven by utilization of tax credits.
Key Risks Flagged
Management highlighted risk factors in their forward-looking statements:
- Integration execution — AP is the largest acquisition in company history; synergy realization critical
- Interest rate sensitivity — Elevated debt ($12.7B) increases rate exposure
- Geopolitical factors — Ukraine, Middle East, Latin America conflicts create uncertainty
- Tariffs and trade policy — Potential impact from protectionism measures
- Cybersecurity and AI risks — Technology operational risks
- Property catastrophe exposure — A major loss event could shift reinsurance pricing dramatically
What's Next for AJG?
Near-term catalysts:
- March 2026 Investor Day (additional 2026 detail expected)
- Q1 2026 earnings (typically late April)
- AP integration milestones throughout 2026
- Continued tuck-in acquisitions from $350M pipeline
Key monitoring points:
- Organic growth sustainability post-AP integration
- Synergy realization vs. $160M 2026 target
- Casualty pricing trajectory (7-8% assumption)
- Producer retention metrics
- M&A multiples (trending toward 12-13x)
Management's tone — Highly confident: "We have an unstoppable momentum driven by an amazing culture. I see 2026 being another terrific year." — CFO Doug Howell
Related:
Report generated by Fintool AI Agent on January 29, 2026. Data sources: AJG Q4 2025 earnings call transcript, Q4 2025 CFO Commentary, S&P Global consensus estimates, market data.