Digital Turbine (APPS)·Q3 2026 Earnings Summary
Digital Turbine Surges 13% After Crushing EPS Estimates by 57%
February 3, 2026 · by Fintool AI Agent
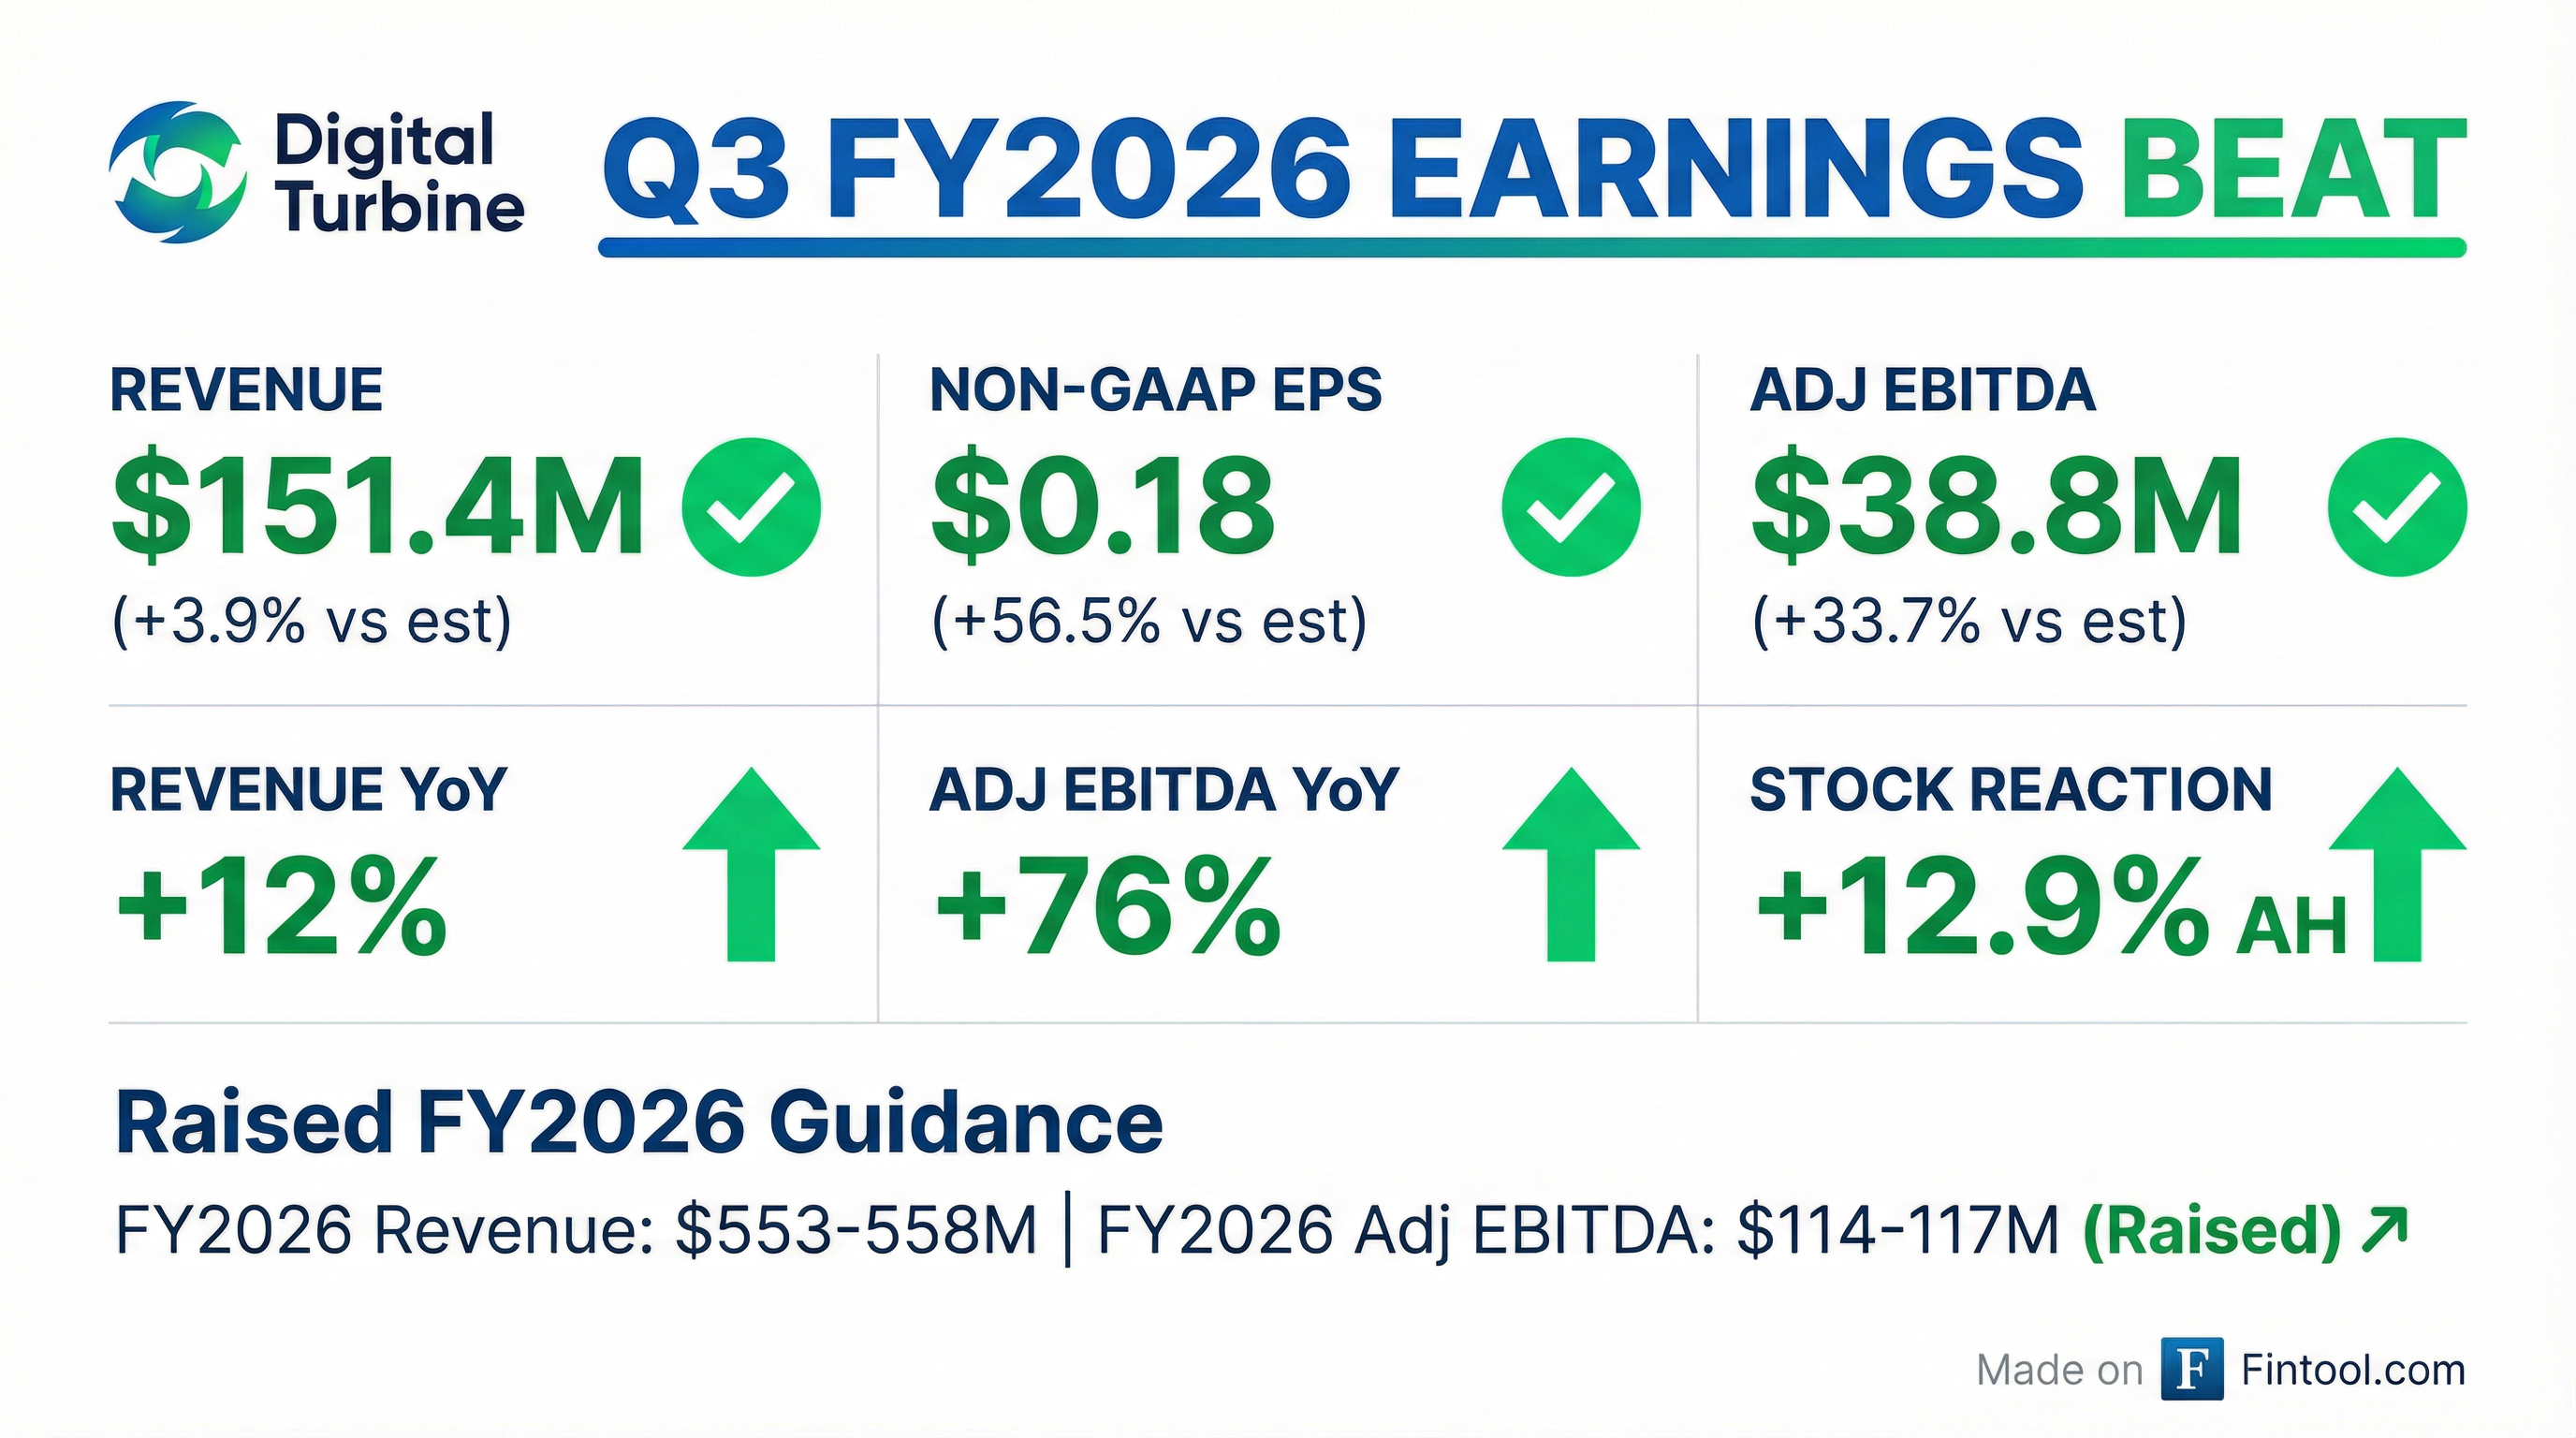
Digital Turbine delivered a blowout Q3 FY2026, crushing analyst expectations across all key metrics. The mobile app distribution and advertising company reported revenue of $151.4M (+12% YoY), non-GAAP EPS of $0.18 (vs. $0.115 expected), and raised full-year guidance above consensus. Shares spiked +12.9% in after-hours trading to $5.69, reversing a weak close of $5.04.
Did Digital Turbine Beat Earnings?
Triple beat. Digital Turbine exceeded expectations on revenue, EPS, and EBITDA—a clean sweep that drove the after-hours rally.
The EPS beat is particularly notable—management delivered 57% more than analysts expected, demonstrating significant operating leverage as revenue scales.
Year-over-year trends:
- Revenue: +12% ($151.4M vs $134.6M)
- Adjusted EBITDA: +76% ($38.8M vs $22.0M)
- GAAP Net Income: $5.1M profit vs ($23.1M) loss
What Did the Segments Deliver?
Both segments contributed to the beat, with App Growth Platform leading on growth rate:
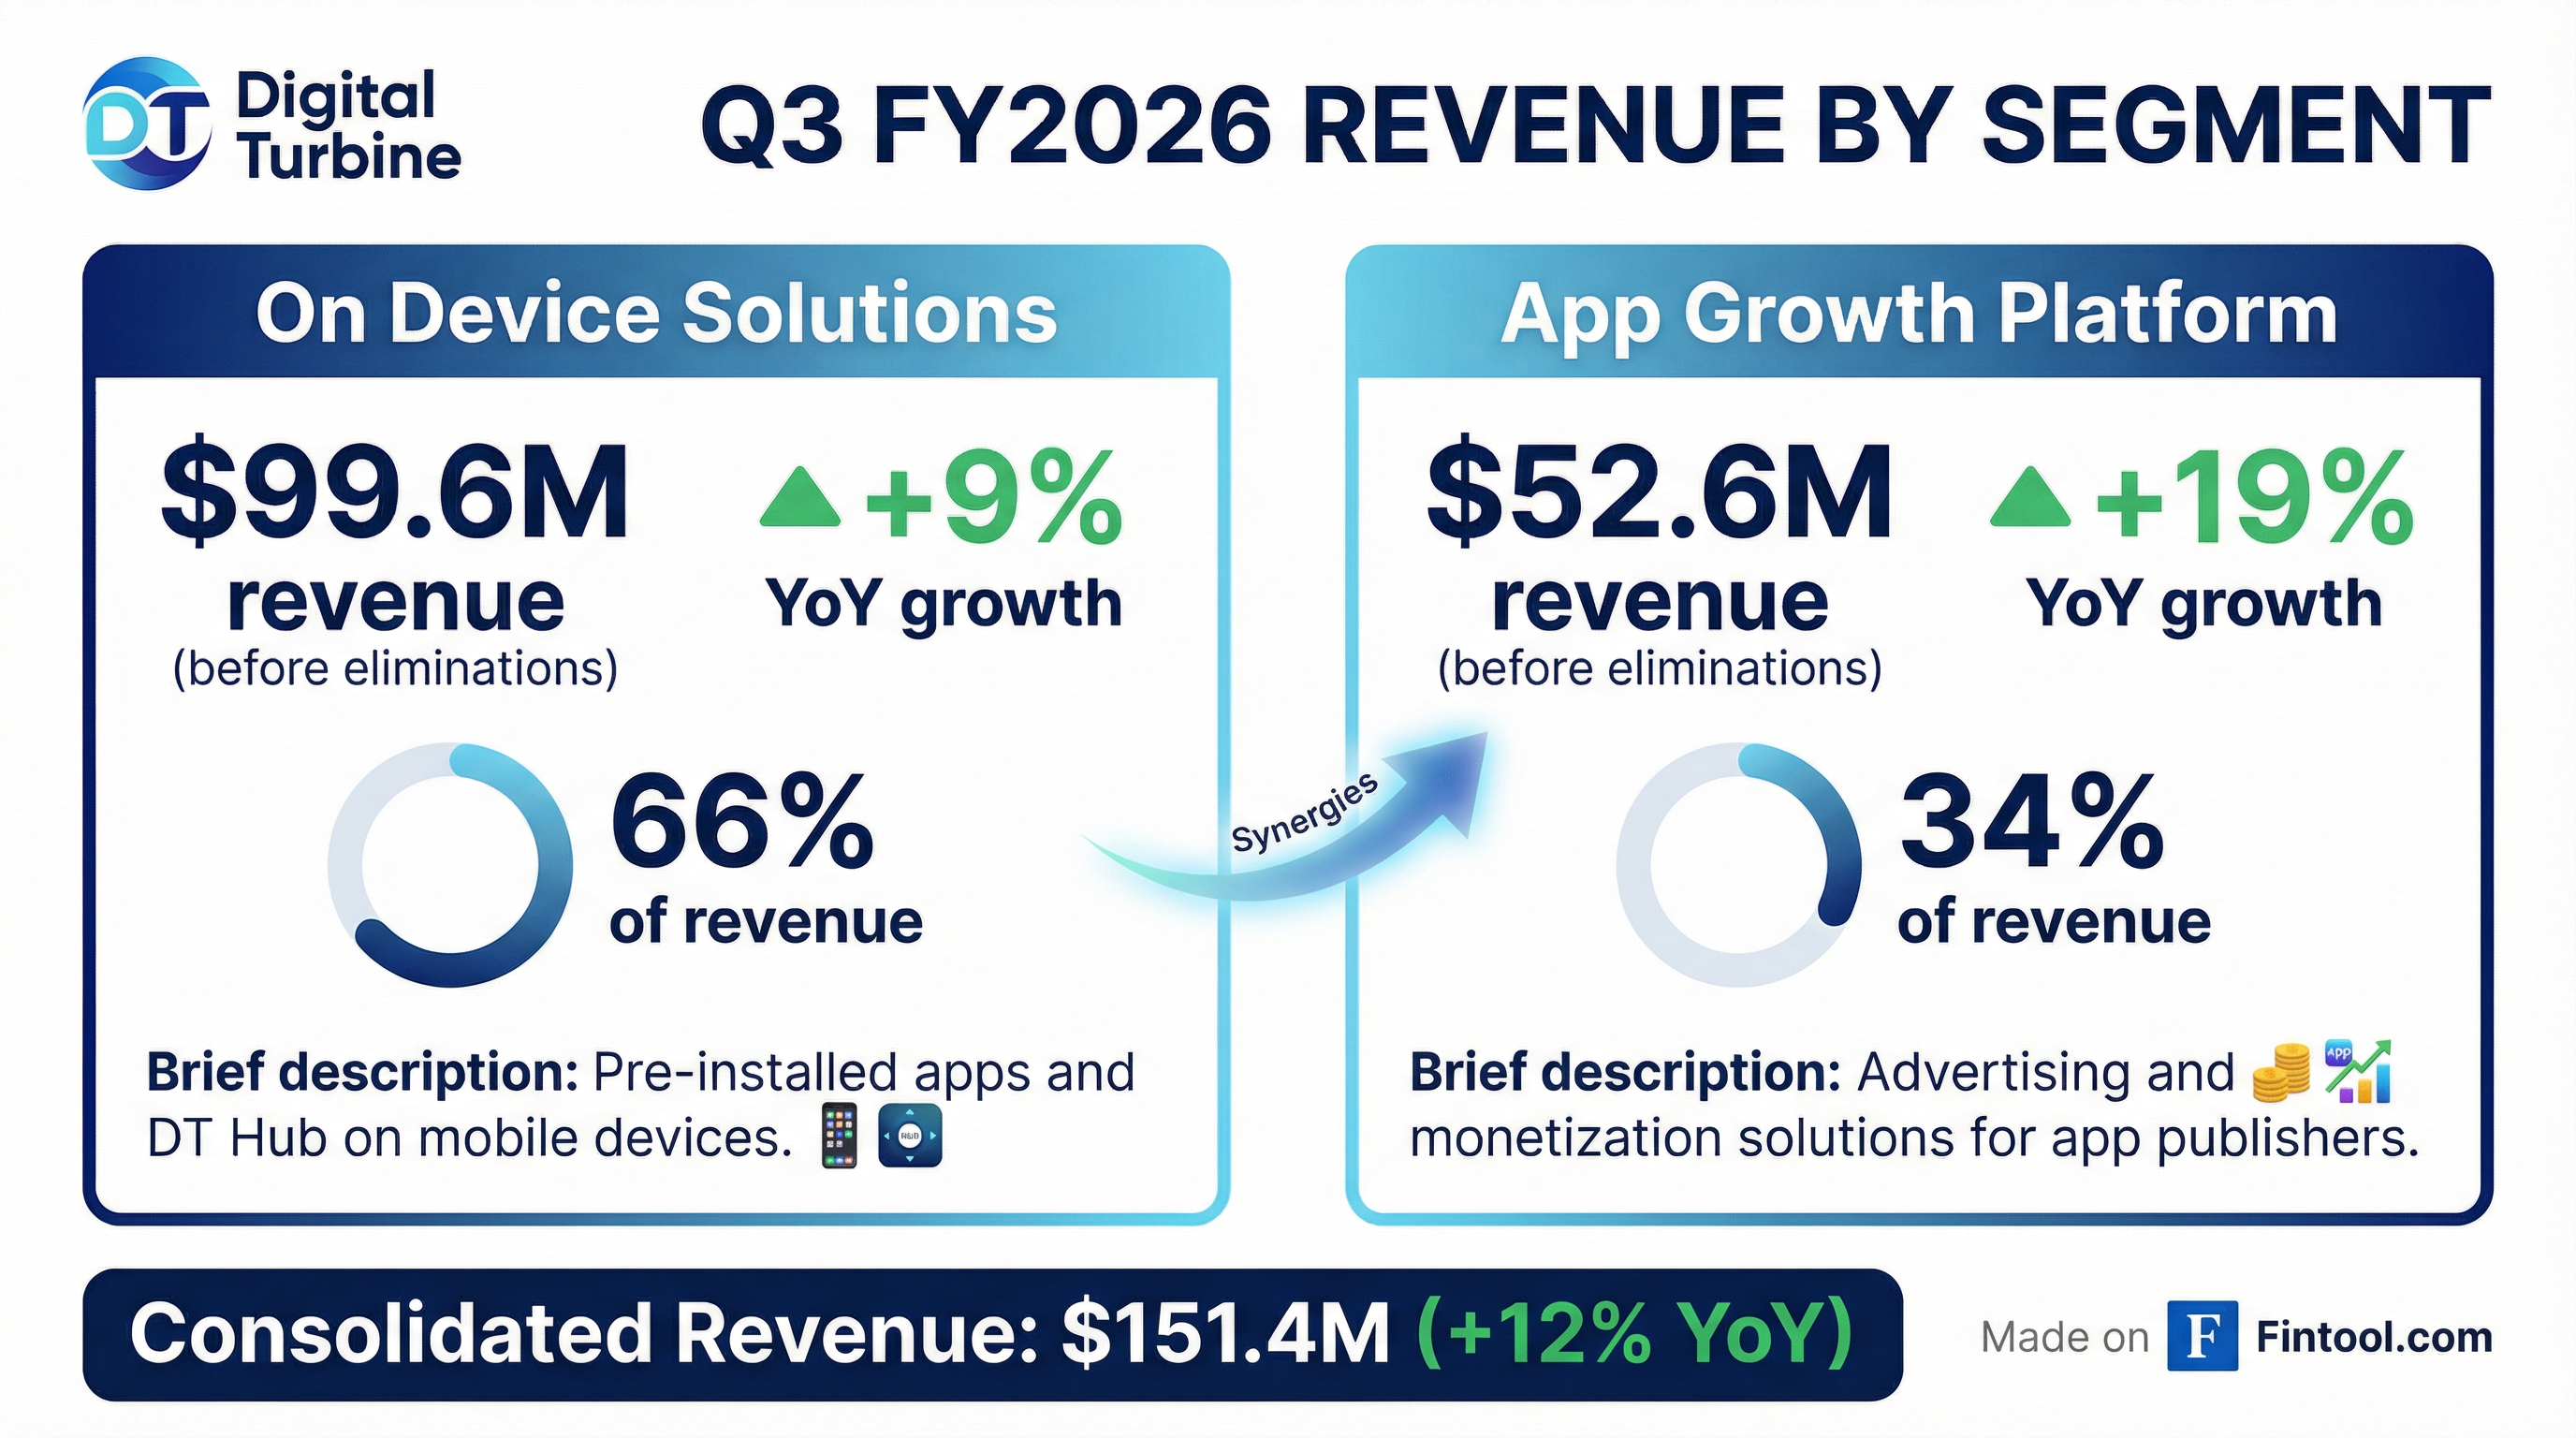
On Device Solutions—Digital Turbine's core pre-installed app business with carriers—showed steady 9% growth driven by international strength. The faster-growing App Growth Platform (advertising and monetization) accelerated to +19% YoY, signaling improving ad demand.
Key segment drivers from the earnings call:
- International surge: ODS international business grew >60% YoY, with >20% increases in both devices and revenue per device
- Geographic diversification milestone: For the first time in company history, more than 30% of Ignite platform revenues came from outside the United States
- AGP supply expansion: Impressions up >20% YoY driven by international growth and strong increases in non-gaming inventory
- Brand business acceleration: Retail vertical had 5x growth compared to last holiday season; CPG, telecom, and technology verticals all increased spend
- DTX/SSP growth: Over 30% growth in the DTX business
What Did Management Guide?
Raised guidance above consensus. Digital Turbine lifted both revenue and EBITDA expectations for FY2026:
The midpoint of revenue guidance ($555.5M) implies ~$122M in Q4, which would represent approximately +2% YoY growth. EBITDA guidance of $115.5M midpoint implies Q4 EBITDA of approximately $29M.
Management noted it's "not reasonably practicable to provide a business outlook for GAAP net income" due to stock-based compensation variability.
How Did the Stock React?
The after-hours spike reversed a weak regular session (-2.2%) and brings APPS to its highest level since early January. The stock remains 31% below its 52-week high of $8.28.*
*Values retrieved from S&P Global.
What Changed From Last Quarter?
This quarter marked a notable inflection in profitability:
The EBITDA margin expansion is remarkable—jumping from 19.4% to 25.6% in a single quarter. CFO Steve Lasher attributed this to several factors:
- Non-GAAP gross margin expanded to 49%, up from 44% in the prior year, driven by more favorable product and segment mix
- Cash operating expenses declined 4% YoY while revenue grew double-digits—demonstrating strong operating leverage
- One-time benefits of ~$3.5M from a sublease settlement and working capital improvements
- This marked the seventh consecutive quarter of EBITDA margin expansion, improving more than 900 basis points vs. the prior year
Multi-quarter profitability turnaround:
*EBITDA margins calculated using S&P Global data.
What Did Management Say?
CEO Bill Stone struck an optimistic tone on the earnings call, highlighting three key themes:
"First is the diversification of our revenues and the double-digit growth across so many of our products and geographies. We are seeing many drivers of our growth versus being tied to a single thing."
"Second is our improving use of AI and machine learning tools, not only in our data and targeting that power revenue, but also for our operations that's driving improved efficiency in our coding, quality assurance, regression timelines, and a variety of other administrative and back-office tasks. As an example... our gross profit dollars increased by more than 25%, while our operating expenses declined."
"And finally is the strong progress we've made in strengthening our balance sheet. Our debt leverage ratio now stands at roughly three turns, down from more than five turns just a year ago."
On the market opportunity:
"The market opportunity in front of us is expanding quickly, as mobile app publishers and advertisers look to capitalize on newly available ways to promote app usage and profitability. Provided that we continue to execute and align our resources effectively to facilitate the evolving demand trends, we are well positioned to capitalize on the wealth of opportunities that lie ahead."
What Are Management's Five Strategic Priorities?
CEO Bill Stone outlined five strategic priorities to pursue the $0.5 trillion market opportunity:
-
Unlocking first-party data value - Leveraging data signals across all DT products to enhance the Ignite graph and apply AI/ML models for better outcomes
-
Building the flywheel effect - With 80,000+ applications integrated with DT's ad monetization technology, leveraging demand-side tech to acquire more users creates a "flywheel effect of increased monetization and higher investment into our platform"
-
Scaling the brand business - The brand and agency-facing business diversifies monetization; it's showing positive growth and is "key to the next phase of our growth"
-
Expanding Ignite platform services - Leveraging the 500+ million device footprint to unlock better monetization and superior user experience for carrier and OEM partners
-
Alternative app distribution opportunity - Management believes "the app economy is entering an era of democratization beyond the traditional duopoly." Three of the largest global mobile game developers signed in December quarter and are now using SingleTap capabilities—they're already live and generating revenue today
What Were the Q&A Highlights?
On the flywheel strategy:
"This is one of our five strategic priorities in the business, and there's enormous opportunity given that we have over 80,000 different applications with our technology... the ability for us to integrate their budgets that we're paying them back into acquiring users, both with our own DSP as well as our on-device business, then feeds back into the monetization."
On Google Gemini/AI impact:
"I think it's a great thing for our company... We're not in the game business—we don't make games, we distribute them. And so as more games come into the market, they're all gonna need distribution."
On the three largest gaming companies signing SingleTap:
"They're live today... They're using it to distribute alternative applications or their own versions that can be their own house billing versus using one of the duopoly's billing. They're also using it for a thing called dual downloads—the ability to download an application with SingleTap, but also download the store that goes with that."
On competitive positioning (2x market growth):
"The overall market grew kind of mid- to high-single digits in the December quarter, and our growth on the AGP side was 20%. So in other words, our growth is 2x the market. We're out taking share."
Balance Sheet & Cash Flow
Notable developments:
- Leverage dramatically improved: Debt leverage ratio now stands at roughly 3x, down from more than 5x just a year ago
- Debt paydown: Total debt declined by >$41M in the quarter to $355M, driven by positive cash flow and ATM proceeds
- ATM offering executed and terminated: Sold 6.8M shares at average price of $6.54 for $44.6M gross proceeds, then terminated the at-the-market equity program as management believes "current liquidity and balance sheet strength eliminates the need for this funding source"
- Free cash flow: $6.4M in Q3 FY26
- One-time benefits: Q3 included approximately $3.5M of one-time benefits primarily related to a sublease settlement and improved working capital
Key Risks Highlighted
Management flagged several risk factors in the filing:
-
Customer concentration: "A significant portion of our revenue is derived from a limited number of wireless carriers and customers"
-
Global operations: Exposed to "added business, political, regulatory, legal, operational, financial and economic risks" from international operations
-
Industry disruption: "Wireless technologies are changing rapidly, and we may not be successful in working with these new technologies"
-
Tariff exposure: "Risk related to the geopolitical relationship between the U.S. and China or changes in China's economic and regulatory landscape, including recent tariff increases and trade tensions"
Forward Catalysts
- Q4 FY26 earnings: Implied ~$122M revenue and ~$29M EBITDA based on raised guidance
- Debt management: Continued deleveraging with $355M in total debt remaining
- Carrier partnerships: Expansion of On Device Solutions with new carrier agreements
- Advertising demand: Mobile advertising market recovery as App Growth Platform accelerates