AVNET (AVT)·Q2 2026 Earnings Summary
Avnet Beats and Raises: Asia Hits Record Revenues, Stock Jumps 6%
January 28, 2026 · by Fintool AI Agent
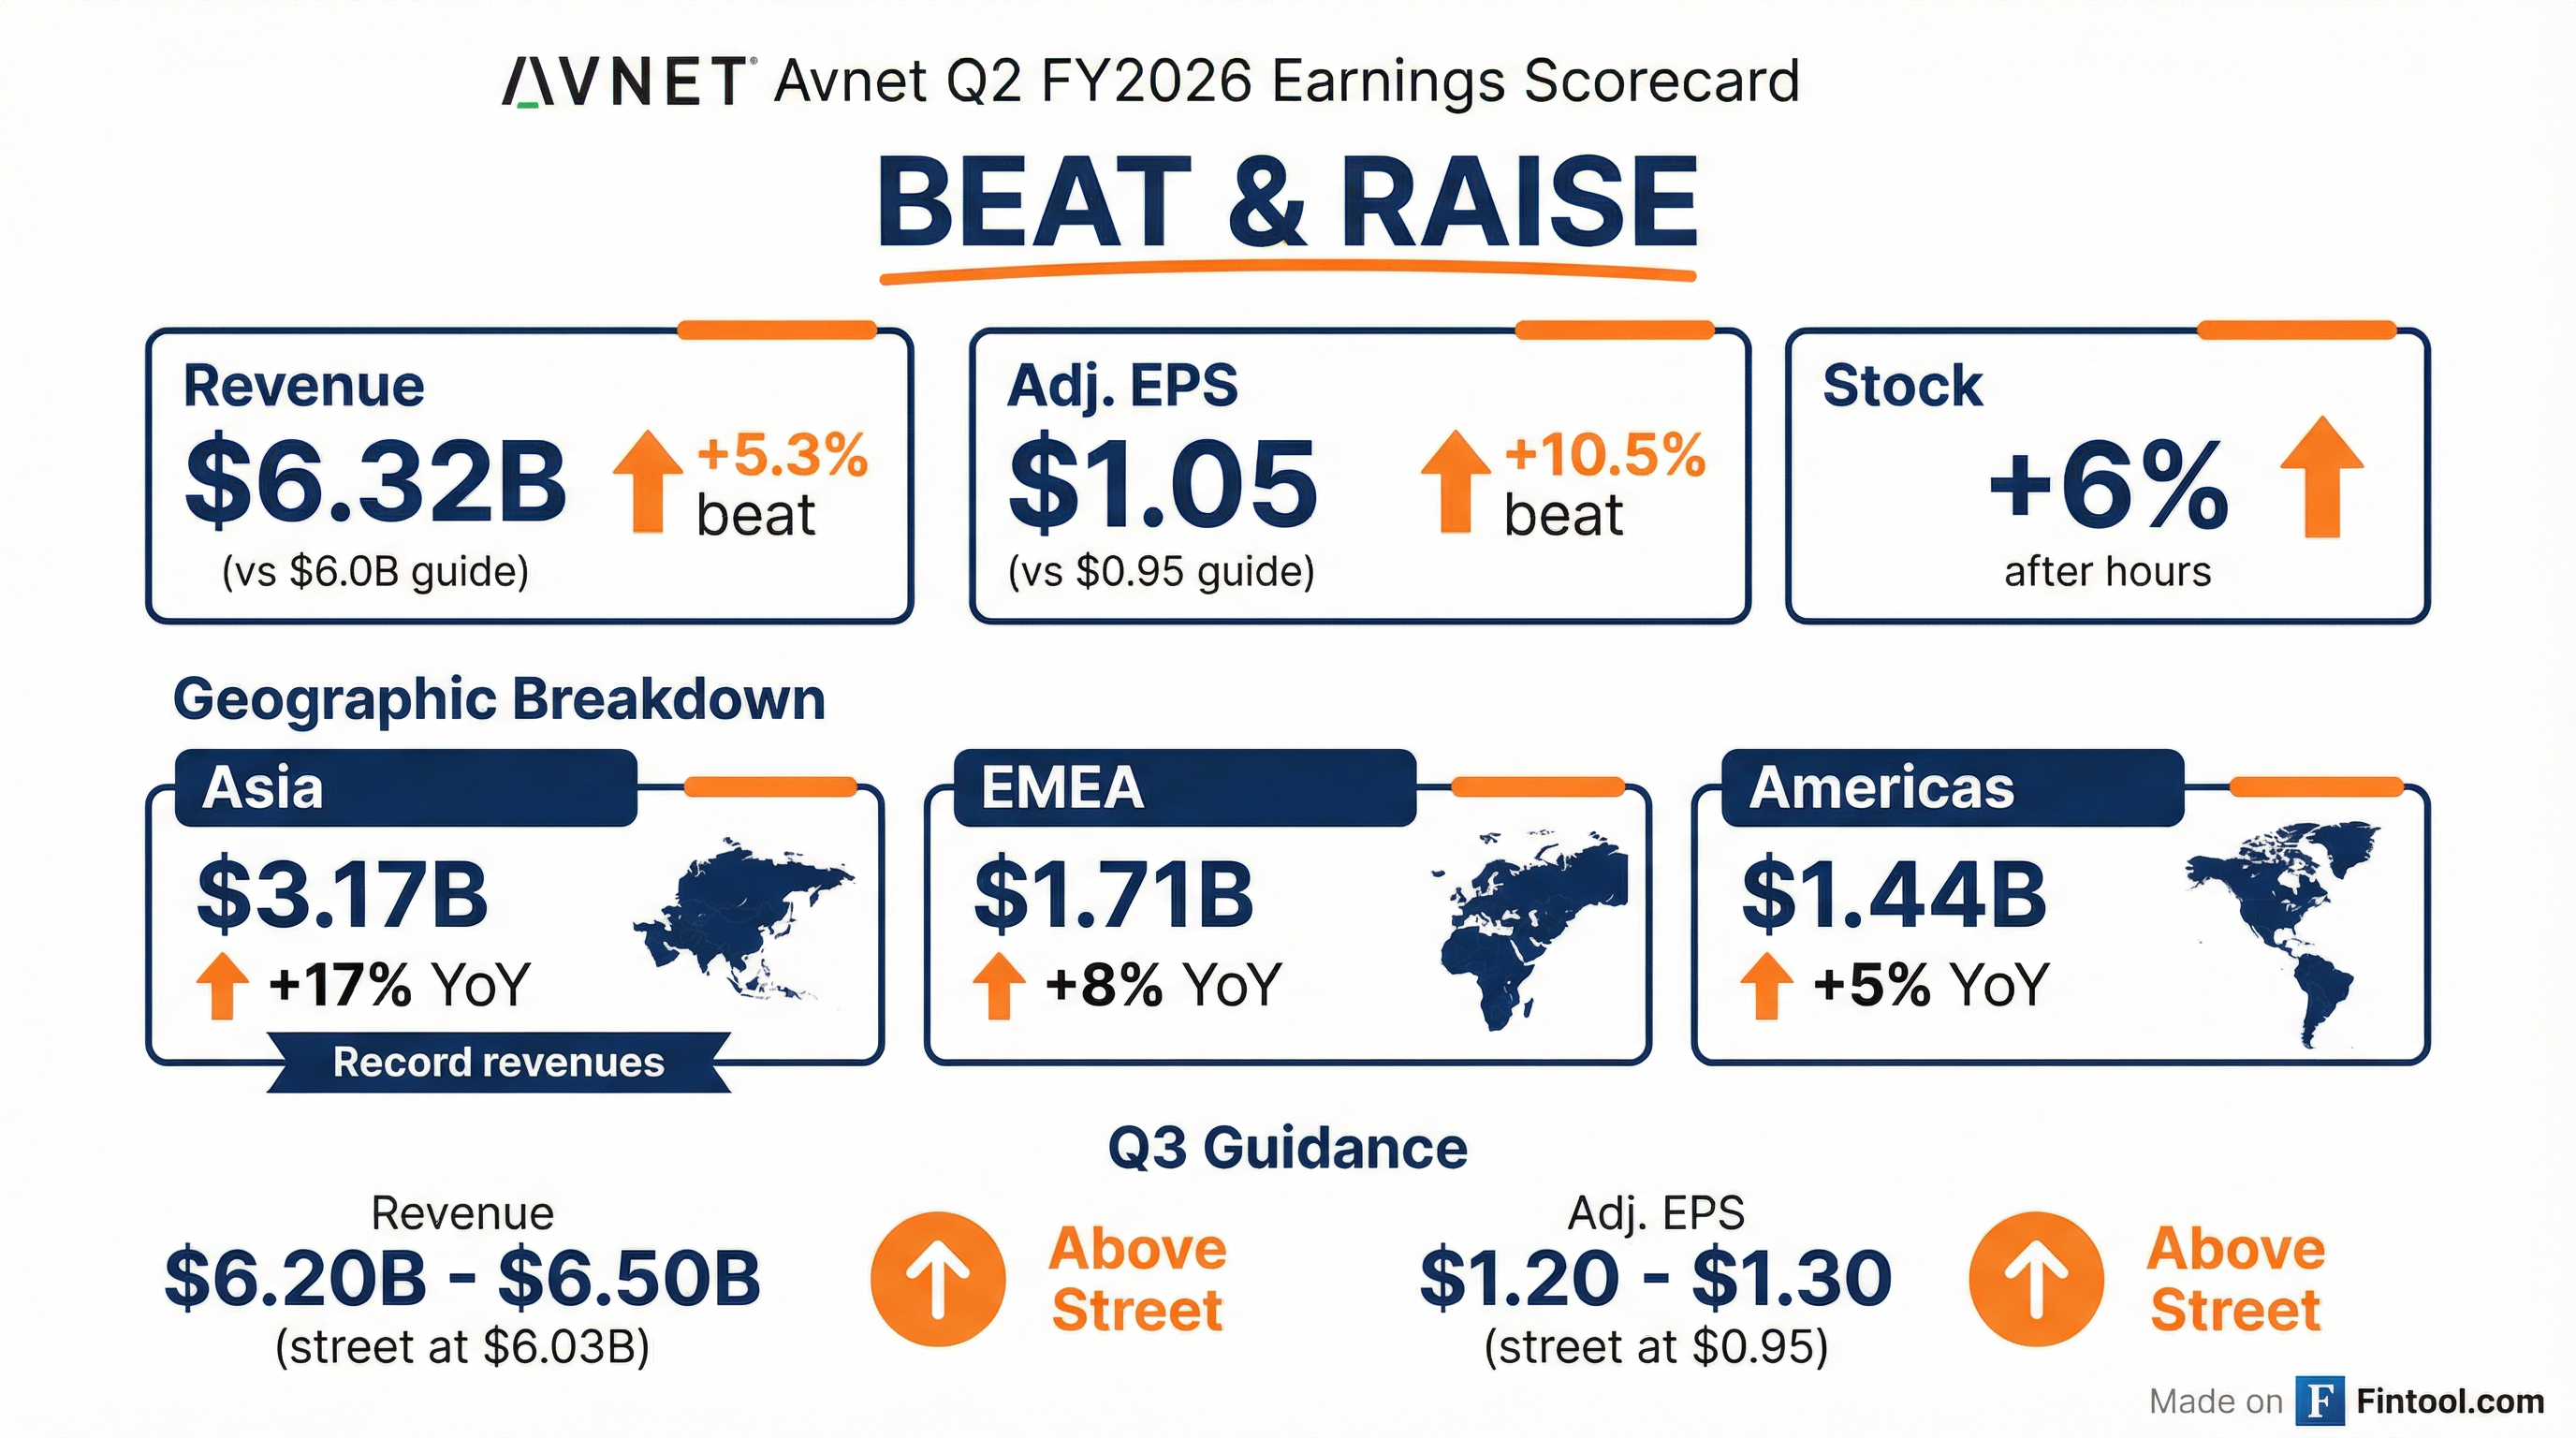
Avnet (NASDAQ: AVT) delivered a clean beat-and-raise quarter, with Q2 FY2026 results exceeding guidance on both the top and bottom line. Revenue of $6.32B topped the high end of guidance by $169M, while adjusted EPS of $1.05 cleared the $1.00 ceiling by 5%. The stock surged ~6% in after-hours trading as management issued Q3 guidance well above street expectations.
The highlight: Asia posted record quarterly revenues of $3.2B, marking the sixth consecutive quarter of year-over-year growth in the region. All three geographic segments delivered positive YoY growth for the first time in several quarters, signaling a broad-based recovery in the electronic components distribution market.
Did Avnet Beat Earnings?
Yes — decisively. Both revenue and adjusted EPS exceeded the high end of management's guidance range.
Year-over-year comparisons were equally strong:
Sequential momentum was even more impressive — adjusted diluted EPS grew nearly four times faster than sales quarter-over-quarter, demonstrating the operating leverage management has been highlighting.
What Did Management Guide?
Q3 FY2026 guidance came in significantly above street expectations:
*Values retrieved from S&P Global
The guidance implies better-than-typical seasonal sequential sales growth of approximately 1% at the midpoint, despite the Lunar New Year holiday impact on Asia. Management expects sales growth in the Americas and EMEA, with a less-than-typical seasonal decline in Asia.
Key guidance assumptions include:
- Similar interest expense to Q2 FY2026
- Adjusted effective tax rate of 21%-25%
- 83 million average diluted shares outstanding
- Euro at $1.16 / GBP at $1.34
What Changed From Last Quarter?
Several notable shifts from Q1 FY2026:
1. All Regions Growing YoY — For the first time in multiple quarters, all three geographic segments posted positive year-over-year growth simultaneously:
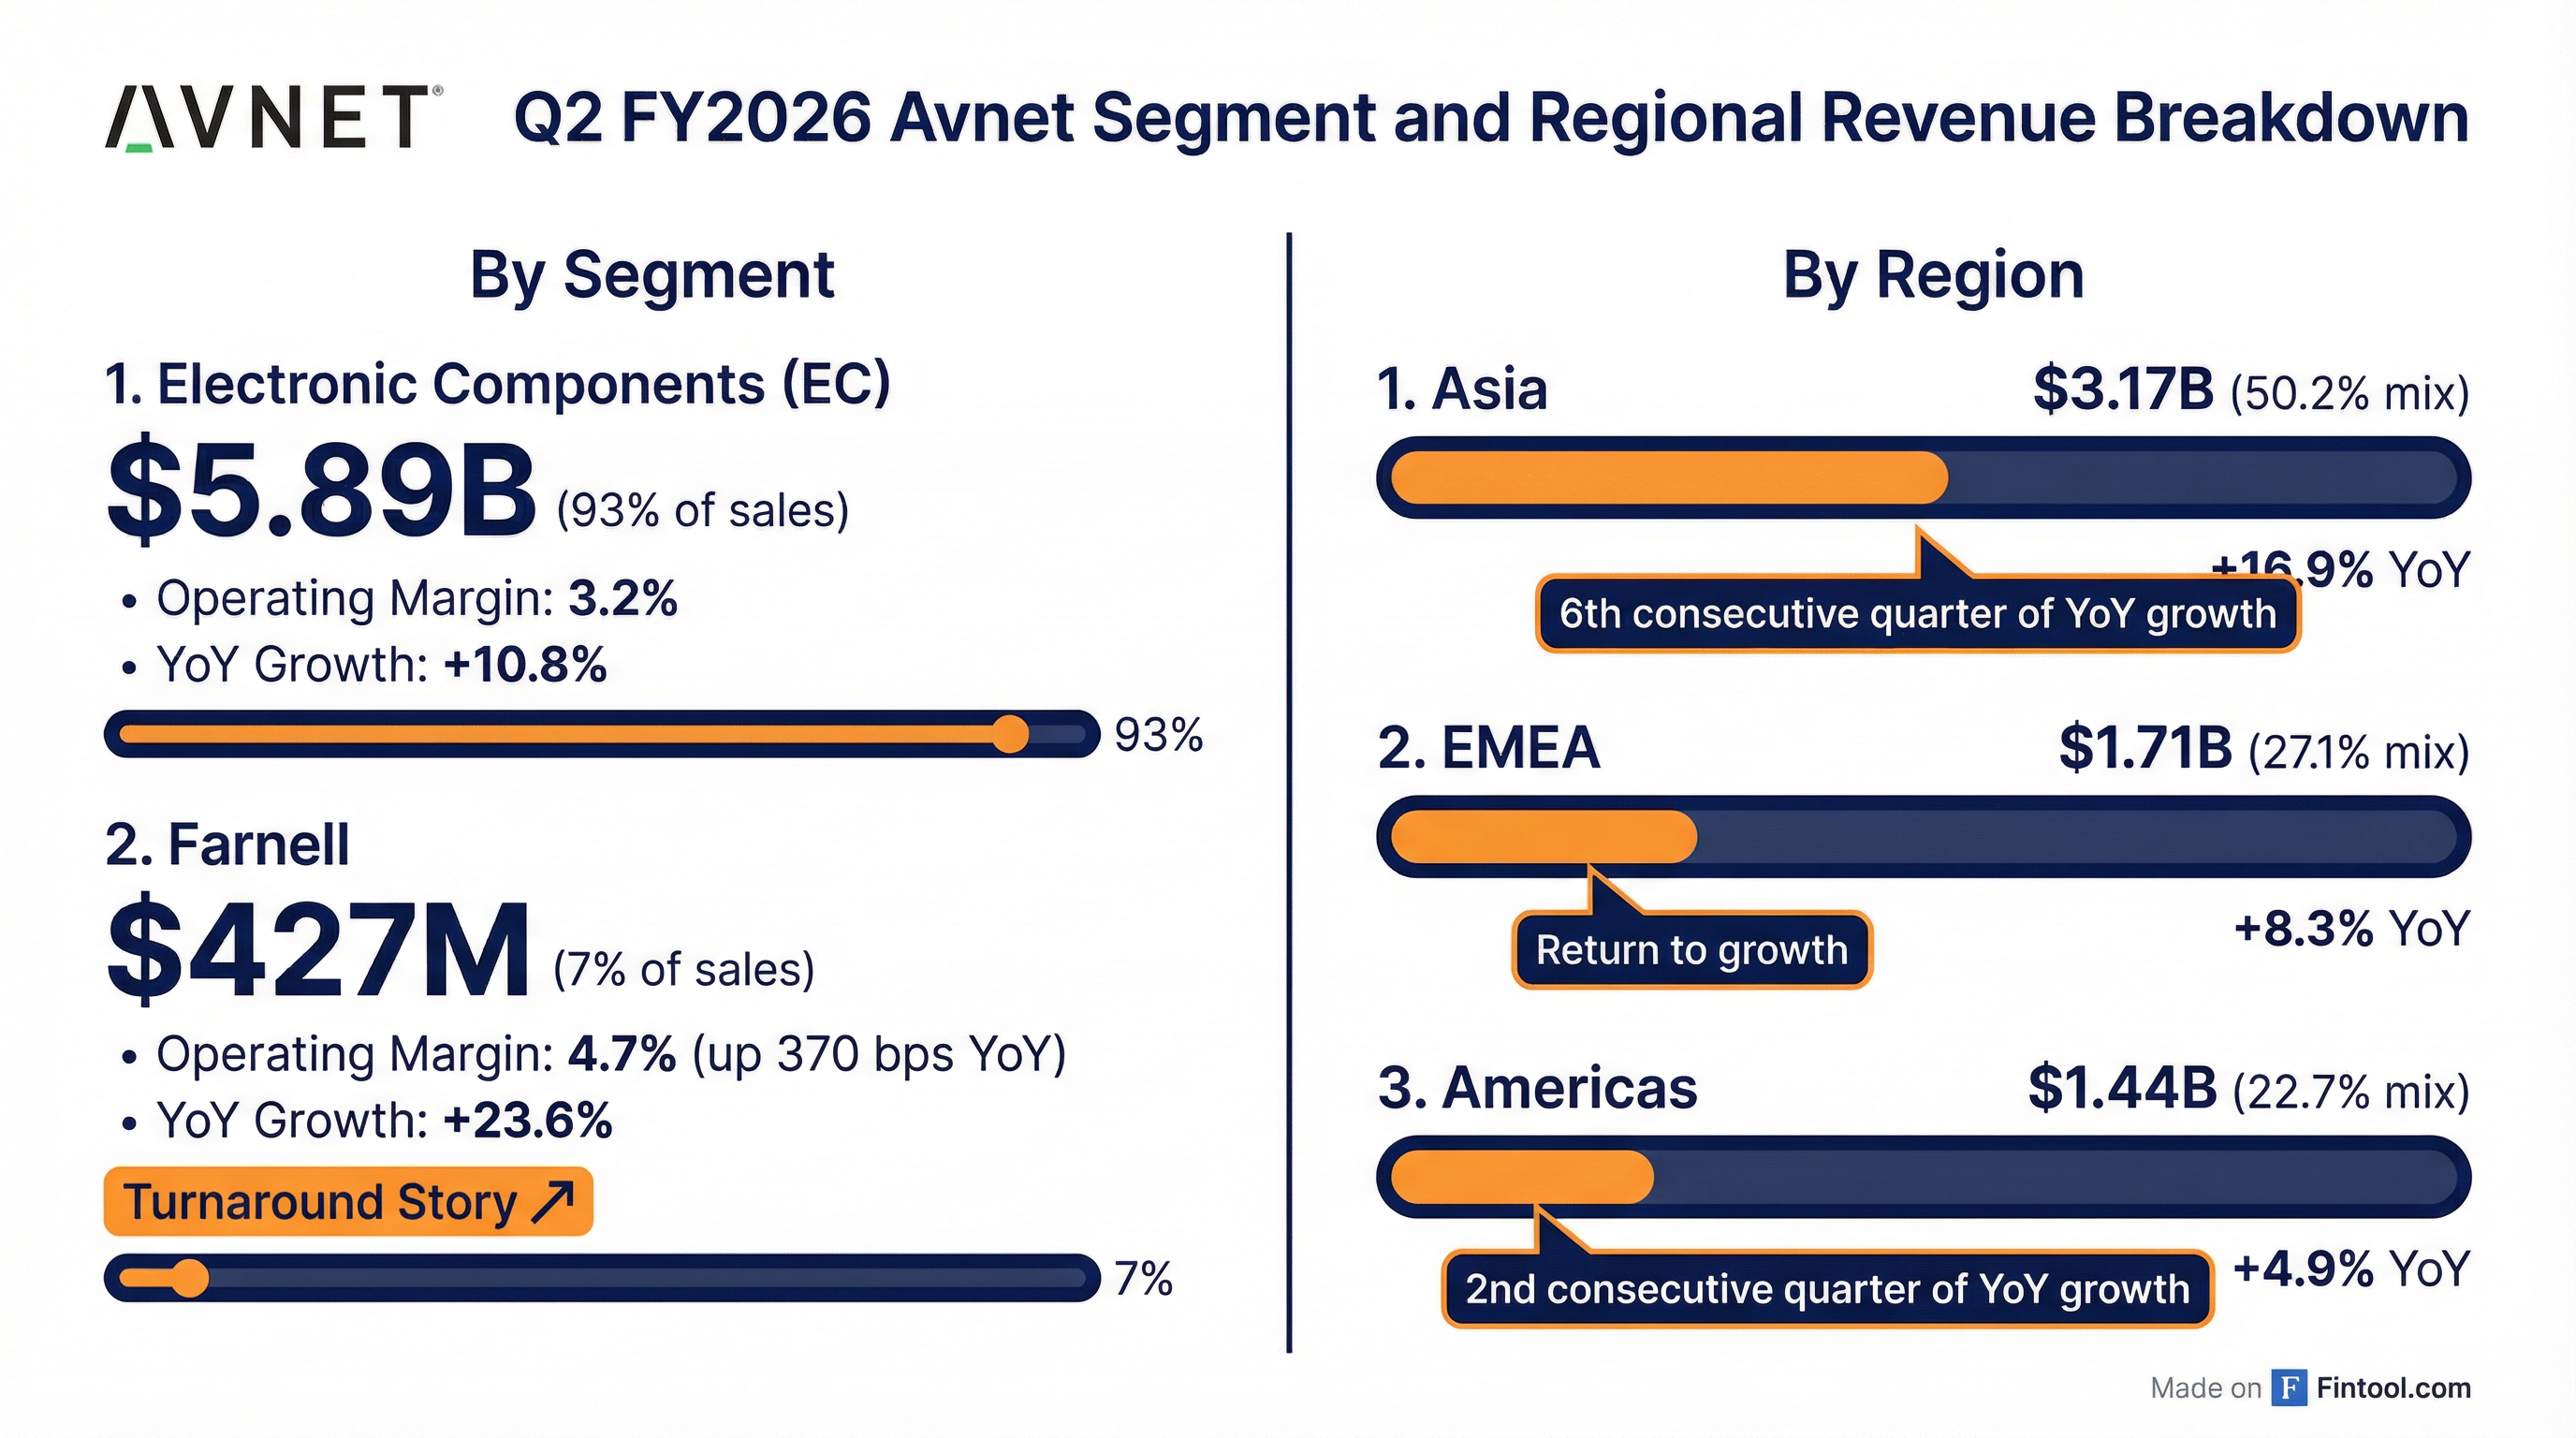
- Asia: +16.9% YoY (6th consecutive quarter of YoY growth)
- EMEA: +8.3% YoY (return to growth after several flat/negative quarters)
- Americas: +4.9% YoY (2nd consecutive quarter of YoY growth)
2. Farnell Turnaround Accelerating — The Farnell segment delivered 23.6% YoY revenue growth with operating margin expanding 367 bps to 4.7% (vs. 1.0% a year ago).
3. Inventory Optimization Progress — Days of inventory dropped to 86 days, with the EC business specifically falling below 80 days. Inventory reduced by $126M in the quarter.
4. Cash Generation Resumed — After a negative cash flow quarter in Q1 FY2026 due to working capital build for growth, the company generated $208M of operating cash flow in Q2.
What Did Phil Gallagher Say?
CEO Phil Gallagher struck an optimistic tone, emphasizing both the beat-and-raise results and the operating leverage story:
"We delivered year-over-year sales growth across all of our Electronic Components regions and Farnell, and both total Company revenue and earnings per share were above our expectations. Sequentially, our adjusted operating income grew two times faster than sales, demonstrating the expected leverage in our business model."
On the outlook:
"Our team's continued commitment to optimizing inventory and driving operational excellence also enabled us to generate operating cash flow and reduce days of inventory this quarter. The trends we see are encouraging, and our third quarter outlook implies above-trend seasonal growth and improving margins."
In the Q1 FY2026 earnings call, Gallagher highlighted data center and AI opportunities as a growing tailwind, noting exposure to hyperscalers at roughly 7% of Asia sales, with particular strength in storage, connectivity, power, and cooling components.
How Did the Stock React?
AVT shares responded positively to the results:
The after-hours move of +6% reflects the market's positive reception to both the beat and the raised guidance. The stock had been trading in the $48-53 range for most of the past quarter.
Over the past 8 quarters, AVT has beaten adjusted EPS estimates in 6 quarters, with Q2 FY2026 representing one of the largest beats (+10.5% vs. guidance midpoint).
Segment Performance Deep Dive
Electronic Components (EC) — 93% of Sales
EC operating margin improved 28 bps sequentially from Q1 FY2026's 2.9%, even as the regional mix continued to shift toward lower-margin Asia (now 50.2% of total sales).
Farnell — 7% of Sales
Farnell's turnaround is accelerating. The segment marked its third consecutive quarter of YoY revenue growth, with operating margin expanding dramatically from the 1% level a year ago to 4.7% this quarter — the highest operating margin Farnell has achieved since fiscal 2023. This reflects improved product mix toward higher-margin on-the-board components (semiconductors and IP&E) and better cost management. Management is targeting approximately 50 bps of sequential margin improvement per quarter, with an ultimate goal of returning to double-digit operating margins.
Capital Allocation
Management reiterated its commitment to reducing leverage toward 3.0x over the next year (from 4.0x at end of Q1 FY2026). The company has increased its dividend for 12 consecutive fiscal years.
Q&A Highlights: What Analysts Asked
On Order Linearity and Backlog Visibility — William Stein (Truist) asked about order patterns during the quarter. CEO Phil Gallagher noted that bookings were strong in October and November before trailing off in mid-December as typical for the holiday period. Importantly, book-to-bills remained positive even on top of a strong billing quarter.
"The drop in orders inside of lead time from customers is increasing or expedites are increasing. What that tells us... is inventories are depleting... customers weren't pipelining and giving us enough visibility. And then when they go to their manufacturer, boom, they're coming in with drop-in inside... a quote, book, ship, bill inside the 90 days."
Management confirmed visibility is improving but "still probably not at the level we would like to see it."
On Pricing Trends — Joe Quattrocchi (Wells Fargo) probed pricing dynamics. CFO Ken Jacobson clarified that while price increases have been announced, the actual Q2 results didn't reflect significant pricing impact yet.
"We've seen the increases announced, and we know they're coming, right? But the actual quarterly results didn't have a lot of impact from actual price increases in the quarter."
Product categories seeing price pressures include: memory, storage, controllers, high-end networking products, and select IP&E components like antennas and capacitors — driven largely by data center and hyperscaler demand.
On Operating Margin Expansion — Ruplu Bhattacharya (Bank of America) asked about the path to margin improvement. Management highlighted that the Western regions are the "operating leverage horses" for profitability, with significant runway remaining:
- Americas: Still 20%-25% below historical peak revenues
- Europe: Still 30%-35% below historical peak revenues
As these regions continue recovering, operating margin expansion should follow.
On Farnell's Margin Path — When asked about Farnell's margin trajectory, Gallagher committed to approximately 50 basis points of operating margin improvement per quarter, with potential acceleration if Europe recovers faster:
"We need to see them and expect them to continue to show incremental improvement in operating margin... we would really like to see them accelerate that and beyond 50-100 basis points. So that's our commitment at this point in time... we do see it as a continuing tailwind... and we will look to accelerate getting to that double-digit operating margin."
Key Risks and Concerns
1. Margin Pressure from Geographic Mix — Asia now represents 50.2% of total sales, up from 47.9% a year ago. Asia carries lower margins than Western regions, creating structural headwinds for blended margins.
2. Gross Margin Compression — Consolidated gross margin declined to 10.5% from 10.5% a year ago, with EC gross margin down 25 bps YoY to 9.3%.
3. Geopolitical and Trade Risk — As a global distributor with significant Asia exposure, Avnet faces risks from tariffs, trade restrictions, and supply chain disruptions.
4. Customer Concentration in Asia Hyperscalers — The data center/AI opportunity, while growing, exposes the company to demand volatility from hyperscale customers.
Forward Catalysts
Near-term:
- Q3 FY2026 earnings (late April/early May 2026)
- Lunar New Year impact on Q3 Asia demand
- EMEA recovery trajectory
- Data center and AI component demand trends
Longer-term:
- Continued Farnell margin expansion
- Inventory optimization driving improved cash conversion
- Deleveraging progress toward 3.0x target
- Edge AI and downstream application buildout beyond hyperscalers
Key Takeaways
- Beat-and-raise quarter — Revenue +5.3% above guidance midpoint, adjusted EPS +10.5% above midpoint
- Asia record — 6th consecutive quarter of YoY growth with record $3.2B in quarterly revenues
- All regions growing — First time in multiple quarters with positive YoY growth across all three regions
- Farnell turnaround — Operating margin expanded 367 bps YoY to 4.7%, highest since FY2023; targeting double-digit margins
- Q3 guidance well above street — Revenue midpoint 5.3% above consensus, EPS midpoint 31% above
- Operating leverage — Adjusted operating income grew 2x faster than sales sequentially
- Cash generation resumed — $208M operating cash flow, inventory down $126M
- Pricing tailwinds emerging — Price increases announced in memory, storage, and controllers; impact expected in coming quarters
- West recovery runway — Americas still 20-25% below peak, Europe 30-35% below peak — significant margin expansion potential ahead
Related: