Earnings summaries and quarterly performance for FRANKLIN RESOURCES.
Research analysts who have asked questions during FRANKLIN RESOURCES earnings calls.
Michael Cyprys
Morgan Stanley
6 questions for BEN
William Katz
TD Cowen
6 questions for BEN
Alexander Blostein
Goldman Sachs
5 questions for BEN
Benjamin Budish
Barclays PLC
5 questions for BEN
Daniel Fannon
Jefferies Financial Group Inc.
5 questions for BEN
Glenn Schorr
Evercore ISI
4 questions for BEN
Patrick Davitt
Autonomous Research
4 questions for BEN
Brennan Hawken
UBS Group AG
3 questions for BEN
Craig Siegenthaler
Bank of America
3 questions for BEN
Kenneth Worthington
JPMorgan Chase & Co.
3 questions for BEN
Brian Bedell
Deutsche Bank
2 questions for BEN
Dan Fannon
Jefferies & Company Inc.
1 question for BEN
John Dunn
Evercore ISI
1 question for BEN
Recent press releases and 8-K filings for BEN.
- Franklin Resources reported preliminary total AUM of $1.707 trillion at January 31, 2026, up from $1.684 trillion at December 31, 2025.
- Preliminary long-term net inflows were $1.5 billion, inclusive of $1.5 billion net outflows at Western Asset Management; excluding Western Asset, net inflows were $3 billion.
- AUM by major asset class as of January 31, 2026: Equity $709.2 billion, Fixed Income $440.1 billion, Alternatives $276.2 billion, Multi-Asset $205.3 billion.
- Western Asset Management AUM stood at $216 billion on January 31, 2026, slightly down from $217 billion at December 31, 2025.
- At the FY 2026 annual stockholder meeting, all director nominees were elected, PricewaterhouseCoopers was ratified as auditor for FY 2026, amendments to the 1998 ESIP (+5 million shares) and 2002 Stock Incentive Plan (+25 million shares) were approved, and executive compensation received advisory approval.
- CEO Jenny Johnson reported $1.66 trillion in AUM as of September 30, 2025, with long-term flows up 7.8% to $343.9 billion, net inflows of $44.5 billion excluding Western Asset, and eight consecutive quarters of positive long-term flows.
- Franklin Templeton’s alternative AUM reached $270 billion post-Apera acquisition; Canvas custom-indexing AUM tripled since 2023, and ETF AUM grew at a 74% CAGR with 14 funds exceeding $1 billion each.
- CFO Matthew Nicholls reported fiscal 2025 adjusted operating revenues of $6.7 billion, adjusted operating income of $1.64 billion (24.5% margin), $365 million in performance fees, and $930 million returned to shareholders via dividends and buybacks.
- Shareholders approved all proposals, including the election of directors, ratification of PricewaterhouseCoopers as auditor, amendments to the 1998 Employee Stock Investment Plan (+5 million shares) and 2002 Universal Stock Incentive Plan (+25 million shares), and an advisory vote on executive compensation.
- Fiscal year 2025 ending assets under management were $1.66 trillion, with long-term flows of $343.9 billion and net outflows of $97.4 billion (net inflows ex-Western Asset of $44.5 billion).
- Alternatives and multi-asset strategies saw net inflows of $25.7 billion; retail SMAs, ETFs, and the Canvas custom indexing platform delivered double-digit AUM growth, with ETFs growing at a 74% CAGR since 2023 and 14 ETFs exceeding $1 billion in AUM.
- Adjusted operating revenues for FY 2025 were $6.7 billion (+2%), adjusted operating income was $1.64 billion, and adjusted operating margin was 24.5%; the firm returned $930 million to shareholders via dividends and share repurchases.
- Co-investments in seed capital increased to $2.8 billion (from $2.4 billion), and the company repaid $400 million of senior notes due March 2025, reinforcing its balance-sheet flexibility.
- All AGM proposals were approved: directors elected, PricewaterhouseCoopers ratified as auditor, ESIP and USIP share increases authorized, and executive compensation approved on an advisory basis .
- Assets under management ended at $1.66 trillion (Sep 30, 2025); long-term flows rose 7.8% to $343.9 billion, with net outflows of $97.4 billion or $44.5 billion in net inflows excluding Western Asset .
- Business growth in high-margin segments: alternative AUM reached $270 billion, Canvas platform AUM has tripled since 2023 (82% CAGR), and ETF AUM grew at a 74% CAGR with 16 consecutive quarters of inflows and 14 ETFs exceeding $1 billion .
- Fiscal 2025 adjusted operating revenues were $6.7 billion (+2%), adjusted operating income $1.64 billion (24.5% margin), and $930 million returned to shareholders via dividends and share repurchases .
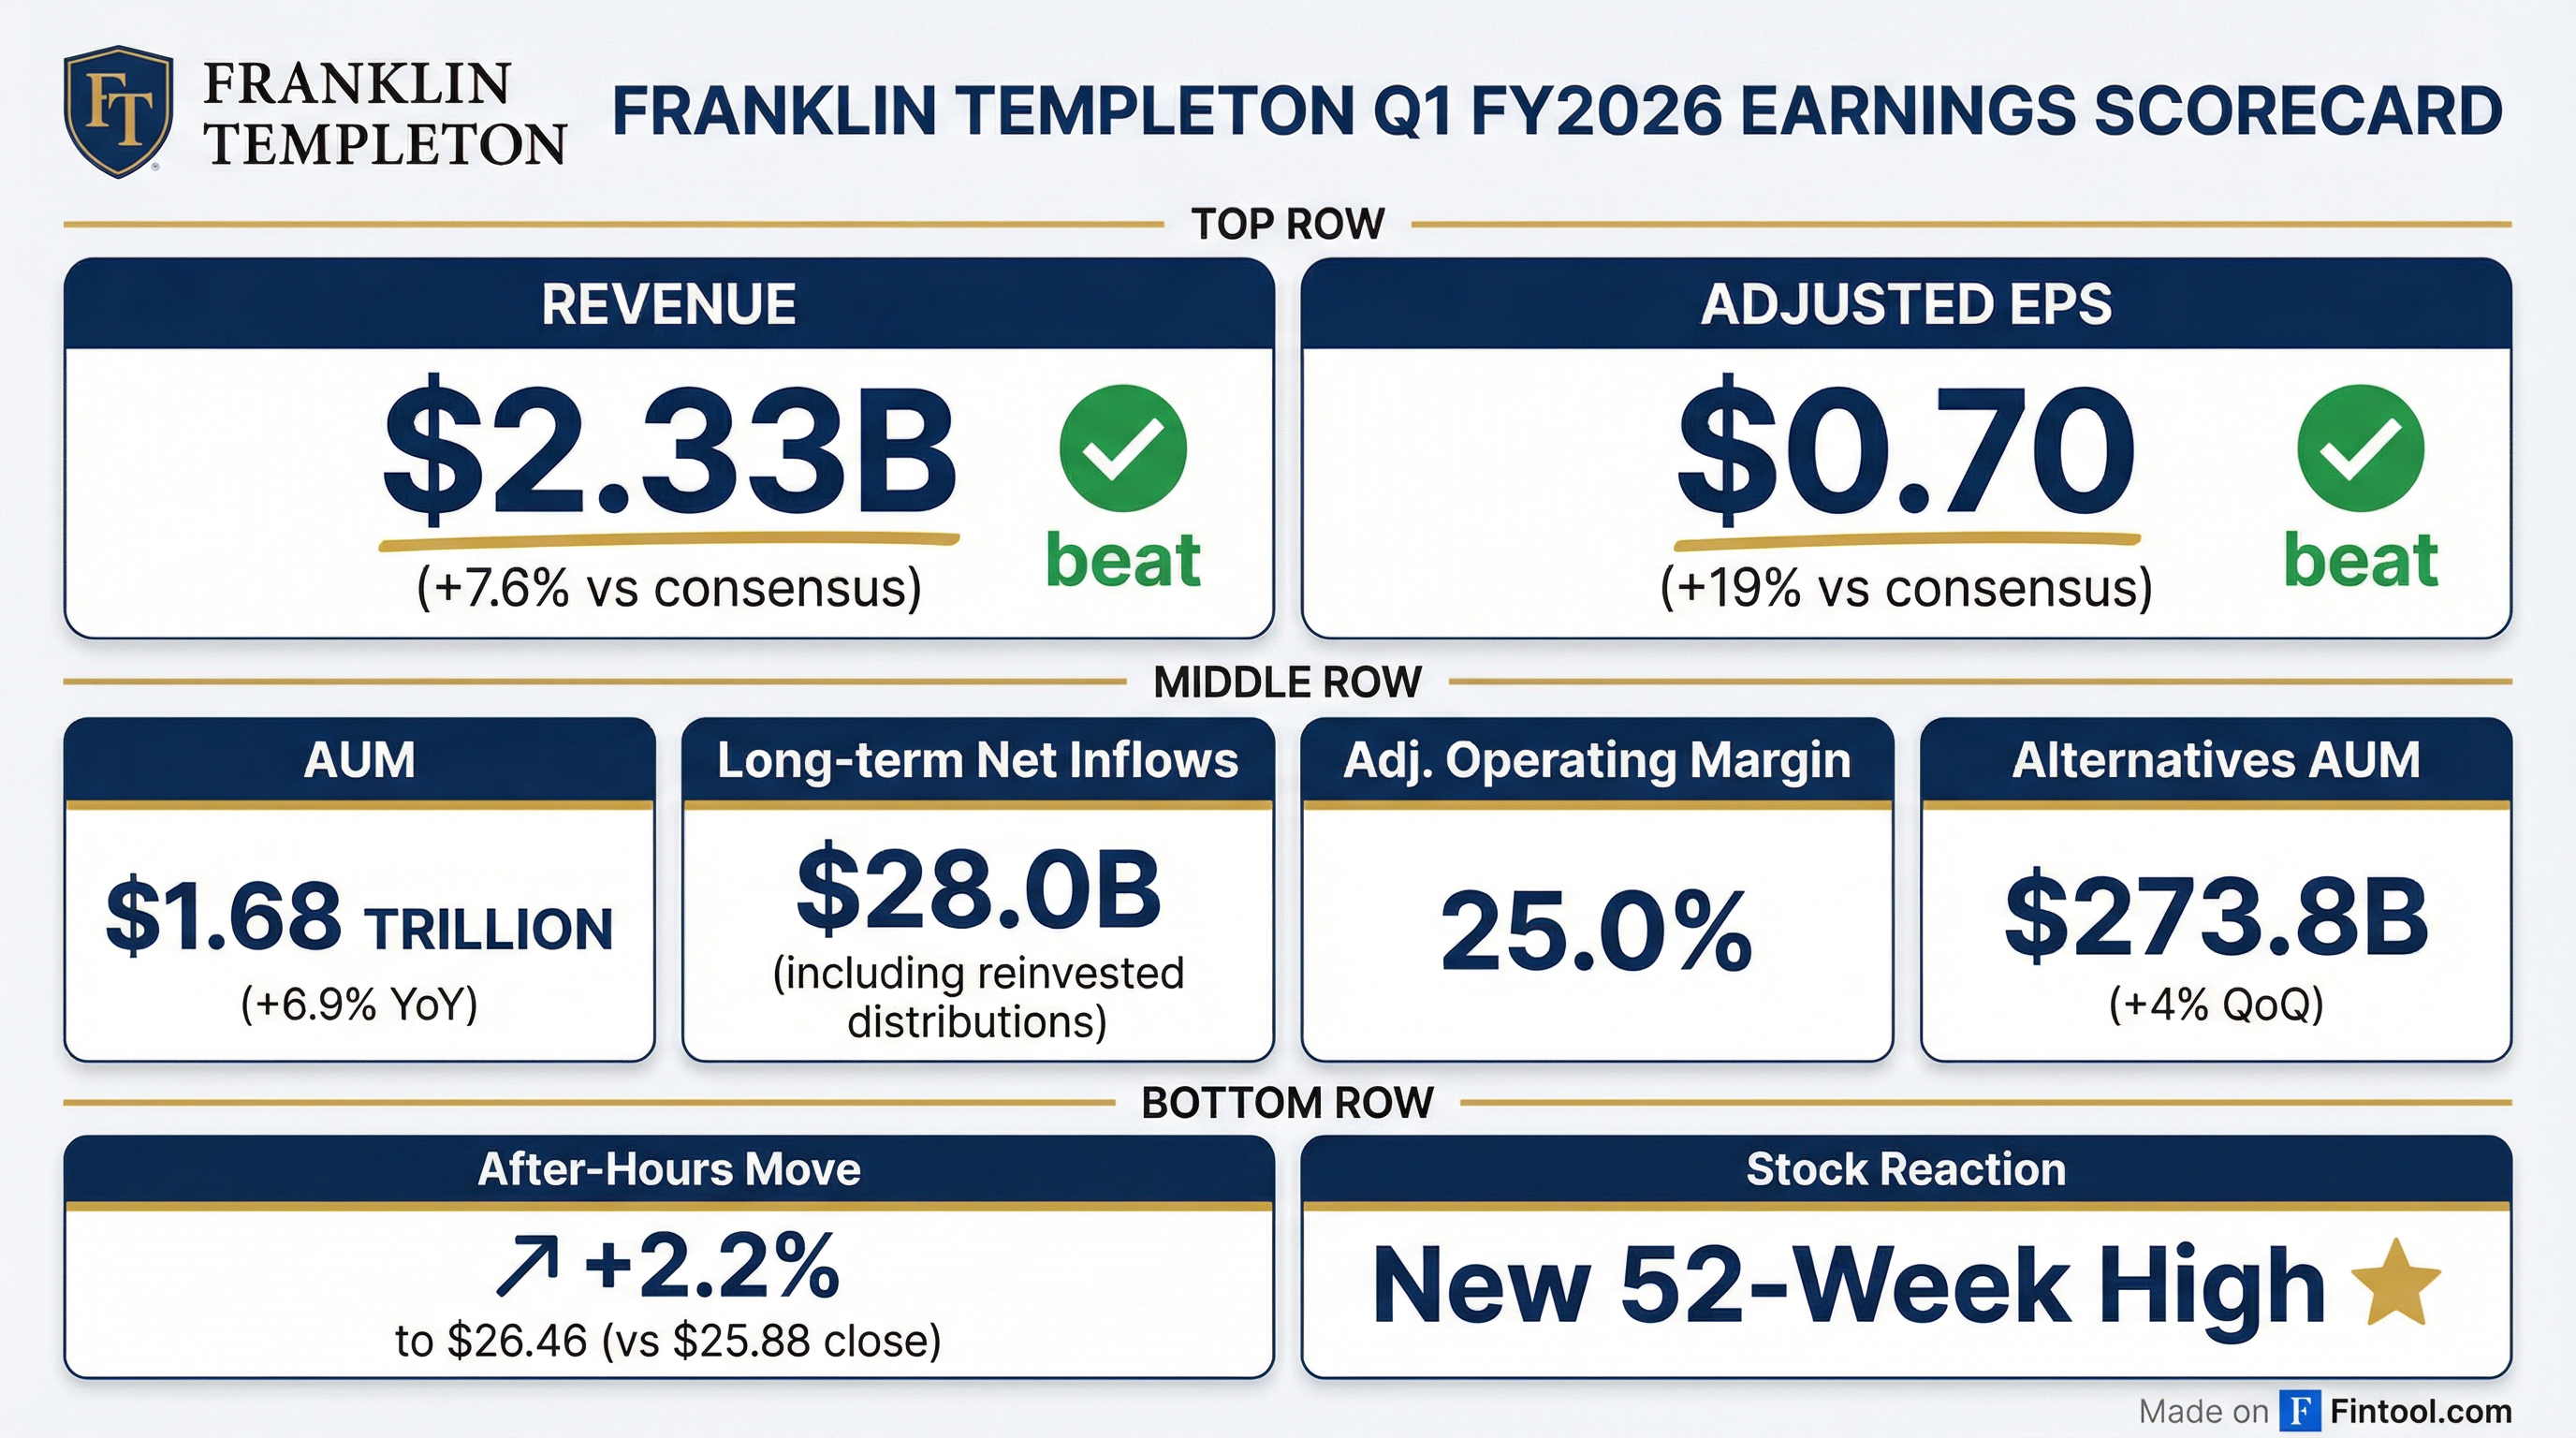
- Franklin Templeton achieved record long-term inflows of $118.6 billion, up 40% quarter-over-quarter and 22% year-over-year, driving assets under management to $1.68 trillion at quarter end.
- Long-term net inflows totaled $28 billion, and $34.6 billion on a comparable basis excluding Western Asset Management, marking nine consecutive quarters of positive net flows.
- Alternative assets under management reached $274 billion, with $10.8 billion raised during the quarter (including $9.5 billion in private markets) and $4.8 billion in aggregate realizations and distributions.
- Adjusted operating income was $437.3 million, reflecting higher average AUM and cost-savings initiatives, partially offset by lower performance fees.
- Record long-term inflows of $118.6 billion, up 40% QoQ, driving AUM to $1.68 trillion at quarter end.
- Adjusted Operating Income of $437.3 million, reflecting higher average AUM and cost savings, offset by lower performance fees.
- Over 50% of mutual fund and ETF AUM outperformed peer medians across 3-, 5- and 10-year periods, supporting growth and retention.
- Operating margin expected to exit FY2026 in the high-20s%, with a target to exceed 30% in fiscal 2027 under current market levels.
- Record long-term inflows of $118.6 billion (+40% QoQ, +22% YoY); long-term net inflows of $28 billion; assets under management at $1.68 trillion at quarter end.
- Equities saw net inflows of $19.8 billion (including $24.6 billion in reinvested distributions); private markets AUM reached $274 billion with $10.8 billion raised this quarter.
- ETF AUM reached $58 billion with $7.5 billion in net flows (including $3.5 billion from mutual fund conversions); retail SMAs grew to $171 billion with $2.4 billion in net inflows; Canvas AUM at $18 billion with $1.4 billion net flows.
- Expenses are projected to be flat year-over-year at flat markets, with operating margins expected to reach the high-20s percent by year-end and exceed 30% in fiscal 2027 (excluding Western Asset support).
- Continued strategic M&A: closed Apera Asset Management to enhance European direct lending; future bolt-on deals to focus on private markets capabilities, distribution, and high-net-worth offerings.
- Ended Q1 2026 with $1.68 trillion in AUM and $28.0 billion in long-term net inflows, driven by record flows across equities, multi-asset and alternatives.
- Generated $1.747 billion of adjusted operating revenue (–3.7% QoQ), $378 million of adjusted net income, and $0.70 of adjusted diluted EPS.
- Achieved an adjusted effective fee rate of 37.4 bps and an adjusted operating margin of 25.0%.
- Returned $212.1 million to shareholders, including $170.2 million in dividends and $41.9 million in share repurchases; declared a quarterly dividend of $0.33 per share.
- Completed the acquisition of Apera Asset Management, adding $6.1 billion to private credit AUM, bringing total private credit AUM to $94.6 billion.
- Net income of $255.5 million, or $0.46 per diluted share, and operating income of $281.0 million for the quarter ended December 31, 2025, up 56% and 28% year-over-year, respectively.
- Operating revenues of $2.327 billion, a 3% increase year-over-year, with adjusted operating income of $437.3 million for the quarter.
- Assets under management rose to $1.684 trillion, up 7% year-over-year, led by long-term net inflows of $28.0 billion and the acquisition of Apera Asset Management.
- Repurchased 1.8 million shares for $41.9 million; total stockholders’ equity was $13.1 billion at quarter-end.
- Net income of $255.5 million or $0.46 per diluted share for the quarter ended December 31, 2025
- Operating income of $281.0 million, up from $219.0 million in the prior-year quarter
- Assets under management reached $1.684 trillion, with $28.0 billion of long-term net inflows in the quarter
- Alternatives fundraising totaled $10.8 billion, including $9.5 billion in private market assets
Fintool News
In-depth analysis and coverage of FRANKLIN RESOURCES.

Quarterly earnings call transcripts for FRANKLIN RESOURCES.
Ask Fintool AI Agent
Get instant answers from SEC filings, earnings calls & more