FRANKLIN RESOURCES (BEN)·Q1 2026 Earnings Summary
Franklin Resources Beats Q1 as Alternatives Fundraising Surges to $10.8B
January 30, 2026 · by Fintool AI Agent
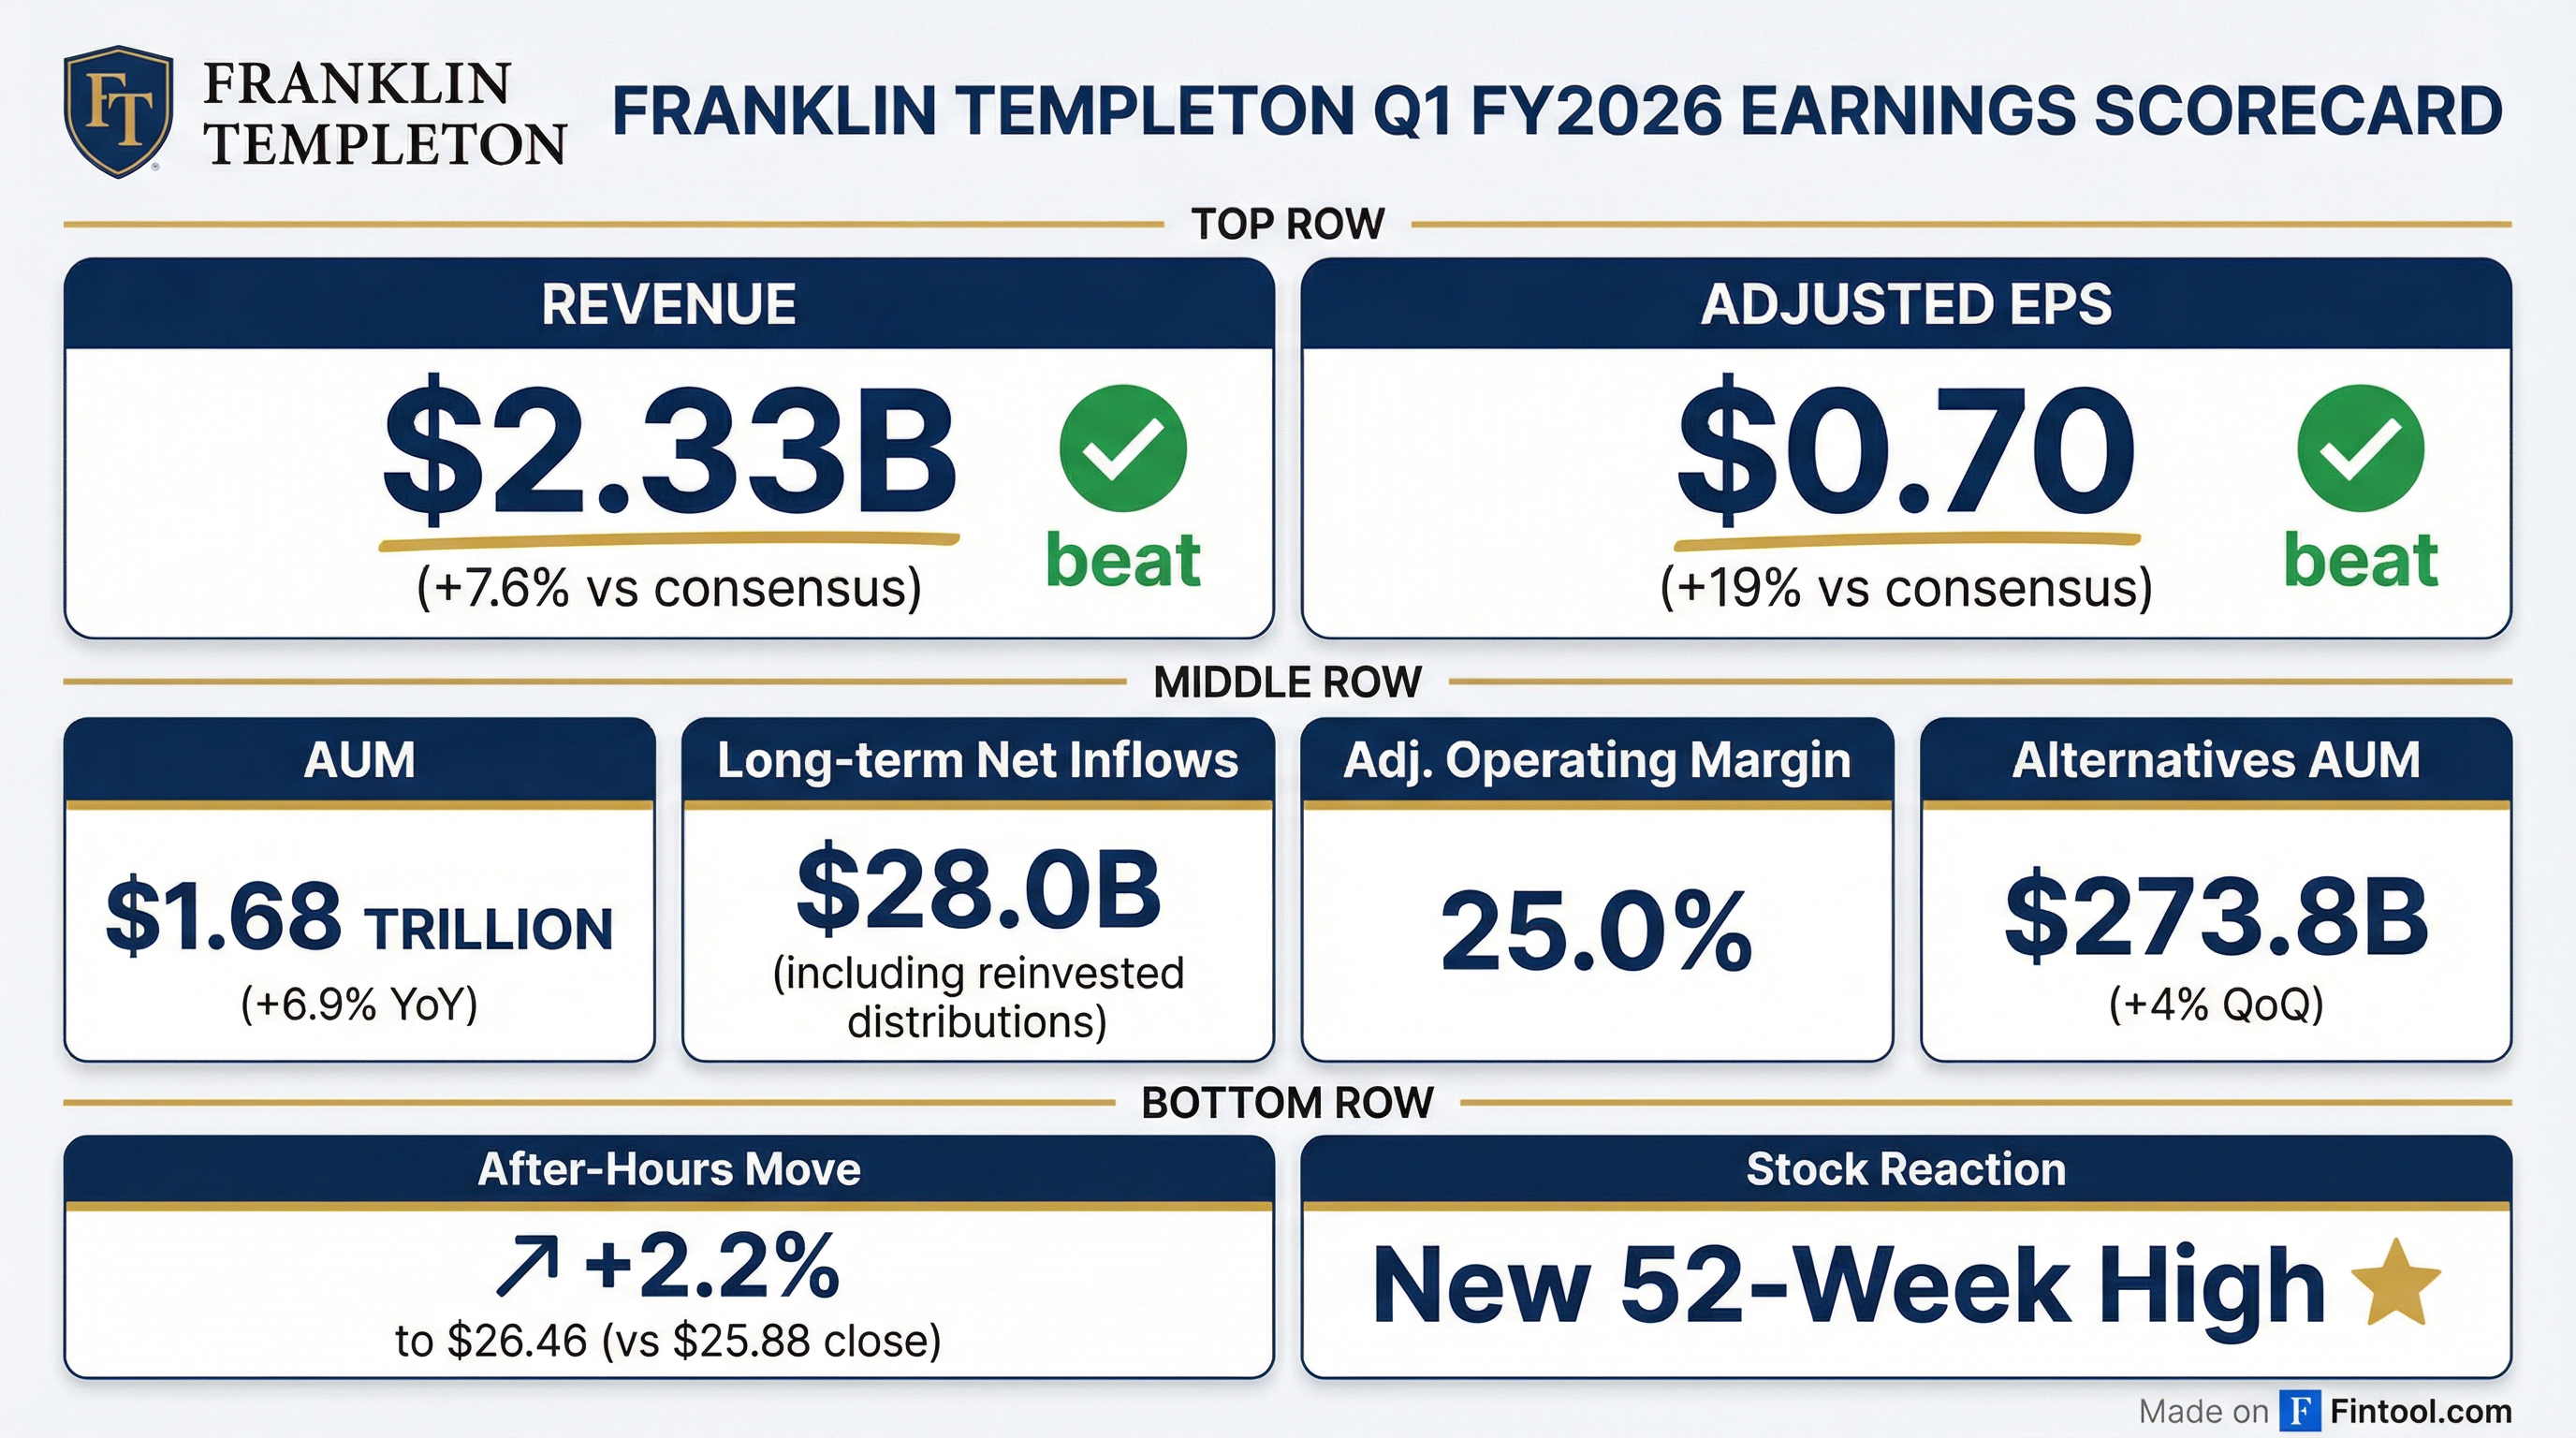
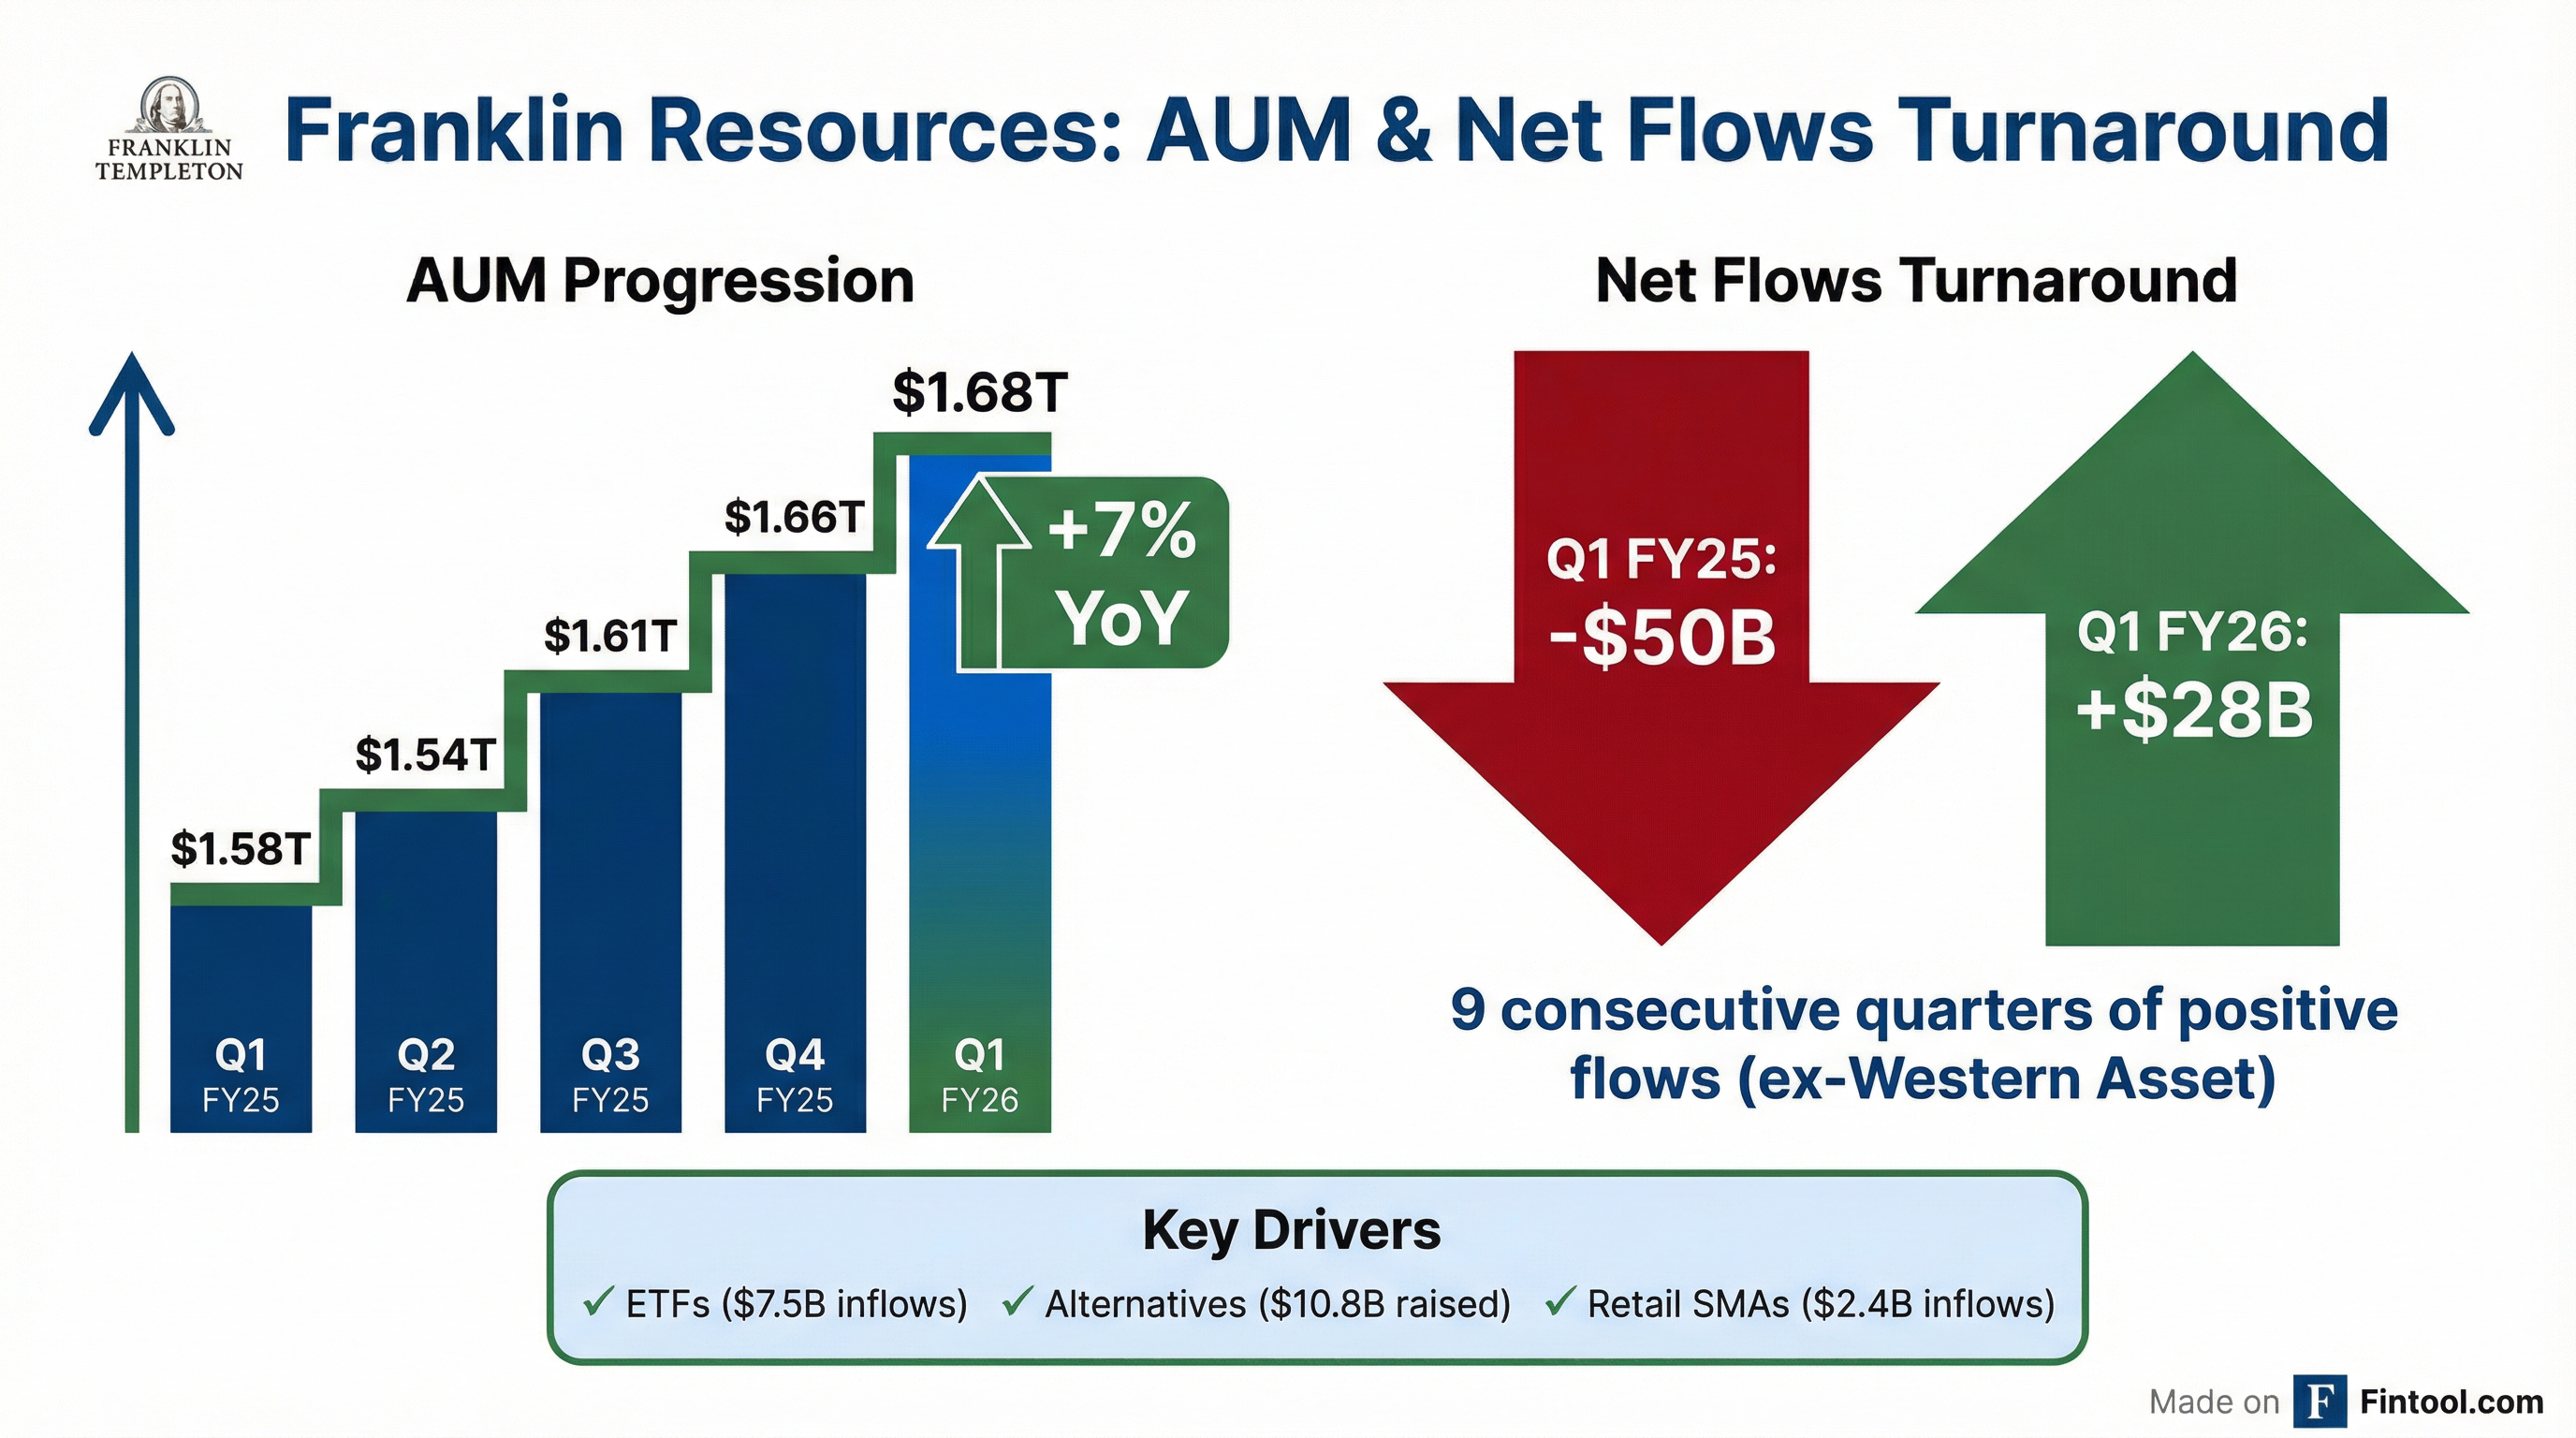
Franklin Resources delivered a strong Q1 FY2026, beating analyst estimates on both revenue and earnings while posting its ninth consecutive quarter of positive flows excluding Western Asset Management. The asset manager saw long-term net inflows of $28.0 billion—a stark reversal from $50.0 billion in outflows a year ago—driven by record AUM across alternatives, ETFs, and retail SMAs.
Did Franklin Resources Beat Earnings?
Yes—convincingly. Franklin Resources beat on both the top and bottom line:
*Values retrieved from S&P Global
Operating income surged 229% sequentially to $281.0 million from $85.4 million in Q4 FY2025, which was depressed by a $202.2 million impairment charge at Western Asset Management.
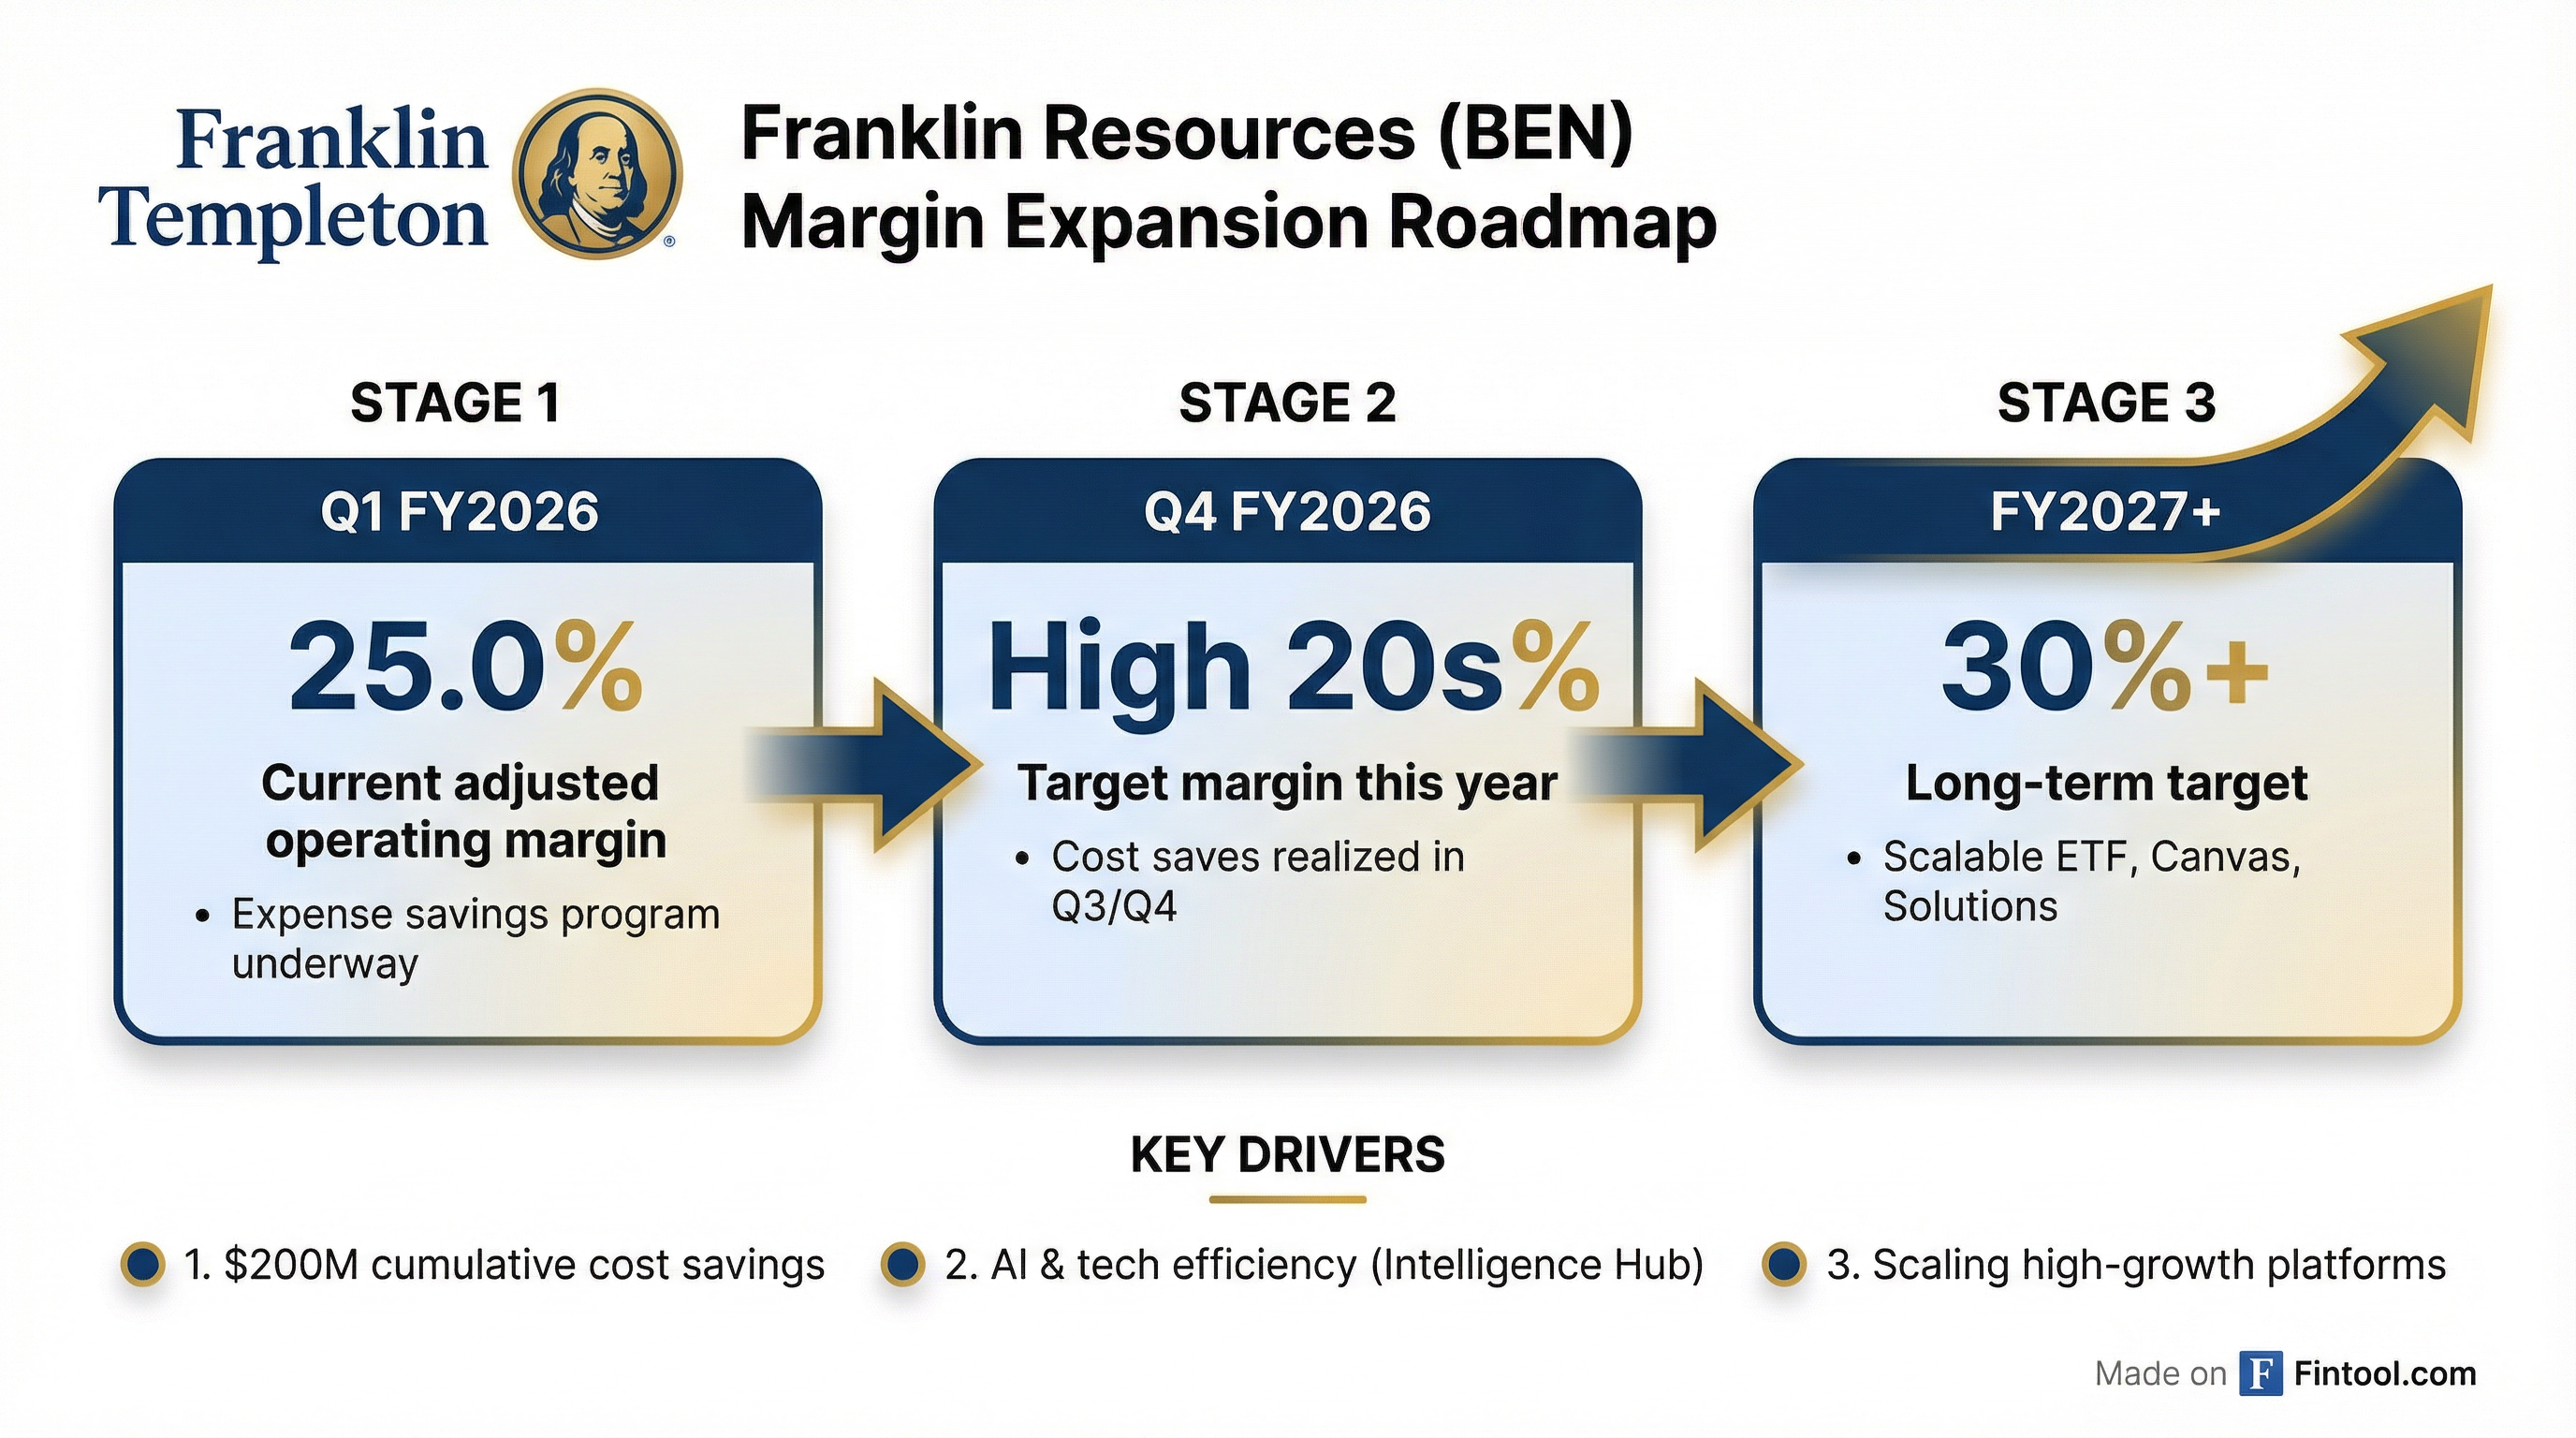
On an adjusted basis, operating income declined 7% sequentially to $437.3 million but rose 6% year-over-year. Adjusted operating margin compressed slightly to 25.0% from 26.0% in Q4 FY2025, but improved from 24.5% a year ago.
What Drove the Strong Results?
The quarter's outperformance was fueled by three key growth engines:
1. Alternatives Fundraising Momentum
Franklin raised $10.8 billion in alternatives during Q1, including $9.5 billion in private market assets. Key highlights:
- Lexington Partners: Co-Investment Partners VI closed with $4.6 billion in committed capital—one of the largest dedicated global co-investment funds. Lexington's AUM now stands at $83 billion, up 46% since its 2022 acquisition.
- Benefit Street Partners: The October 1 close of Apera Asset Management enhanced Franklin's direct lending capabilities in Europe's lower middle market. US and European alternative credit businesses are now aligned under the Benefit Street Partners brand, representing $95 billion in AUM.
- Clarion Partners: Real estate AUM of $75 billion remains well-positioned despite a challenging capital-raising environment.
2. ETF Platform Reaches Record $58B AUM
The ETF platform delivered its 17th consecutive quarter of positive flows, generating $7.5 billion in net inflows (including $3.5 billion in mutual fund conversions).
3. Retail SMA and Canvas Growth
- Retail SMA AUM: Increased to over $170 billion with $2.4 billion in net inflows
- Canvas: AUM grew 11% to $18 billion with $1.4 billion in net flows—positive since acquisition
What Changed From Last Quarter?
The dramatic swing in operating income reflects the absence of Q4's $202.2 million intangible asset impairment charge related to Western Asset Management. On an adjusted basis, the sequential decline in operating income reflects lower acquisition-related performance-based fees ($55.0M vs $22.0M).
AUM by Asset Class
Total AUM reached $1.684 trillion, up 7% year-over-year:
Fixed income outflows of $2.4 billion include the ongoing impact from Western Asset Management, which saw $6.6 billion in long-term net outflows. Excluding Western, total firm long-term inflows would have been $34.6 billion—nearly double the prior year quarter.
What Did Management Guide?
CFO Matt Nicholls provided detailed expense and margin guidance on the earnings call, signaling confidence in the path to 30%+ margins:
Q2 FY26 Expense Detail:
- Compensation & Benefits: ~$860M (includes $30M calendar year resets, assumes $50M performance fees)
- IS&T: $155M
- Occupancy: $70M
- G&A: $190-195M
Path to 30%+ Margins: Management expects to reach 30% adjusted operating margin "at some time in fiscal 2027" and sees potential for 30-35% margins if strategic plan goals are achieved.
What Did Management Say?
CEO Jenny Johnson highlighted the diversified platform's momentum:
"Long-term net inflows were $28.0 billion, with record AUM and positive net flows across equity, multi-asset and alternatives strategies, as well as ETFs, retail SMAs and Canvas. Excluding Western Asset Management, long-term net inflows totaled $34.6 billion, nearly double the prior year quarter, extending our track record to a ninth consecutive quarter of positive flows on a comparable basis."
On client needs and strategic positioning:
"Clients are no longer looking for individual products in isolation. They're looking for partners who can help them construct portfolios across public and private markets, deliver personalization at scale, and navigate complexity with discipline and insight."
Q&A Highlights: What's New From the Earnings Call?
Western Asset: DOJ Clears Path Forward
A major overhang has lifted. CFO Matt Nicholls confirmed the DOJ will not pursue criminal charges related to the Western Asset investigation, which is expected to be resolved through a disposition. Despite ongoing outflows, Western had $6.6 billion in gross sales this quarter—a sign clients are still allocating.
"The DOJ came out and said they're not gonna pursue criminal charges... I think that gave clients a little bit of a breather of an uncertainty." — Jenny Johnson
January Flows: Potentially Positive Including Western
CEO Johnson revealed early January data showing the firm is on track for positive net flows inclusive of Western—the first time in a long while:
"January hasn't closed yet, but we actually are looking like we will be positive net flows, inclusive of Western, which has been a long time since that... Part of that has just been the strength of Putnam." — Jenny Johnson
AI Initiatives: Intelligence Hub Launch
Franklin announced Intelligence Hub, a modular AI-driven distribution platform powered by Microsoft Azure. Early results show significant productivity gains:
- Time to finalize call lists: Down 90% (3-4 hours → 15 minutes)
- Meeting prep time: Down 67% (6 hours → 2 hours per week)
- Number of sales meetings: Up 9-10%
Blockchain & Tokenization
Johnson provided extensive commentary on Franklin's blockchain strategy, citing dramatic cost advantages for the tokenized Benji money market fund—$1.13 to process 50,000 transactions on the Stellar blockchain vs. $1.50 per transaction on legacy systems.
"By the end of March, we will have the ability for somebody who has a stablecoin, where Benji has been integrated with multiple different stablecoins... to convert from your stablecoin into our money market fund, and on a Saturday, convert out if you want to leverage it for payment and earn that yield."
M&A Strategy: Focused on Three Areas
Johnson outlined where Franklin would pursue M&A:
- Bolt-on acquisitions to existing alternatives managers (geographic or capability expansion)
- Distribution enhancement deals (like Putnam)
- High net worth/fiduciary to double fiduciary trust business
CFO Nicholls noted M&A has added almost 60% of operating income over the last several years, but the bar is higher now given where the stock trades.
How Did the Stock React?
BEN shares rose +2.2% in after-hours trading to $26.46, following a close of $25.88. The stock is now approaching its 52-week high of $26.25.
Year-to-date, BEN shares have climbed from $22.43 at the start of January, reflecting investor optimism around the flow turnaround and alternatives growth story.
Capital Allocation
Franklin repurchased 1.8 million shares for $41.9 million during Q1. The company declared a quarterly dividend of $0.33 per share, up 3% from $0.32 in the prior year.
Balance sheet highlights:
- Cash and investments: $5.1 billion ($6.2 billion including CIP investments)
- Total stockholders' equity: $13.1 billion
- Shares outstanding: 520.0 million
Key Risks to Monitor
-
Western Asset Outflows: While the DOJ criminal charges overhang has lifted, Western continues to experience elevated redemptions with $6.6 billion in net outflows this quarter. Full stabilization depends on the SEC resolution timeline.
-
Market Sensitivity: 35-40% of expenses are variable, providing downside protection. However, AUM and fee revenue remain highly sensitive to market movements—$10.1 billion of net market change, distributions, and other offset some of the quarter's flow gains.
-
Lower-Fee Product Mix: ETFs, Canvas, and Solutions are scaling rapidly but carry lower fee rates. Management expects these businesses to become margin-accretive as they scale, but near-term pressure on effective fee rates could persist.
-
Acquisition Integration: Franklin has acquired 11 companies in the last 5-6 years, with some (like Mason) involving multiple legacy systems. Integration work is ongoing and "takes multiple years."
Looking Ahead
Key catalysts for the coming quarters:
-
Lexington Fund XI: Actively fundraising with a first close expected this year, targeting similar size to Fund X. Notably, Q1 alternatives fundraising of $9.5B excluded any Lexington flagship fund contributions.
-
Margin expansion: Cost savings expected to accelerate in Q3/Q4, with management targeting high-20s margin by fiscal year-end and 30%+ in fiscal 2027.
-
Wealth channel alternatives: 15-20% of alternatives fundraising expected from wealth channel in 2026, with 40% coming from outside the U.S.
-
Western Asset resolution: With DOJ charges off the table, watch for outflow deceleration and potential return to growth. Early January shows promising signs.
-
ETF platform: 17th consecutive positive quarter; active ETFs now represent 70% of ETF flows.
Sources: Franklin Resources Q1 FY2026 8-K filing, Q1 FY2026 earnings call transcript, S&P Global consensus estimates, market data