Bankwell Financial Group (BWFG)·Q4 2025 Earnings Summary
Bankwell Posts Strong Q4 as NIM Expansion, Loan Growth Drive Turnaround
January 29, 2026 · by Fintool AI Agent
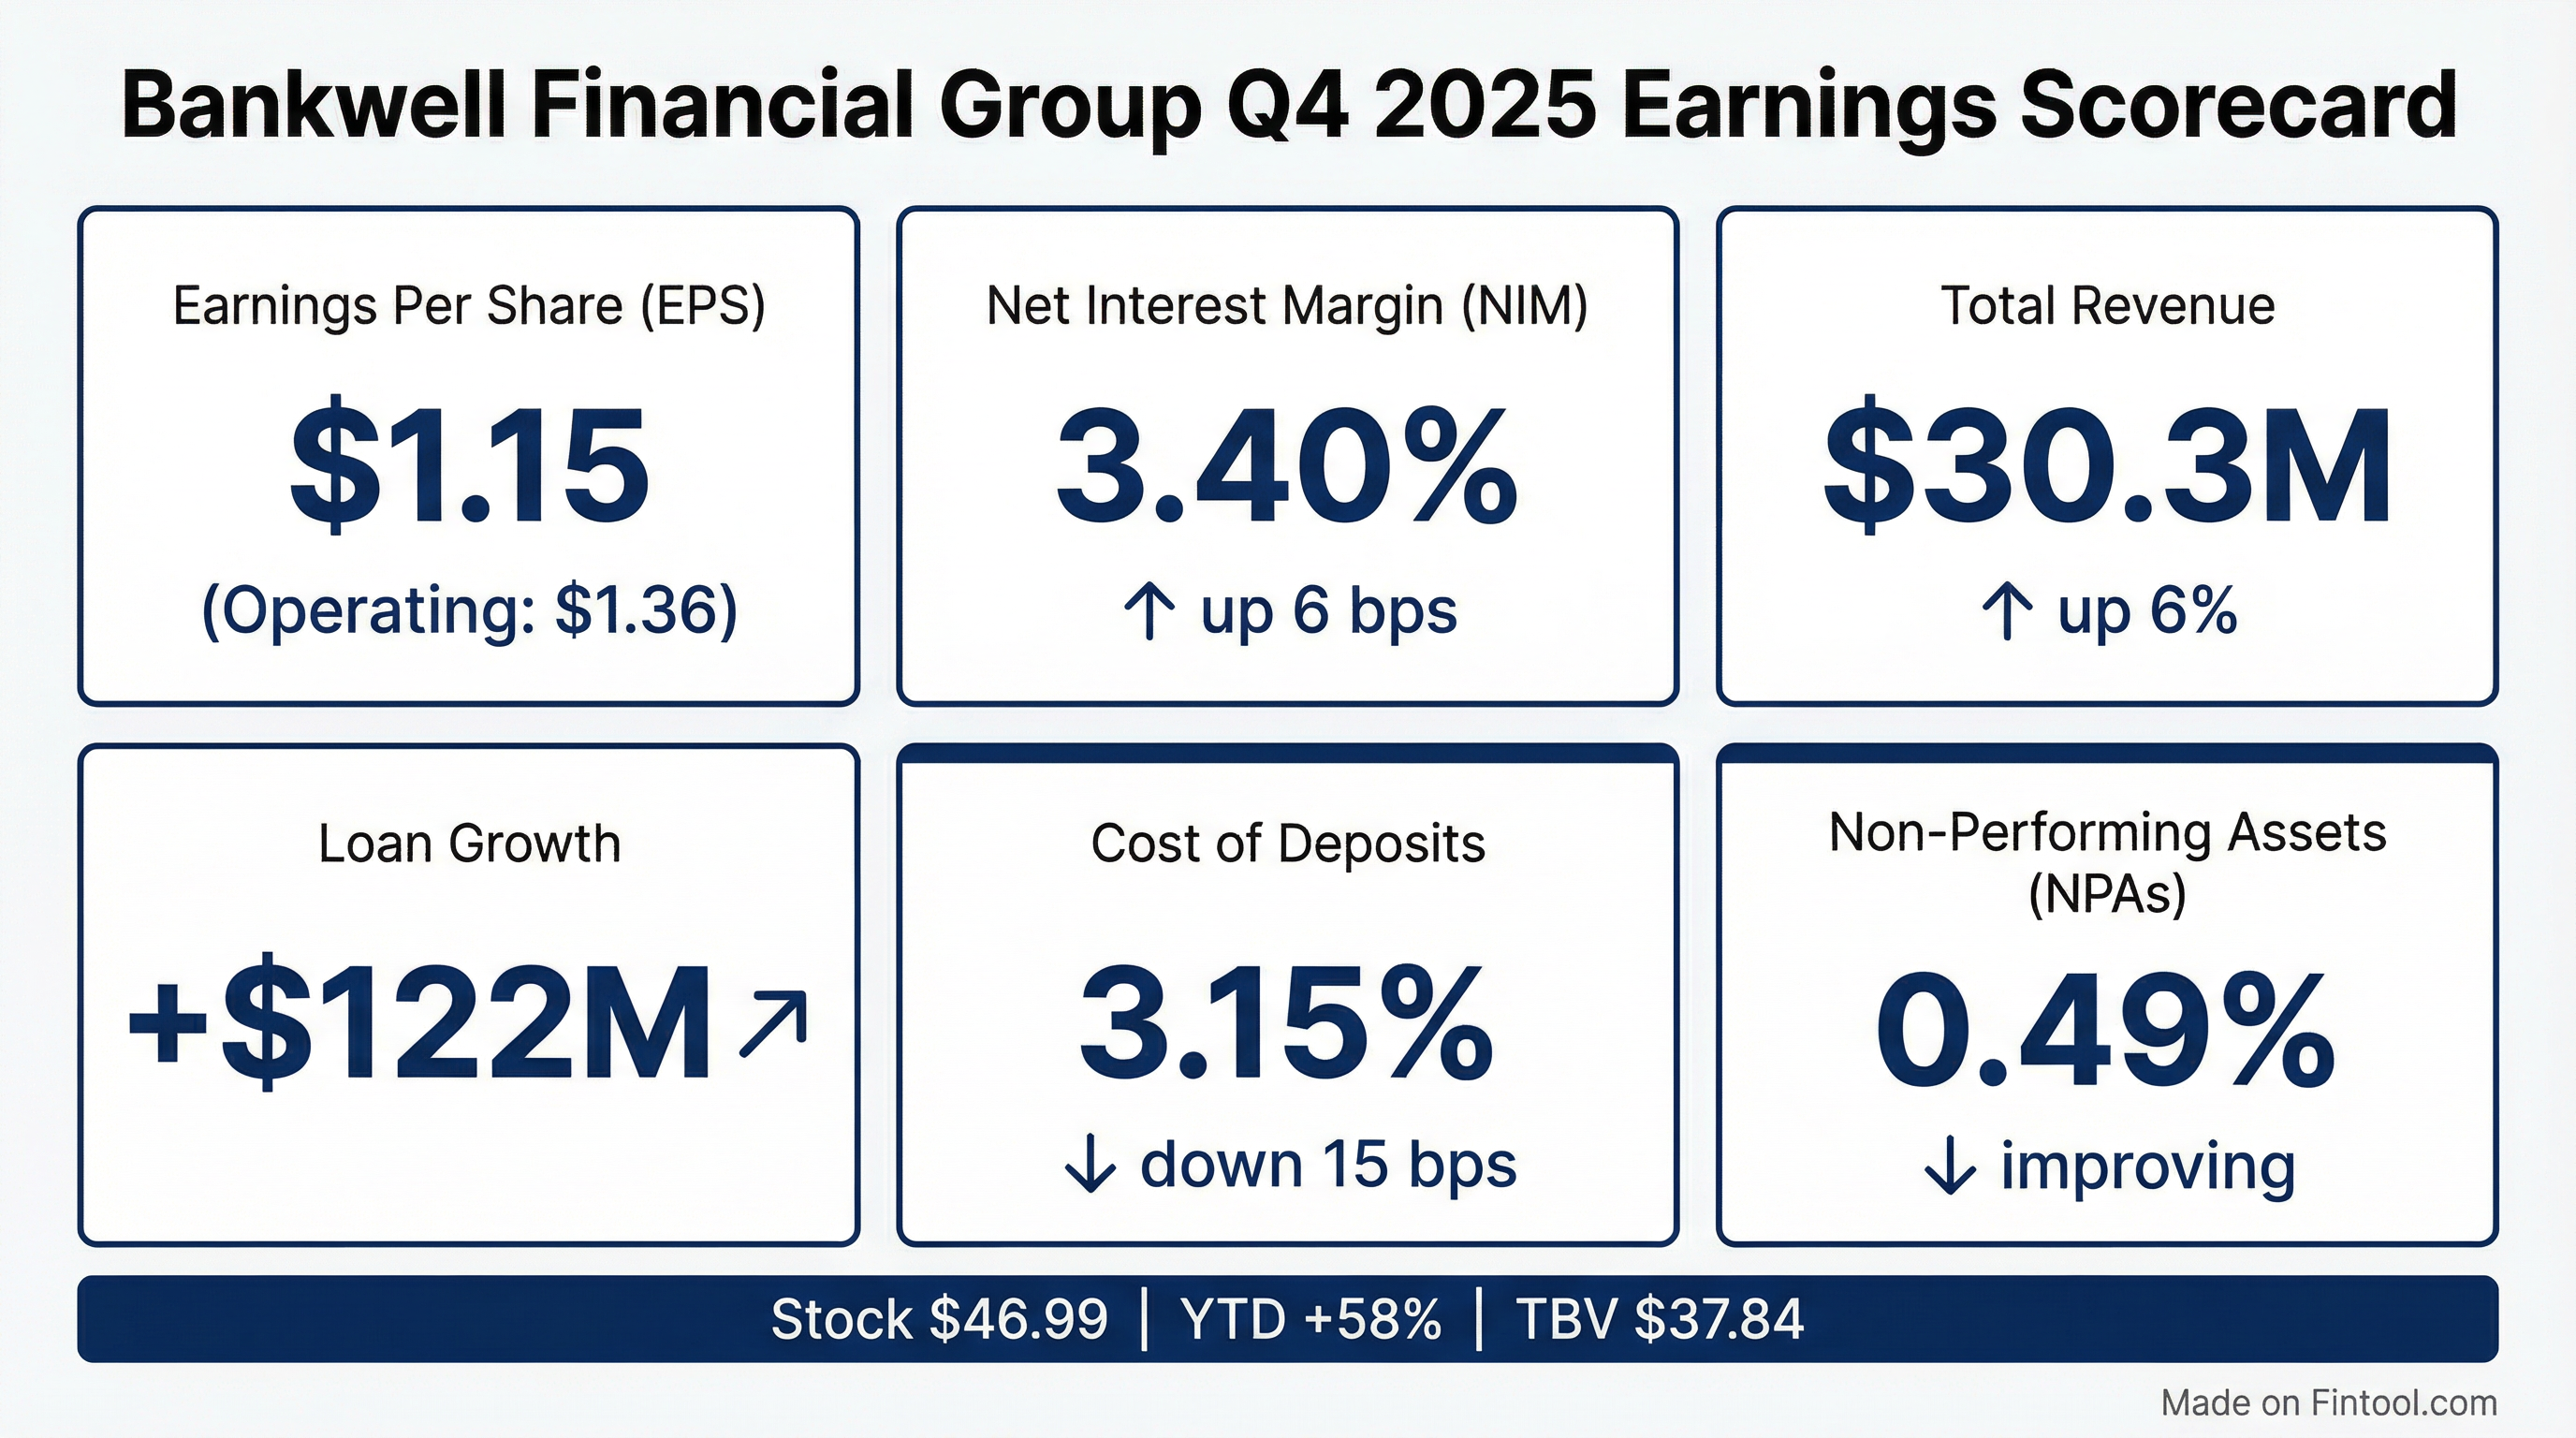
Bankwell Financial Group (NASDAQ: BWFG) delivered another strong quarter as its multi-quarter turnaround continued, with Q4 2025 diluted EPS of $1.15 (or $1.36 on an operating basis) driven by NIM expansion to 3.40% and robust loan growth of $122 million . The Connecticut-based regional bank has transformed its earnings trajectory, rising from a $0.37 EPS trough in Q4 2024 to consistently above $1.00 over the past three quarters.
Management provided explicit 2026 guidance for the first time: net interest income of $111-112M, loan growth of 4-5%, and non-interest income of $11-12M . The stock trades at $46.90, up nearly 60% over the past year as investors have re-rated the franchise on improving profitability and credit quality.
Did Bankwell Beat Earnings?
Bankwell is a micro-cap regional bank with limited analyst coverage, so formal consensus estimates are not widely available. However, the quarter showed strong sequential momentum across key metrics:
The reported EPS decline from Q3's $1.27 was driven by a $1.5 million one-time adjustment to the income tax provision associated with state tax filings and changes in estimated tax positions as the company expanded its state-level footprint . On an operating basis excluding this adjustment, EPS was $1.36.
How Did the Stock React?
BWFG shares have been on a remarkable run, climbing from below $30 at the start of 2025 to nearly $50 by year-end. The stock's performance tracks closely with the bank's earnings recovery:
The stock is trading at 1.24x tangible book value ($37.84 TBV per share) , reasonable for a bank generating 12-14% returns on tangible common equity .
What's Driving the Turnaround?
NIM Expansion is the Story
The bank's net interest margin has recovered dramatically from its Q4 2024 trough of 2.60% to 3.40% in Q4 2025—an 80 basis point expansion in just four quarters .
Key drivers of NIM improvement:
- Deposit repricing: Total deposit cost of 3.15%, down 15 bps from Q3 and 57 bps from Q4 2024
- Time deposit maturities: Repriced ~$1.2 billion of time deposits 69 bps lower in 2025, generating ~$8.2 million in annualized benefit
- Proactive rate management: 25 bp reduction on non-maturity products, 50 bp reduction on offered time deposit rates, 75 bp reduction on Fed Funds-indexed deposits
- December exit rate: Deposit cost of 3.08% positions the bank favorably entering 2026
Looking ahead, $1.2 billion in time deposits maturing in the next 12 months show current pricing ~32 bps below maturity rates, suggesting another ~$3.8 million annualized benefit or ~12 bps of NIM .
Loan Growth Accelerating
Loan balances increased $122 million in Q4 on approximately $240 million of funded originations, including $24 million in SBA loans . Full-year 2025 funded originations of $758 million exceeded the prior two years' combined total .
Strategic shift to floating-rate: The bank increased floating-rate loans to 38% of the portfolio, up from 23% at year-end 2024 . This intentional repositioning improves asset sensitivity but moderated NIM expansion pace as rates fell.
New loan rates averaged 7.29% on 2025 originations, replacing ~$700 million of runoff at an average rate of ~6.50% .
Credit Quality Improving
Non-performing assets declined to 0.49% of total assets, down from 0.56% in Q3 and 1.88% in Q4 2024 . The allowance for credit losses remains stable at 1.08% of loans .
What Changed From Last Quarter?
Positives:
- Non-interest income surged 36% to $3.4 million, driven by $2.2 million in SBA loan sale gains
- PPNR growth of 7.2% to $14.9 million ($1.89 per share), reflecting operating leverage
- Efficiency ratio improved to 50.8% from 51.4%
- Brokered deposits reduced $50 million in Q4, $146 million YTD, bringing total reduction from peak to $468 million
Watch Items:
- Tax provision adjustment: One-time $1.5 million expense related to state tax filings impacted reported EPS
- Higher borrowings: Increased to $179.7 million from $144.6 million in Q3 to fund loan growth
What Did Management Guide?
Management provided explicit 2026 guidance for the first time, signaling confidence in the sustainability of the turnaround:
*Estimated based on quarterly run-rates
Key guidance implications:
- SBA originations targeting ~$100M to achieve non-interest income guidance, up from $68M in 2025
- Effective tax rate of ~25% going forward, down from the 27.4% full-year 2025 rate that included one-time adjustments
- Operating ROA guidance implies >120 bps GAAP ROA for 2026, depending on provision
Q&A Highlights
On loan pipeline composition:
"It's C&I heavy. I'd say it's 60/40 C&I. We've steadily brought down investor CRE to capital over the past several years."
On expense growth investments:
"Our headcount went up by more than 10% last year from about 145 to 170 FTE... We're making these investments while we're putting up, our operating ROA for the quarter is 129 basis points."
On loan pricing spreads:
"No recent spread compression. We generate a reasonable amount of floating-rate loans... We typically are able to keep our due-to-loan demand where it spreads in time."
On SBA seasonality:
"We'll see smooth production throughout the year unless there's a government shutdown."
Portfolio Composition
Bankwell's $2.84 billion loan portfolio shows increasing diversification :
The CRE concentration ratio improved to 344% from 454% in Q4 2021 , reflecting the deliberate shift toward C&I and healthcare lending.
Capital Position
Bankwell maintains strong capital ratios with room for continued growth:
Approximately 205,000 shares remain available for repurchase under the current authorization .
Forward Outlook
Management provided explicit 2026 guidance reflecting confidence in the turnaround's sustainability:
- Loan growth of 4-5% with a C&I-heavy pipeline (60/40 vs investor CRE)
- Net interest income of $111-112M, supported by $1.2B in time deposits repricing ~32 bps lower
- Non-interest income of $11-12M, implying ~$100M SBA originations (vs $68M in 2025)
- Operating expenses of $64-65M, reflecting continued investment in people and technology
The December deposit "exit rate" of 3.08% and the $1.2B time deposit repricing tailwind position the bank favorably entering 2026 .
Key Takeaways
- Turnaround executing: From $0.37 EPS in Q4 2024 to $1.15-$1.36 operating range demonstrates significant operational improvement
- 2026 guidance positive: $111-112M NII, 4-5% loan growth, $11-12M non-interest income signals continued momentum
- NIM story intact: 80 bps of expansion since trough with more tailwinds ahead from $1.2B deposit repricing
- SBA scaling rapidly: Targeting ~$100M 2026 originations vs $68M in 2025, driving fee income diversification
- Credit improving: NPAs down to 0.49% from 1.88% a year ago
- Valuation reasonable: 1.24x TBV for 12-14% ROTCE franchise
Analysis based on Bankwell Financial Group Q4 2025 earnings presentation and earnings call transcript released January 29, 2026.
Related: