Earnings summaries and quarterly performance for BXP.
Executive leadership at BXP.
Owen Thomas
Chief Executive Officer
Bryan Koop
Executive Vice President, Boston Region
Donna Garesché
Executive Vice President, Chief Human Resources Officer
Douglas Linde
President
Eric Kevorkian
Senior Vice President, Chief Legal Officer & Secretary
Hilary Spann
Executive Vice President, New York Region
John Stroman
Executive Vice President, Co-Head of the Washington, DC Region
Michael LaBelle
Executive Vice President, Chief Financial Officer & Treasurer
Michael Walsh
Senior Vice President, Chief Accounting Officer
Peter Otteni
Executive Vice President, Co-Head of the Washington, DC Region
Raymond Ritchey
Senior Executive Vice President
Rodney Diehl
Executive Vice President, West Coast Regions
Board of directors at BXP.
Research analysts who have asked questions during BXP earnings calls.
Alexander Goldfarb
Piper Sandler
8 questions for BXP
John Kim
BMO Capital Markets
8 questions for BXP
Nicholas Yulico
Scotiabank
8 questions for BXP
Steve Sakwa
Evercore ISI
8 questions for BXP
Anthony Paolone
JPMorgan Chase & Co.
7 questions for BXP
Blaine Heck
Wells Fargo Securities
7 questions for BXP
Ronald Kamdem
Morgan Stanley
7 questions for BXP
Jana Galan
Bank of America
6 questions for BXP
Michael Goldsmith
UBS
6 questions for BXP
Brendan Lynch
Barclays
5 questions for BXP
Caitlin Burrows
Goldman Sachs
5 questions for BXP
Dylan Burzinski
Green Street Advisors, LLC
5 questions for BXP
Floris van Dijkum
Compass Point Research & Trading
5 questions for BXP
Richard Anderson
Wedbush Securities
5 questions for BXP
Michael Lewis
Truist Securities, Inc.
3 questions for BXP
Omotayo Okusanya
Deutsche Bank AG
3 questions for BXP
Peter Abramowitz
Jefferies
3 questions for BXP
Seth Berge
Citigroup
3 questions for BXP
Upal Rana
KeyBanc Capital Markets
3 questions for BXP
Vikram Malhotra
Mizuho Financial Group, Inc.
3 questions for BXP
Brendan James Lynch
Barclays Bank PLC
2 questions for BXP
Dylan Robert Burzinski
Green Street Advisors
2 questions for BXP
Floris Gerbrand van Dijkum
Compass Point Research & Trading, LLC
2 questions for BXP
Michael Griffin
Citigroup Inc.
2 questions for BXP
Seth Bergey
Citi
2 questions for BXP
Upal Dhananjay Rana
KeyBanc Capital Markets Inc.
2 questions for BXP
Andrew Berger
Bank of America
1 question for BXP
Dylan Bazinsky
Green Street
1 question for BXP
James Feldman
Wells Fargo
1 question for BXP
Jamie Feldman
Wells Fargo & Company
1 question for BXP
Jeffrey Spector
BofA Securities
1 question for BXP
Recent press releases and 8-K filings for BXP.
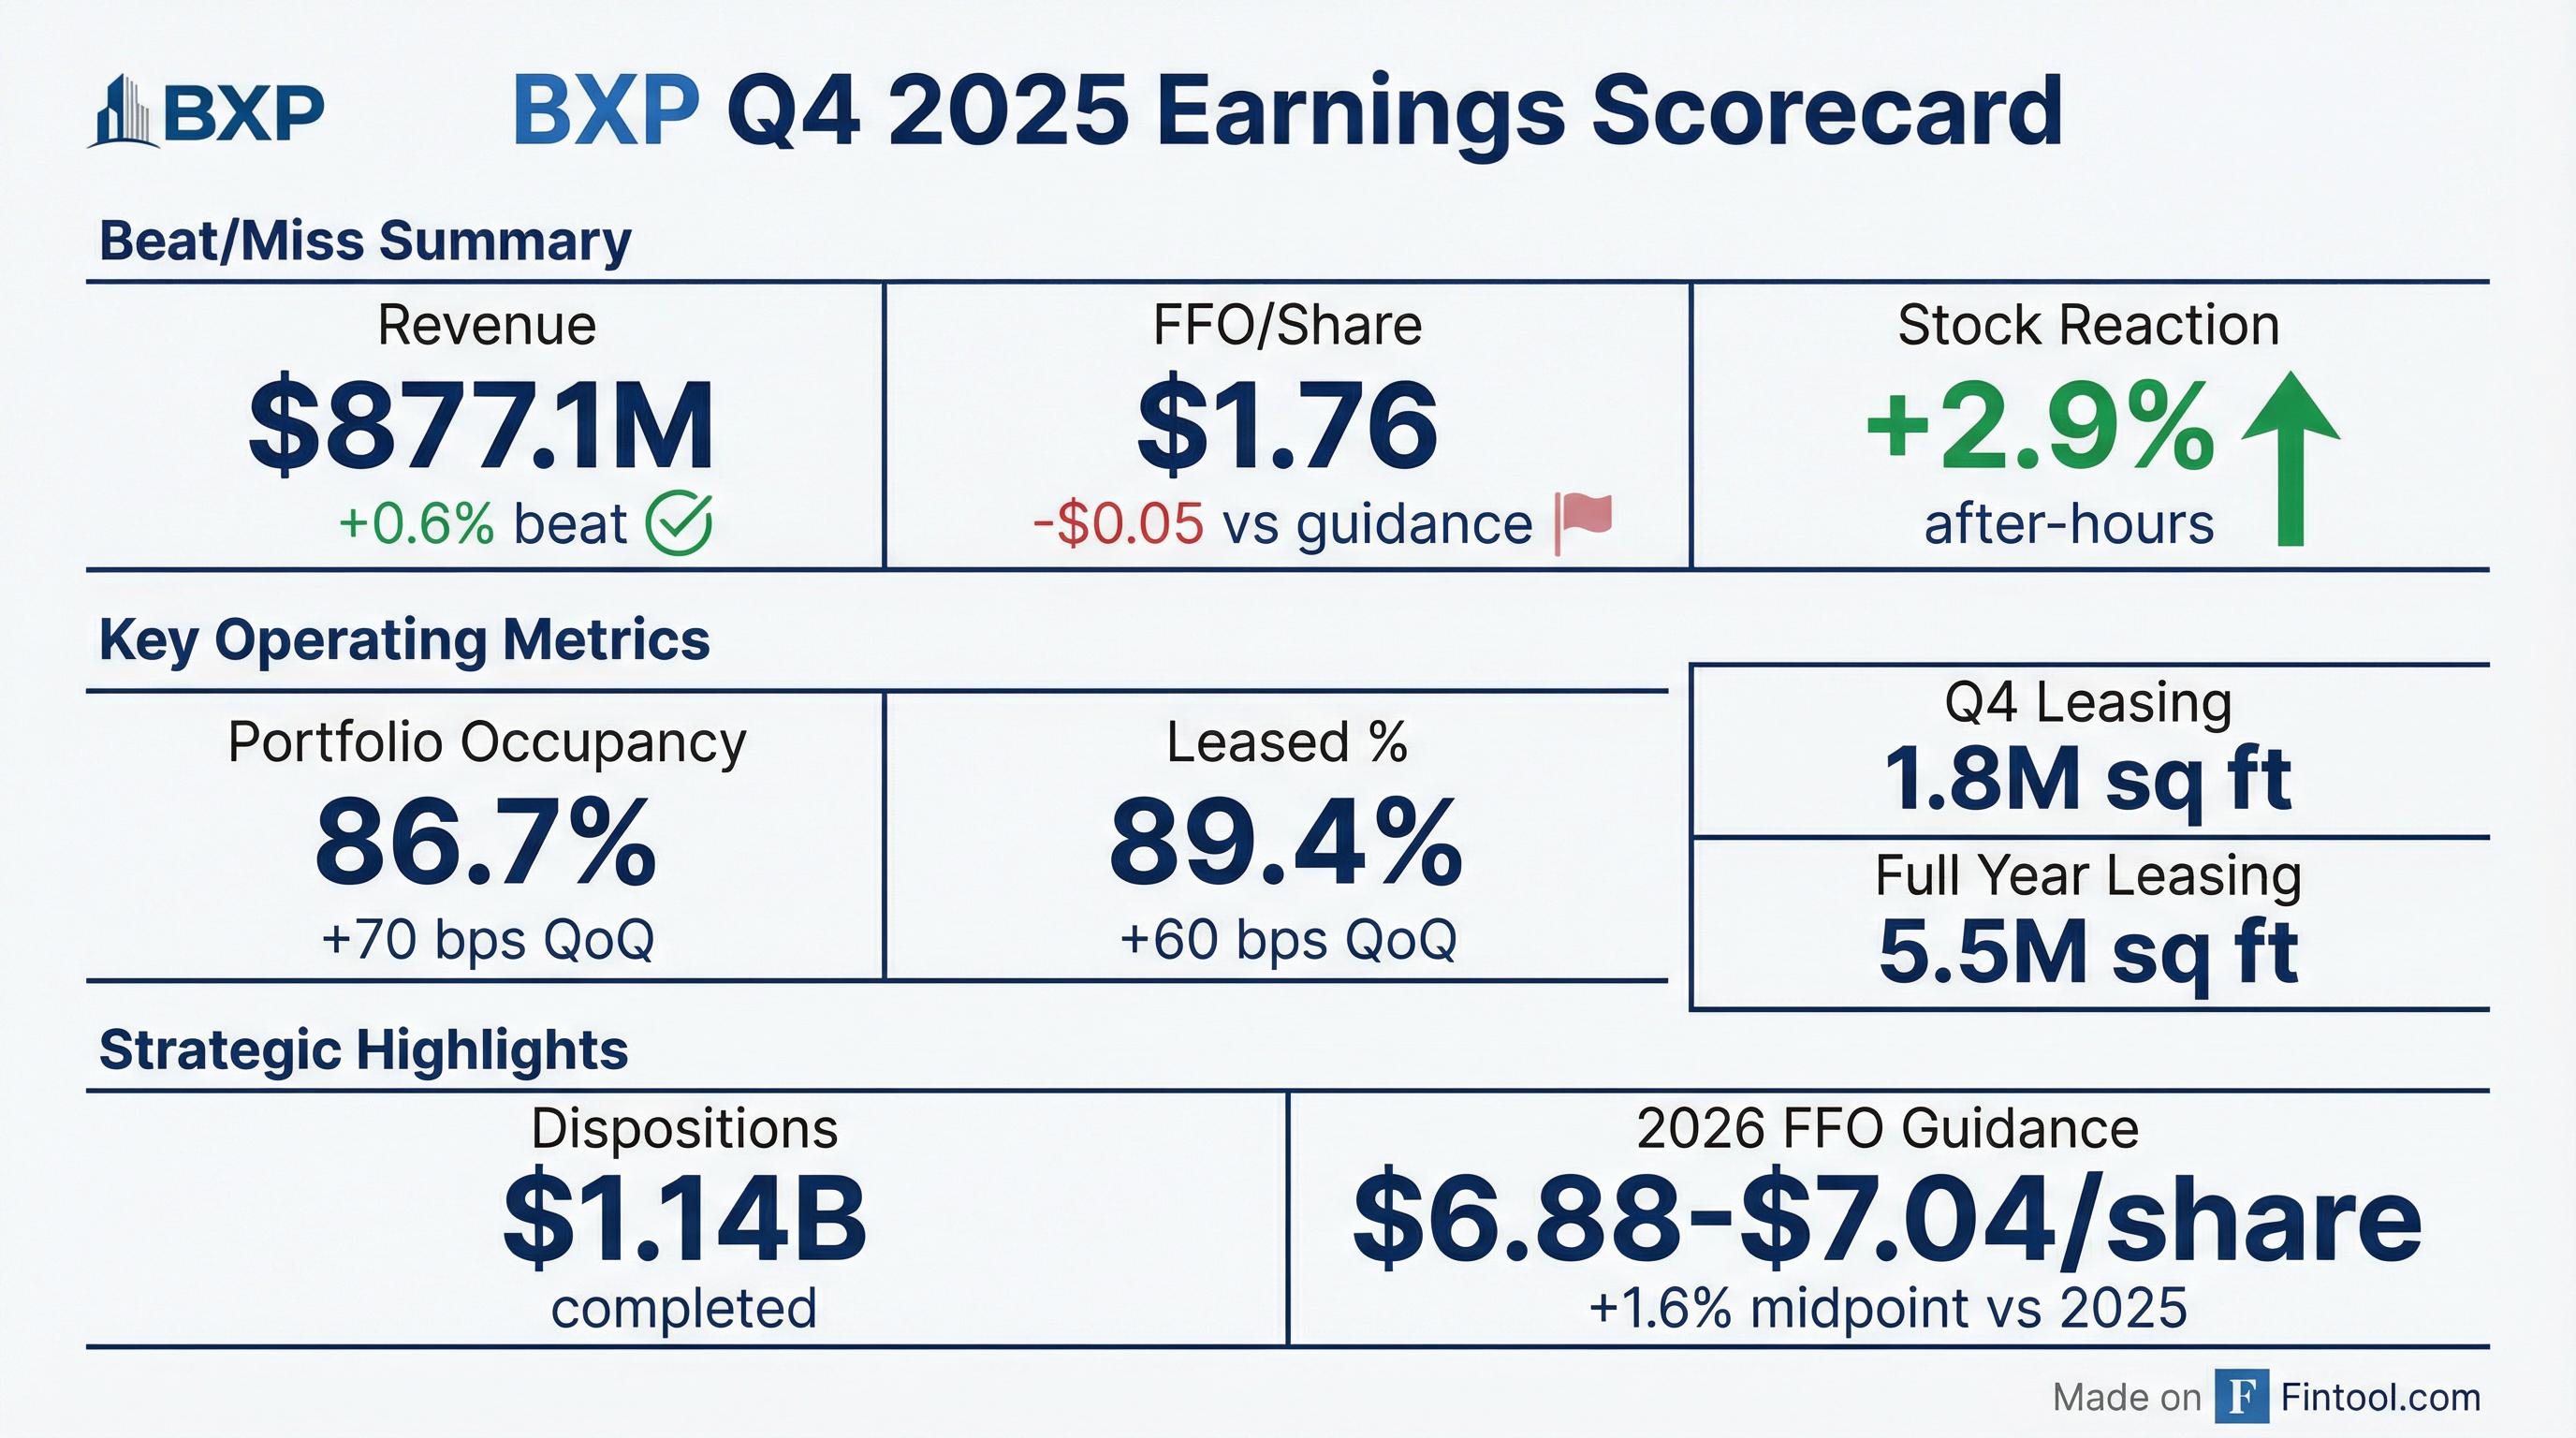
- BXP reported Q4 2025 FFO of $1.76 per share, below the midpoint by $0.05 due to higher G&A and credit reserves; full-year FFO was $6.85 per share on $3.5 billion in revenue
- Leasing strong: 1.8 million sq ft leased in Q4 and 5.5 million sq ft for full year, driving a 70 bp occupancy gain to 86.7%, with 1.1 million sq ft of leases signed but not yet commenced and 4 million sq ft targeted for 2026
- Asset disposition program accelerated: closed sale of 12 assets for $1 billion net proceeds, with 21 transactions (totaling ~$1.25 billion) closed or underway toward a $1.9 billion target by 2028
- Development pipeline flashing green: 8 projects under way (3.5 million sq ft; $3.7 billion BXP investment) including major starts at 343 Madison Avenue and 2100 M Street, with expected unleveraged cash yields >8%
- 2026 FFO guidance set at $6.88–$7.04 per share, driven by same-property NOI growth, new development deliveries, and lower interest expense, partially offset by asset sales and higher G&A
- Leasing: Completed 1.8 million sq ft in Q4 and 5.5 million sq ft for full year 2025, driving in-service occupancy to 86.7% at year-end.
- Asset sales & liquidity: Closed 12 assets for $1 billion in net proceeds (including $850 million in 2025 and $180 million in January), with eight additional assets under contract for $230 million; ended Q4 with $1.5 billion in cash and plans to redeem a $1.1 billion bond in February.
- 2026 guidance: Issued FFO per share guidance of $6.88–$7.04, with a midpoint of $6.96, reflecting expected same-property NOI growth, development contributions, and lower interest expense, offset by asset sale dilutive impact.
- Development pipeline: Advancing eight projects totaling 3.5 million sq ft with $3.7 billion of BXP investment; key deliveries include 290 Binney Street in mid-2026 and equity recapitalization of 343 Madison Avenue targeted for 2026.
- Strong leasing in 2025: BXP completed over 1.8 million sq ft of leasing in Q4 and 5.5 million sq ft for full year, underpinning its 4% occupancy gain target over the next two years.
- Asset sales program: Closed 12 assets for net proceeds of over $1 billion ($850 million in 2025 and $180 million YTD) and has 8 more assets under contract for ~$230 million, totaling 21 transactions and ~$1.25 billion in proceeds.
- 2025 financial results: Reported $3.5 billion in consolidated revenues and $1.2 billion of FFO ($6.85 per share); Q4 FFO was $1.76/share, $0.05 below guidance midpoint due to higher G&A and credit reserves.
- 2026 FFO guidance: Introduced guidance of $6.88–$7.04 per share (midpoint $6.96, up $0.11 vs 2025) driven by higher occupancy, development deliveries, and lower interest expense, partially offset by asset sale dilution and increased G&A.
- Q4 revenue rose 2.2% to $877.1 M, with net income of $248.5 M (EPS $1.56) and FFO of $280.2 M (FFO/sh $1.76)
- 2025 net income of $276.8 M (EPS $1.74) and FFO of $1.1 B (FFO/sh $6.85) for the full year
- Executed 1.8 M SF of leases in Q4 (5.5 M SF in 2025) and raised total portfolio occupancy by 70 bps to 86.7%
- Completed over $1.0 B in property dispositions, generating net proceeds exceeding $1.0 B
- Provided 2026 guidance of Q1 EPS $0.32–0.34, FY EPS $2.08–2.29, and FFO $6.88–7.04 per share
- Completed property sales of more than $1.0 billion in net proceeds through January 2026, advancing toward its multi-year $1.9 billion disposition goal (2025–2027).
- Dispositions through end-2025 totaled $845 million, with two additional sales closed in January 2026 to surpass the $1.0 billion mark.
- Sales included seven suburban land parcels (
$220 million), two residential properties ($405 million), and seven non-core office and life sciences properties (~$400 million). - The program is designed to fund premier workplace developments and heighten portfolio concentration in core gateway markets.
- BXP has signed a 275,000-square-foot, 20-year lease with Starr for floors 16–27 at 343 Madison Avenue, representing about 30% of the 930,000-square-foot tower.
- Starr will use the space as its New York headquarters, relocating from 399 Park Avenue while retaining 49,000 square feet at 1177 Sixth Avenue.
- The 46-story tower, designed by Kohn Pedersen Fox with hospitality and sustainability features, is slated for delivery in late 2029, offering direct Grand Central Terminal access.
- Amid project financial strains, BXP’s net outlay on the roughly $2 billion development could fall to about $500 million if a partner assumes a large share of costs.
- BXP signed a 275,000 SF, 20-year lease with Starr for floors 16–27 (approximately 30% of the building) at its 343 Madison Avenue development, which will serve as Starr’s New York headquarters.
- 343 Madison Avenue is a 930,000 SF, 46-story premier workplace tower currently under construction, with delivery expected in late 2029.
- The building will feature a hospitality-forward amenity program—including a double-height top-floor club, lobby café, bicycle storage with showers—and sustainability features targeting LEED Platinum, Well Core, Energy Star 85+, Fitwel, and WiredScore Platinum certifications.
- BXP’s board extended CEO Owen Thomas’s employment through December 31, 2029, aiming to preserve continuity amid office-market challenges.
- The 2025 Outperformance Plan replaces much of long-term pay with performance-based equity and bonuses, featuring a $90 per-share floor and dividend-adjusted gains targets of roughly 30%–70%.
- Thomas’s base salary remains $950,000, with upside to $2.35 million for meeting performance targets, plus eligibility for additional equity awards.
- BXP expects to recognize $11.6 million of OPP-related expense in 2026 (about $0.07 per share) out of a projected $32.1 million over the four-year performance period.
- The REIT cut its dividend by 30%, plans ~$2 billion in property sales and funding for a $2 billion development, and recently reported $3.46 billion in revenue with a negative –$1.27 EPS.
- BXP delivered FFO of $1.74 per share, beating guidance by $0.04, and raised full-year 2025 FFO guidance to $6.89–$6.92 per share.
- BXP leased 1.5 million sq ft in Q3 (+39% YoY) and YTD 3.8 million sq ft (+14% YoY), with same-store occupancy up to 86.6%.
- Disposition program reached 23 transactions closed or underway for ~$1.25 billion in net proceeds, including $57 million from four land sales.
- Capital markets activity includes $1 billion of 5-year exchangeable notes at a 2% coupon (2.5% GAAP) and refinancing a $465 million mortgage at 5.73%.
- Development pipeline comprises 3.5 million sq ft under way with $3.7 billion of BXP investment, plus multifamily and office deliveries.
- Q3 FFO of $1.74 per share, beating guidance by $0.04 and consensus by $0.02; full-year 2025 FFO guidance raised to $6.89–$6.92 (+$0.03 midpoint)
- Completed 1.5 M sq ft of Q3 leasing (+39% YoY) and 3.8 M sq ft YTD (+14%); same-store occupancy rose 20 bps to 86.6%, with year-end 2025 and 2026 occupancy projected at 86.2% and 88.3%
- Disposition program includes 23 transactions closed or underway for $1.25 B net proceeds; 2025 sales expected of $500 M–$700 M; recorded $212 M of impairments, with net gains of ~$300 M anticipated
- Strengthened capital structure with $1 B of five-year exchangeable notes at 2% coupon (GAAP yield 2.5%) and a $465 M CMBS refinancing at 5.73%, lowering financing costs
Quarterly earnings call transcripts for BXP.
Ask Fintool AI Agent
Get instant answers from SEC filings, earnings calls & more