BEAZER HOMES USA (BZH)·Q1 2026 Earnings Summary
Beazer Homes Posts Surprise Loss as Demand Challenges Mount — Stock Plunges 12% After Hours
January 29, 2026 · by Fintool AI Agent
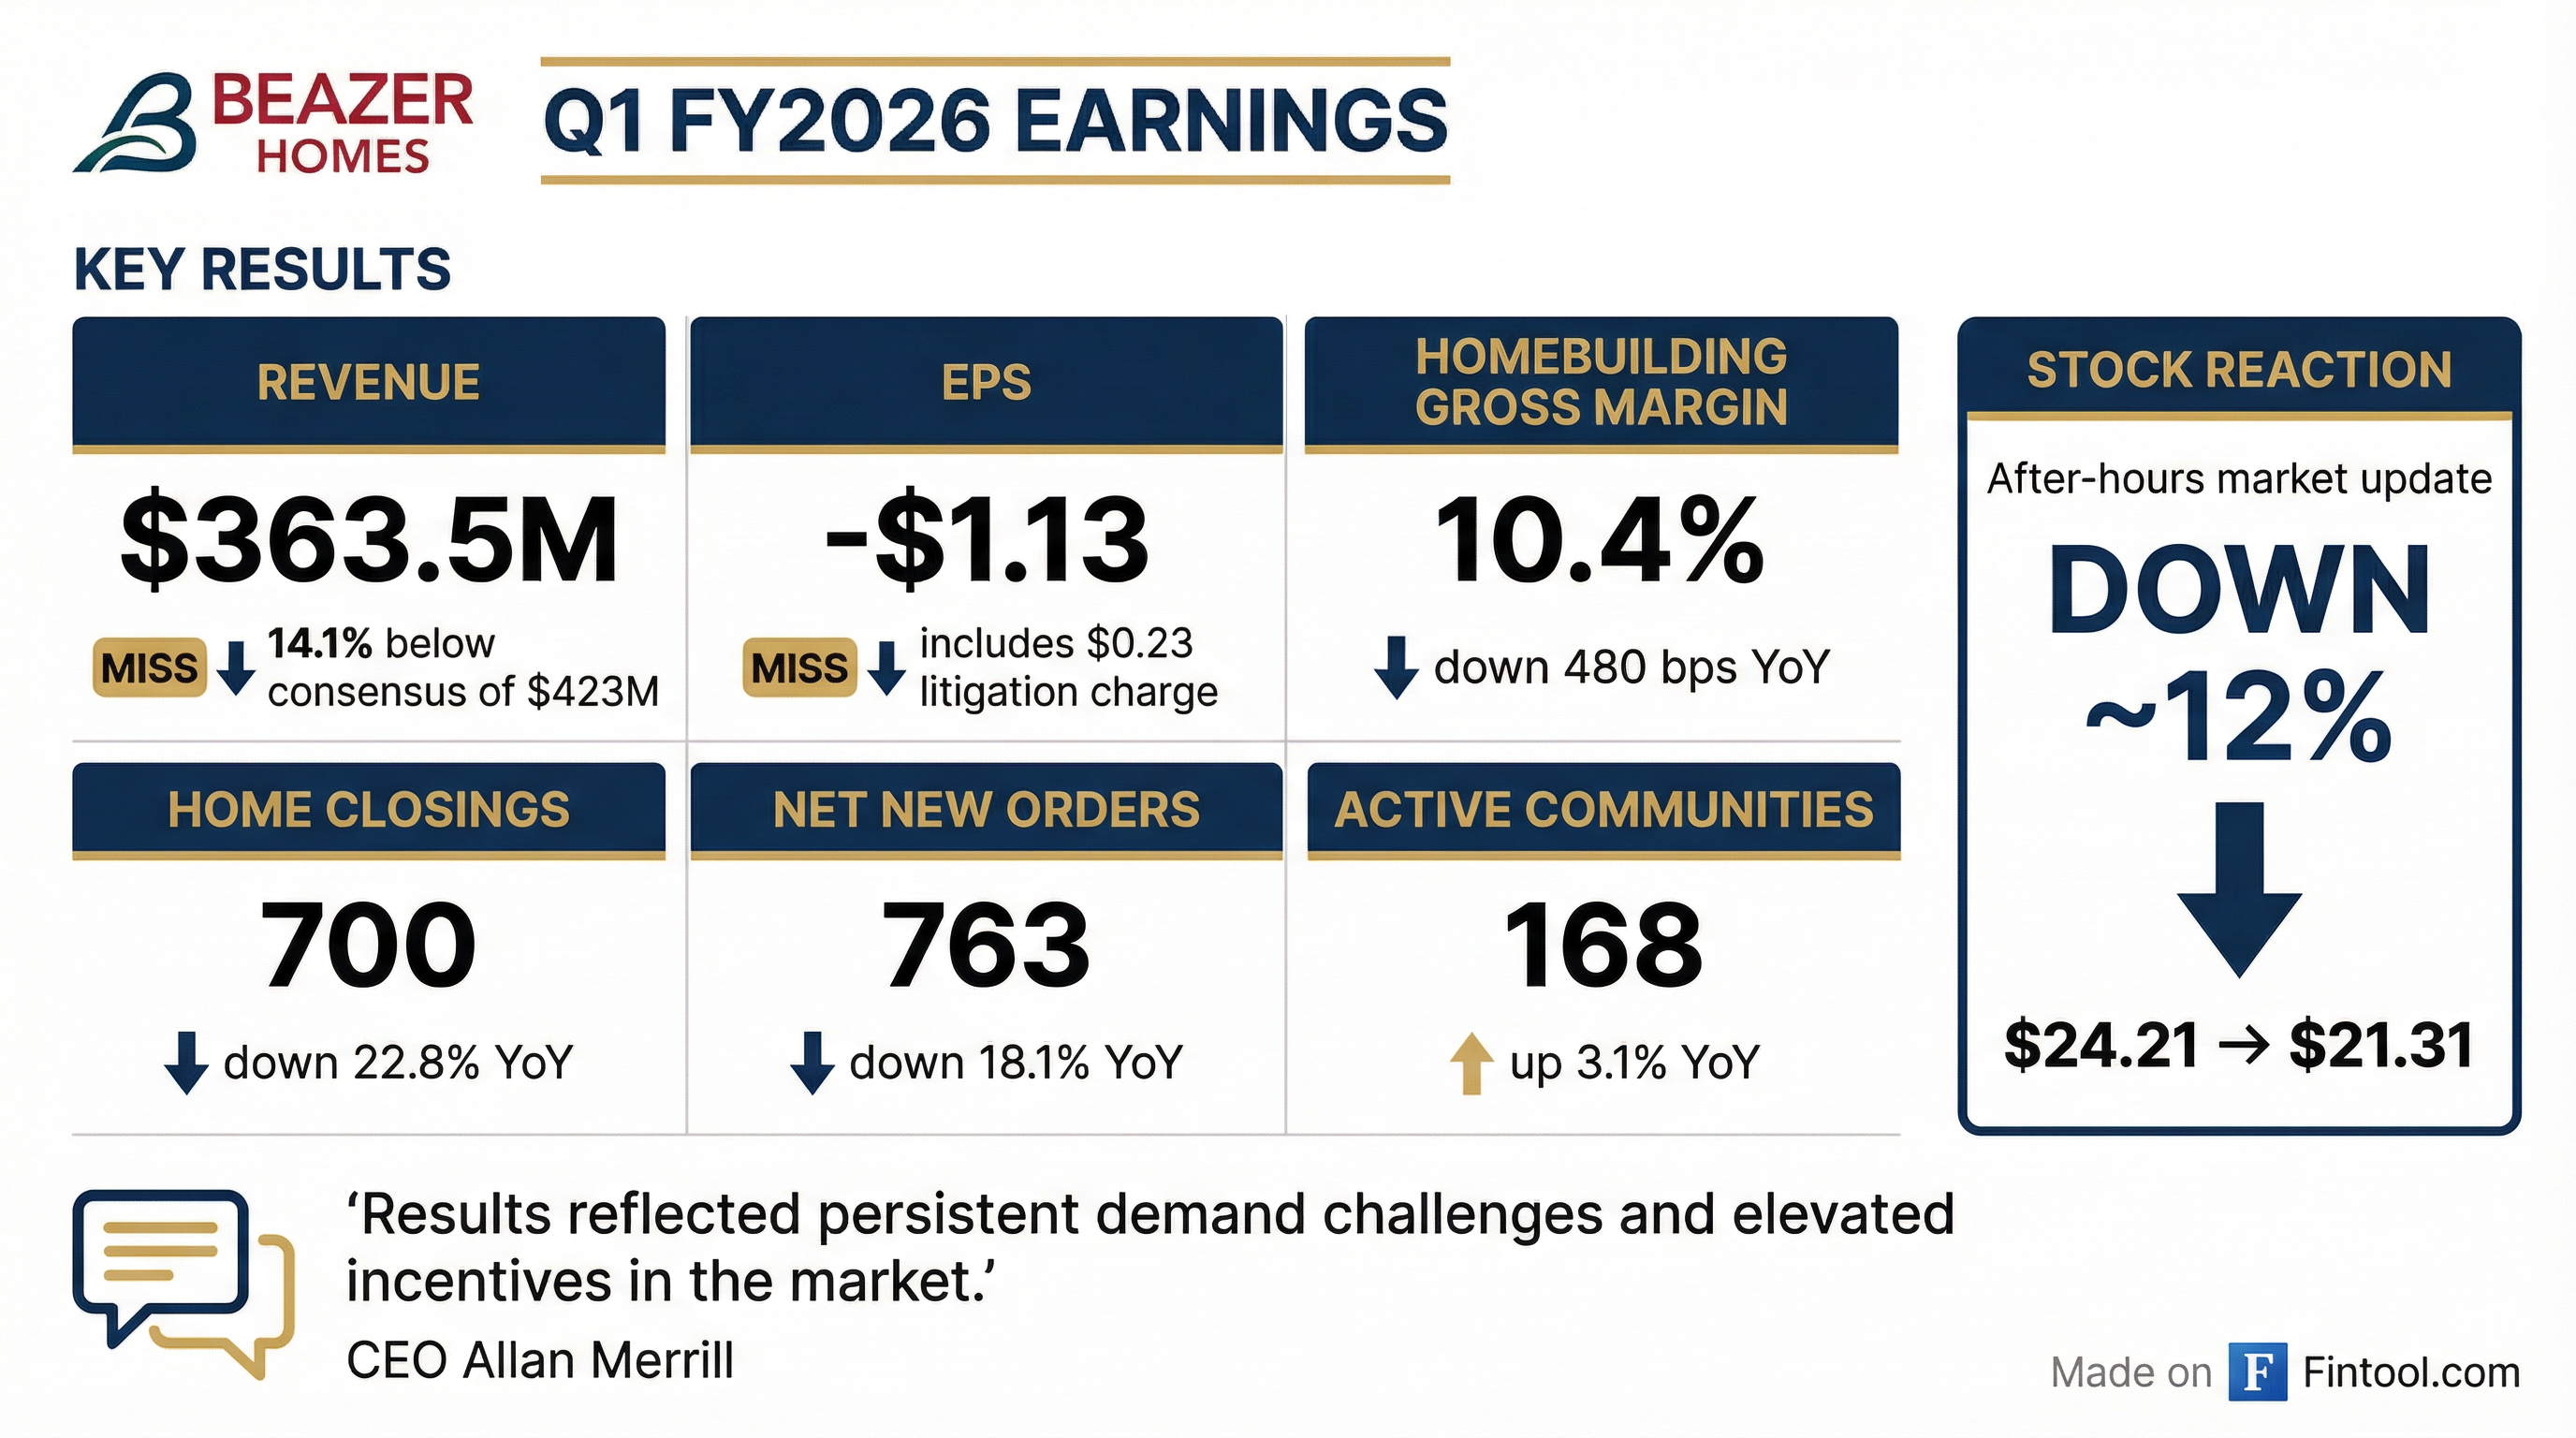
Beazer Homes (NYSE: BZH) reported a brutal fiscal Q1 2026, with results significantly worse than Wall Street anticipated on nearly every metric. Revenue of $363.5M missed consensus by 14%, while a net loss of $1.13 per share came in more than double the expected $0.49 loss — sending shares down 12% after hours to $21.31.
The quarter was marred by a 22.8% year-over-year decline in home closings, margin compression of 480 basis points, and a litigation-related charge that impacted EPS by $0.23.
Did Beazer Homes Beat Earnings?
No — this was a significant miss across the board.
The company reported a net loss of $32.6 million compared to net income of $3.1 million in Q1 FY2025. A litigation-related charge reduced diluted EPS by $0.23, meaning the underlying loss was approximately $0.90 per share — still nearly double the expected loss.
Adjusted EBITDA swung to a loss of $11.2 million versus positive $23.0 million in the year-ago quarter.
What Changed From Last Quarter?
The deterioration from Q4 FY2025 to Q1 FY2026 was stark:
While Q1 is seasonally weaker for homebuilders, this represented a worse-than-typical seasonal decline. The homebuilding gross margin of 10.4% was down 480 bps year-over-year, with management attributing it to:
- Increased price concessions and closing cost incentives
- Changes in product and community mix
- The litigation-related charge (1.8% impact on margin)
Excluding impairments, abandonments, and amortized interest, homebuilding gross margin was 14.0% — still down 420 bps from 18.2% a year ago.
How Did the Stock React?
BZH shares closed up 2.67% at $24.21 during the regular session before the earnings release. After hours, the stock cratered to $21.31, a decline of approximately 12%.
This continues a volatile pattern for BZH around earnings:
- Q4 2025: Beat by 27.5% → stock fell 1.7%
- Q3 2025: Missed by 33.3%
- Q2 2025: Beat by 55.6%
- Q1 2025: Missed by 67.7%
The company has alternated between beats and misses over the past four quarters, making it difficult for investors to price in expectations.
What Did Management Say?
CEO Allan Merrill acknowledged the soft start but highlighted emerging positive signals:
"We began fiscal 2026 in a stubbornly soft demand environment, but stayed focused on actions within our control that can drive timely and measurable progress toward our 2026 and multi-year goals."
Critically, Merrill noted a potential inflection in demand trends:
"Since mid-December, we've seen better traffic and buyer engagement. In fact, January sales pace has been in line with the prior year after 8 quarters of year-over-year pace compression."
On the company's differentiation strategy and "Enjoy the Great Indoors" branding:
"The focus of our message is a more comfortable and healthier home and dramatically lower utility bills. This is a message other builders can't deliver, and it amounts to thousands of dollars in savings per year for most customers."
On solar economics and reducing installation costs:
"Working with our partners, we've been able to reduce installation costs from more than $4 per kWh to less than $2, and we know we can drive it even lower. Results thus far are promising. Home buyer enthusiasm has been strong, and margins in our fully solar communities are among the very best in the company."
On the path forward despite the miss:
"Whether we're able to achieve our [EBITDA growth] goal will depend on stability and normalization in market conditions, but we're working very hard to make it happen... We're fully committed to driving book value per share growth this year, independent of EBITDA growth."
Q&A Highlights
On Margin Spread Between Build-to-Order vs. Specs
Analyst (Alex Riegel, Texas Capital Securities): What is the gross margin spread between a build-to-order versus a spec home?
CFO Dave Goldberg: "It depends widely, but it has always been in the 4%-5% range, and I would say that's probably gotten a little wider in the last year... it's 400 or 500+ basis points."
Key takeaway: With specs at 70% of closings but only 61% of sales in Q1, the shift toward to-be-built could add meaningful margin uplift.
On What's Driving Improved Traffic
Analyst (Alex Riegel): What's driving the improved traffic in late December and January?
Goldberg: "Rates have moved down a little bit. Home prices have stabilized or, on a net basis, have come down. Incomes have kept moving forward. So we're a lot closer to that low 20% affordability band that has characterized really healthy housing demand... We shouldn't overlook that is going on in the background."
He added that newer communities with energy-efficient features are generating strong traction: "The combination of things I think we're doing and this improving affordability backdrop is what's contributing to what we've seen from a traffic and sales progression over the last month."
On Solar-Included Homes Contribution
Analyst (Julio Romero, Sidoti): When do you expect Solar-Included Homes to flow through orders and closings, and how accretive are they?
Goldberg: "We're trending toward 20% of our business at the end of the year will be in solar-included communities... Solar-included communities definitely have higher margins than not just the average, but even of similar generation communities. They are accretive."
He highlighted Las Vegas and Phoenix as key solar markets, with expansion into Georgia and South Carolina.
On Inventory Positioning
Analyst (Rohit Seth, B. Riley): How is your inventory positioning heading into the new year?
Goldberg: "It's very healthy. We've got a combined spec position in the 6s per community down from in the 7s. So it's a little bit lighter like everybody else's. The finished inventory, I think, is in great spot for the spring selling season."
On Cycle Time Improvements
Goldberg: "In the first quarter, we reduced our cycle time by about two calendar weeks... In most of our markets now, we're in April or May [cutoff for closing by fiscal year-end]. That really helps—it's like adding 2 weeks to your fiscal year if you compress cycle time by 2 weeks."
On Q1 Miss Context
Analyst (Natalie Kulasekere, Zelman): What happened in Q1—was it particular markets underperforming?
Goldberg: "We're probably between 100-150 sales short of where we thought we would be, which is less than one home per community over the course of the quarter. First quarter normally represents about 15% of our order volume... We get into this dynamic where people are discounting like crazy to hit their fiscal year-end goals. I understand it, but this was a year where we just decided this was not the time to be particularly aggressive."
On Back-Half Sales Pace Assumptions
Analyst (Tyler Batory, Oppenheimer): Is 2.5 sales pace in 2H achievable in the current backdrop?
Goldberg: "We certainly think it's achievable... If you look at historical trends, that's actually below what we've done in Q3, Q4. So we think at a more normalized market with inventory levels coming down, some improvement in buyer demand that we've seen already into January, if that persists, it certainly is an achievable level."
Key Operating Metrics
Orders and Backlog
The 33% decline in backlog units is particularly concerning as it sets up weaker closings in coming quarters. The average selling price in backlog increased 5% YoY due to product and community mix changes.
Regional Performance
The West region represents 62% of closings but saw nearly 25% year-over-year decline with the steepest margin compression at -440 bps. The East showed the most margin resilience with only -40 bps decline, while the Southeast saw ASP increase 11% YoY to $533.4K.
Margin Catalysts for 2H FY2026
Management outlined specific catalysts for approximately 300 basis points of margin expansion between Q1 and year-end:
Key Details:
- Labor and material savings: "We've reduced labor and material construction costs by more than $10,000 per home, or nearly 200 basis points, which should be reflected in our third and fourth quarter results."
- New community contribution: Newer communities (started selling April 2025+) were just 10% of Q1 revenue but are projected to reach 50% of Q4 revenue with substantially higher ASPs and margins
- TBB mix shift: Specs were 70% of closings but only 61% of sales — if to-be-built trend continues, it adds margin (4-5%+ spread vs specs)
Solar Strategy
Beazer is expanding its solar offering, expecting ~20% of sales to be solar-included homes with margins above company average by year-end. The company positions itself as "America's #1 Energy-Efficient Homebuilder" with an average HERS score of 32 in fiscal 2025 — the lowest among the top 30 homebuilders.
Capital Allocation
Despite the weak quarter, Beazer continued returning capital to shareholders:
- Share Repurchases: $15.1 million at an average price of $21.72
- Remaining Authorization: $72 million — management plans to fully execute in FY26
- Land Spending: $180.7 million (down 14.5% YoY)
- Non-Strategic Land Sales: Transactions above book value in aggregate
- Controlled Lots: 24,832 (down 14.0% YoY)
The company has increased its option-controlled land to 61.0% of active lots, up from 58.9% a year ago, reducing capital intensity. Management is moderating land spend while increasing non-strategic land sales to fund share buybacks below book value.
Balance Sheet & Liquidity
Leverage ticked higher due to the operating loss and increased inventory. Total inventory rose to $2.14 billion from $2.03 billion at fiscal year-end.
Tax Benefits
Beazer's deferred tax asset provides significant shielding:
- DTA shields: Over $500 million of pretax income from federal taxes
- Cash taxes FY27-FY29: Expect minimal cash tax payments
- Net DTA: $142.0 million as of December 31, 2025 (up from $131.1 million YoY)
- GAAP tax rate: Between 23% and 28%
Important: No new energy efficiency tax credits will be generated after June 30, 2026, though all existing credits remain available for up to 20 years.
What Did Management Guide?
Q2 FY2026 Specific Outlook
Full-Year FY2026 Drivers
Management outlined drivers with varying visibility:
Higher Visibility (More Control):
- Higher ASP in 2H, supported by current backlog
- Cost and mix margin catalysts materialize in 2H
- Continued SG&A cost discipline
- ~$150 million of profitable land sales
More Uncertainty (Market Risk):
- Stable incentive environment
- Sales pace over 2.5 in 2H
Multi-Year Goals (2027 Targets)
Management targets a mid-$50s book value per share by FYE 2027.
Risk Factors Highlighted
Management flagged several macro headwinds in the filing:
- Macroeconomic uncertainty including inflation and elevated interest rates
- Historic changes in U.S. trade policy and potential tariff impacts
- Insurance cost increases
- Consumer sentiment weakness
- Labor shortages and supply chain challenges
The litigation-related charge was not fully explained but materially impacted results. Investors should monitor for additional disclosure.
Forward Catalysts
Positive:
- January inflection: Sales pace in line with prior year for the first time in 8 quarters
- Traffic improving: Mid-December onward saw better traffic and buyer engagement
- Affordability improving: Combination of rate declines, stable home prices, and wage growth closing gap to healthy affordability band
- Community count up 3.1% with path to >200 by FYE 2027
- Cost reduction initiatives: >$10,000/home (~200 bps) in labor and material savings
- ~$150M profitable land sales to fund $72M in remaining buybacks
- Solar strategy: Trending to 20% of sales with above-average margins by year-end
- Cycle time improvement: ~2 weeks reduction expands selling window
Negative:
- Weak backlog (down 33%) sets up difficult comparisons
- Margin pressure likely to persist in near-term
- Rising leverage limits financial flexibility
- Litigation overhang and potential additional charges
- Energy efficiency tax credits ending June 30, 2026
The Bottom Line
Beazer Homes delivered a quarter to forget, with results significantly below expectations despite low consensus estimates. The combination of weak demand, margin compression, and a litigation charge created a perfect storm that sent shares tumbling after hours.
However, the earnings call revealed a potentially important inflection point: January sales pace was in line with prior year for the first time in 8 quarters of year-over-year compression. Combined with improving traffic since mid-December and a slowly improving affordability backdrop, management sees a path to recovery.
Despite the soft start, management maintains a path to full-year EBITDA growth (excluding the Q1 litigation-related charge) through:
- ~300 bps of margin expansion via cost cuts and mix shift
- ASP growth supported by backlog (~$560K vs ~$514K Q1 closings)
- ~$150M of profitable land sales
While the 33% decline in backlog and sub-14% gross margins suggest meaningful headwinds ahead, the company's strategy of selective land sales and aggressive share buybacks ($72M remaining authorization, ~10% of shares at current prices) may help achieve the target of 5-10% book value per share growth by year-end.
At ~$21 per share (post-earnings), BZH trades at roughly 0.5x book value of ~$41 per share — reflecting the market's skepticism about near-term earnings recovery. Investors will need to see the January improvement sustained through spring selling season before sentiment improves.
Based on 8-K filing and earnings conference call held January 29, 2026.
Related Links: