CHAIN BRIDGE BANCORP (CBNA)·Q4 2025 Earnings Summary
Chain Bridge Bancorp Beats Q4 Estimates as Political Deposits Surge
January 28, 2026 · by Fintool AI Agent
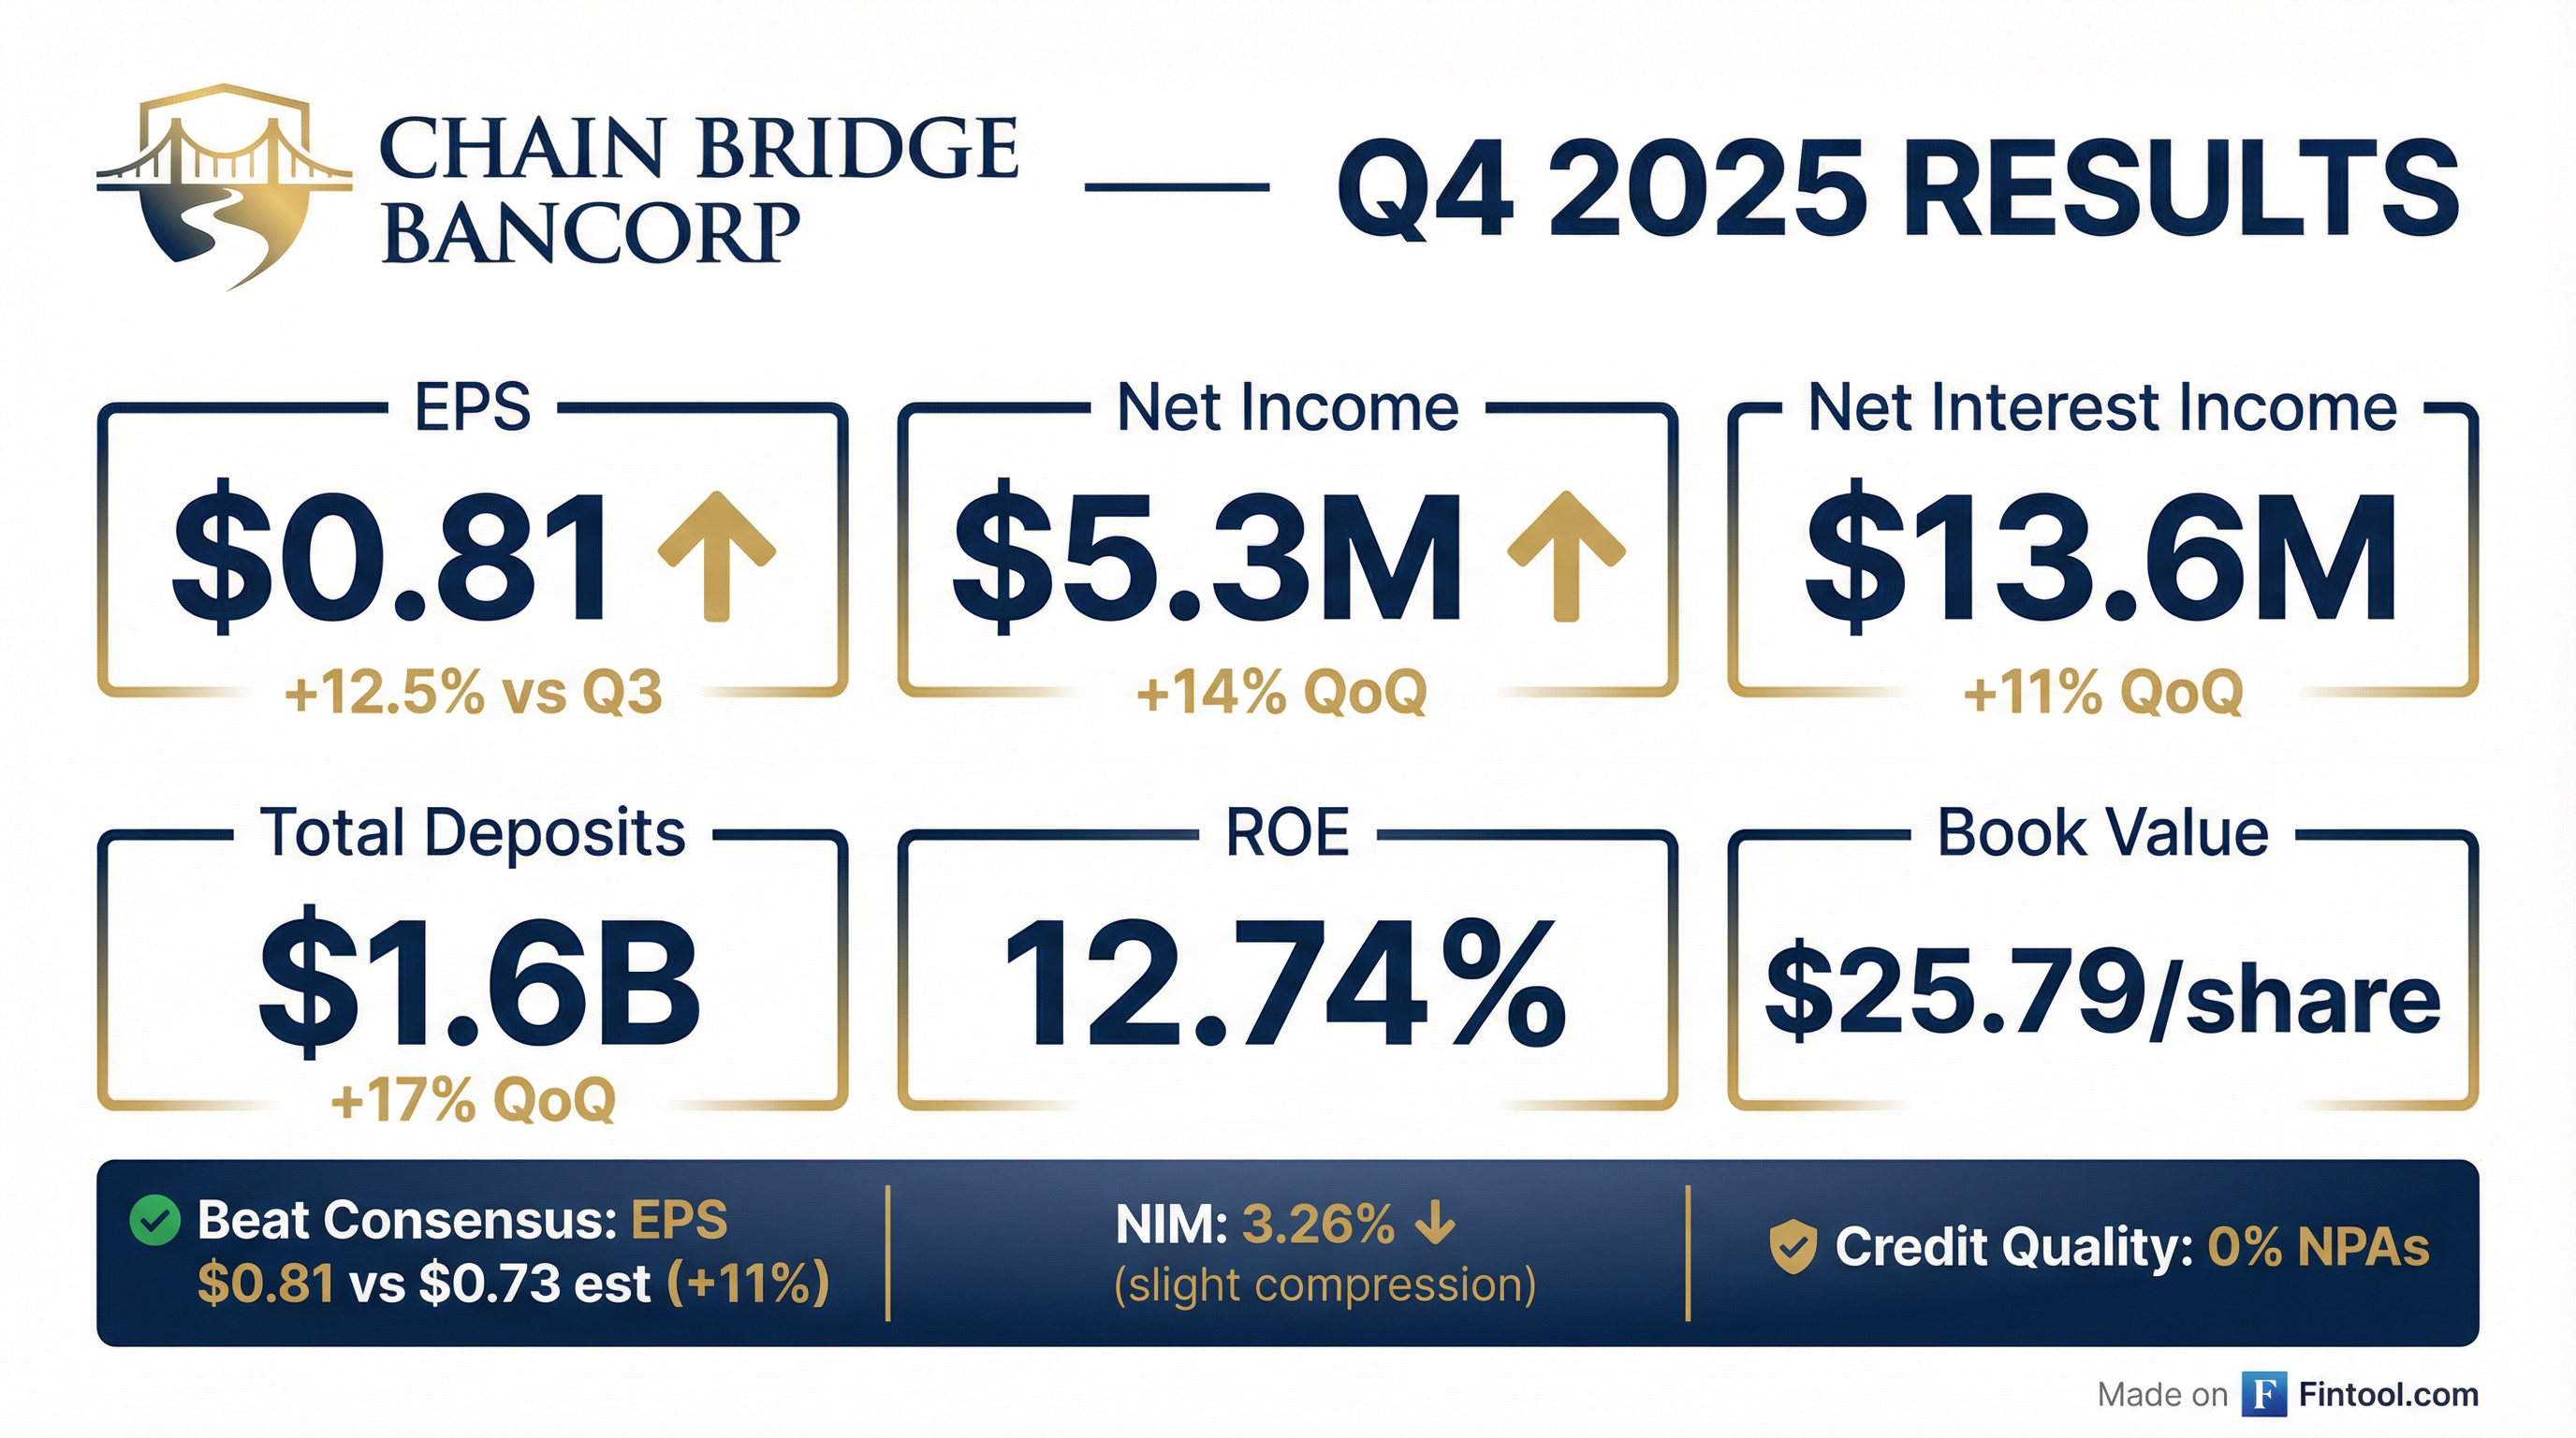
Chain Bridge Bancorp (NYSE: CBNA) delivered a strong Q4 2025, reporting EPS of $0.81 that beat consensus estimates by 11% . The McLean, Virginia-based bank saw deposits surge to $1.6 billion, up 17% quarter-over-quarter, driven by political organization inflows following the November 2024 federal elections .
Did Chain Bridge Bancorp Beat Earnings?
Yes. CBNA exceeded expectations across key metrics:
The beat was driven by a $1.3 million increase in net interest income from higher average interest-earning assets, despite a decline in the Federal Reserve's interest rate paid on reserve balances .
Compared to Q4 2024, net income rose 43% from $3.7 million to $5.3 million, reflecting the company's strong growth trajectory since its October 2024 IPO .
What's Driving the Deposit Surge?
Political organization deposits are CBNA's defining characteristic—and Q4 2025 showcased this unique business model. Key deposit metrics:
The company noted: "Our political depositors typically exhibit heightened activity during the quarters leading up to a federal election, contributing to the increase in balance sheet deposits and One-Way Sell deposits as of December 31, 2025 compared to September 30, 2025" .
The $213.5 million year-over-year increase in One-Way Sell deposits and $323.3 million increase in total consolidated deposits were partially attributed to political organization deposit inflows .
How Did Net Interest Margin Perform?
NIM compressed modestly but remains healthy:
The NIM decline reflects lower short-term interest rates—the yield on interest-bearing deposits at other banks fell from 4.43% in Q3 to 3.97% in Q4 . However, volume growth more than offset rate compression, pushing net interest income higher.
For full year 2025, net interest income reached $51.5 million, up 16% from $44.4 million in 2024 .
What About Credit Quality?
Pristine. CBNA reported:
- Non-performing assets to total assets: 0.00%
- Net charge-offs: 0.00%
- Allowance for credit losses on loans: 1.49% of gross loans
- Loan-to-deposit ratio: 17.46%
The extremely low loan-to-deposit ratio reflects CBNA's conservative balance sheet management—the bank holds the majority of deposits in interest-bearing reserves at the Federal Reserve ($580.9M) and investment securities ($865.3M) rather than loans ($274.8M) .
How Is Capital Position?
Well-capitalized with significant buffers:
Stockholders' equity grew $25.0 million during 2025 to $169.2 million, driven by net earnings of $20.2 million and a $4.7 million reduction in accumulated other comprehensive loss from improved securities valuations .
What's the Full Year Picture?
FY 2025 vs FY 2024 shows a nuanced story:
The EPS decline is primarily a math effect from the IPO—2024's EPS was calculated over fewer shares pre-IPO, while 2025 reflects the full diluted share count of 6.56 million shares .
The real story: deposit placement services income dropped $5.3 million YoY (from $6.2M to $838K) as the company retained more deposits on-balance-sheet as reciprocal ICS deposits post-IPO rather than placing them off-balance-sheet as One-Way Sell deposits .
Trust & Wealth Division Growth
A bright spot with AUA growing 85% YoY:
The increases reflect account growth, asset inflows, and market performance .
How Did the Stock React?
CBNA shares closed at $33.15 on January 28, 2026, down 0.8% on the day of the earnings release. The stock has performed well since its October 2024 IPO at ~$22, gaining approximately 50% in just over a year.
At current prices, CBNA trades at:
- 1.29x Book Value ($33.15 / $25.79)
- 10.8x TTM EPS ($33.15 / $3.08)
Key Risks to Watch
The company's risk factors center on deposit concentration :
- Political deposit cyclicality: Deposits typically surge before elections and decline after, creating balance sheet volatility
- Concentration risk: A small number of large political organization clients represent significant deposit balances
- Rate sensitivity: With $581M in Fed reserve balances, NIM is highly sensitive to Fed Funds rate changes
- Public company costs: The company cited increased expenses from its transition to public company status
The Bottom Line
Chain Bridge Bancorp delivered a solid Q4 beat driven by its unique political depositor franchise. The 11% EPS surprise and 17% QoQ deposit growth demonstrate the business model's strength, even as NIM compressed modestly from Fed rate cuts. With pristine credit quality, strong capital ratios, and a growing wealth management business, CBNA enters 2026 on solid footing—though investors should watch for typical post-election deposit normalization in the quarters ahead.
Data sourced from Chain Bridge Bancorp Q4 2025 8-K filing dated January 28, 2026 . Consensus estimates from S&P Global.