Earnings summaries and quarterly performance for Cboe Global Markets.
Executive leadership at Cboe Global Markets.
Board of directors at Cboe Global Markets.
Alexander J. Matturri, Jr.
Director
Cecilia H. Mao
Director
Edward J. Fitzpatrick
Director
Erin A. Mansfield
Director
Ivan K. Fong
Director
James E. Parisi
Director
Janet P. Froetscher
Director
Jennifer J. McPeek
Director
Jill R. Goodman
Director
Roderick A. Palmore
Director
William M. Farrow, III
Chairman
Research analysts who have asked questions during Cboe Global Markets earnings calls.
Alex Kramm
UBS Group AG
6 questions for CBOE
Patrick Moley
Piper Sandler & Co.
6 questions for CBOE
Ashish Sabadra
RBC Capital Markets
5 questions for CBOE
Brian Bedell
Deutsche Bank
4 questions for CBOE
Daniel Fannon
Jefferies Financial Group Inc.
4 questions for CBOE
Kwun Sum Lau
Oppenheimer
4 questions for CBOE
Michael Cyprys
Morgan Stanley
4 questions for CBOE
Alexander Blostein
Goldman Sachs
3 questions for CBOE
Ben Budish
Barclays PLC
3 questions for CBOE
Benjamin Budish
Barclays PLC
3 questions for CBOE
Craig Siegenthaler
Bank of America
3 questions for CBOE
Kenneth Worthington
JPMorgan Chase & Co.
3 questions for CBOE
Kyle Voigt
Keefe, Bruyette & Woods
3 questions for CBOE
Alex Blostein
Goldman Sachs Group, Inc.
2 questions for CBOE
Christopher Allen
Citigroup
2 questions for CBOE
Dan Fannon
Jefferies & Company Inc.
2 questions for CBOE
Eli Abboud
Bank of America
2 questions for CBOE
Jeff Schmitt
William Blair & Company, L.L.C.
2 questions for CBOE
Madeline Daleiden
JPMorgan Chase & Co.
2 questions for CBOE
Anthony Carbon
Goldman Sachs Group Inc.
1 question for CBOE
Ila Abboud
Bank of America
1 question for CBOE
Jeffrey Schmitt
William Blair
1 question for CBOE
Stephanie Ma
Morgan Stanley
1 question for CBOE
William Katz
TD Cowen
1 question for CBOE
Recent press releases and 8-K filings for CBOE.
- Ad hoc group of holders of the Company’s 9.25% Senior Secured Notes and 9.00% Senior Secured Convertible Notes, both due December 31, 2028, agreed to extend forbearance of their rights and remedies until February 27, 2026.
- The agreement prevents noteholders from exercising any remedies under the amended and restated indenture or applicable law during the extension period.
- The Cannabist Company (f/k/a Columbia Care) operates 69 facilities across 11 U.S. jurisdictions, including 54 dispensaries and 15 cultivation and manufacturing sites.
- Cboe Global Markets now offers Russell 2000 Index (RUT) and RUT Weeklys options nearly 24 hours a day, five days a week on its Options Exchange.
- The expansion gives European and Asia Pacific investors the ability to manage U.S. small-cap exposure during their local daytime hours.
- RUT options and Cboe’s Global Trading Hours reached record volumes in 2025, with 0DTE trades representing 23% of total RUT activity in January.
- This nearly 24x5 session complements existing SPX, XSP, and VIX options trading from 8:15 pm to 9:25 am ET.
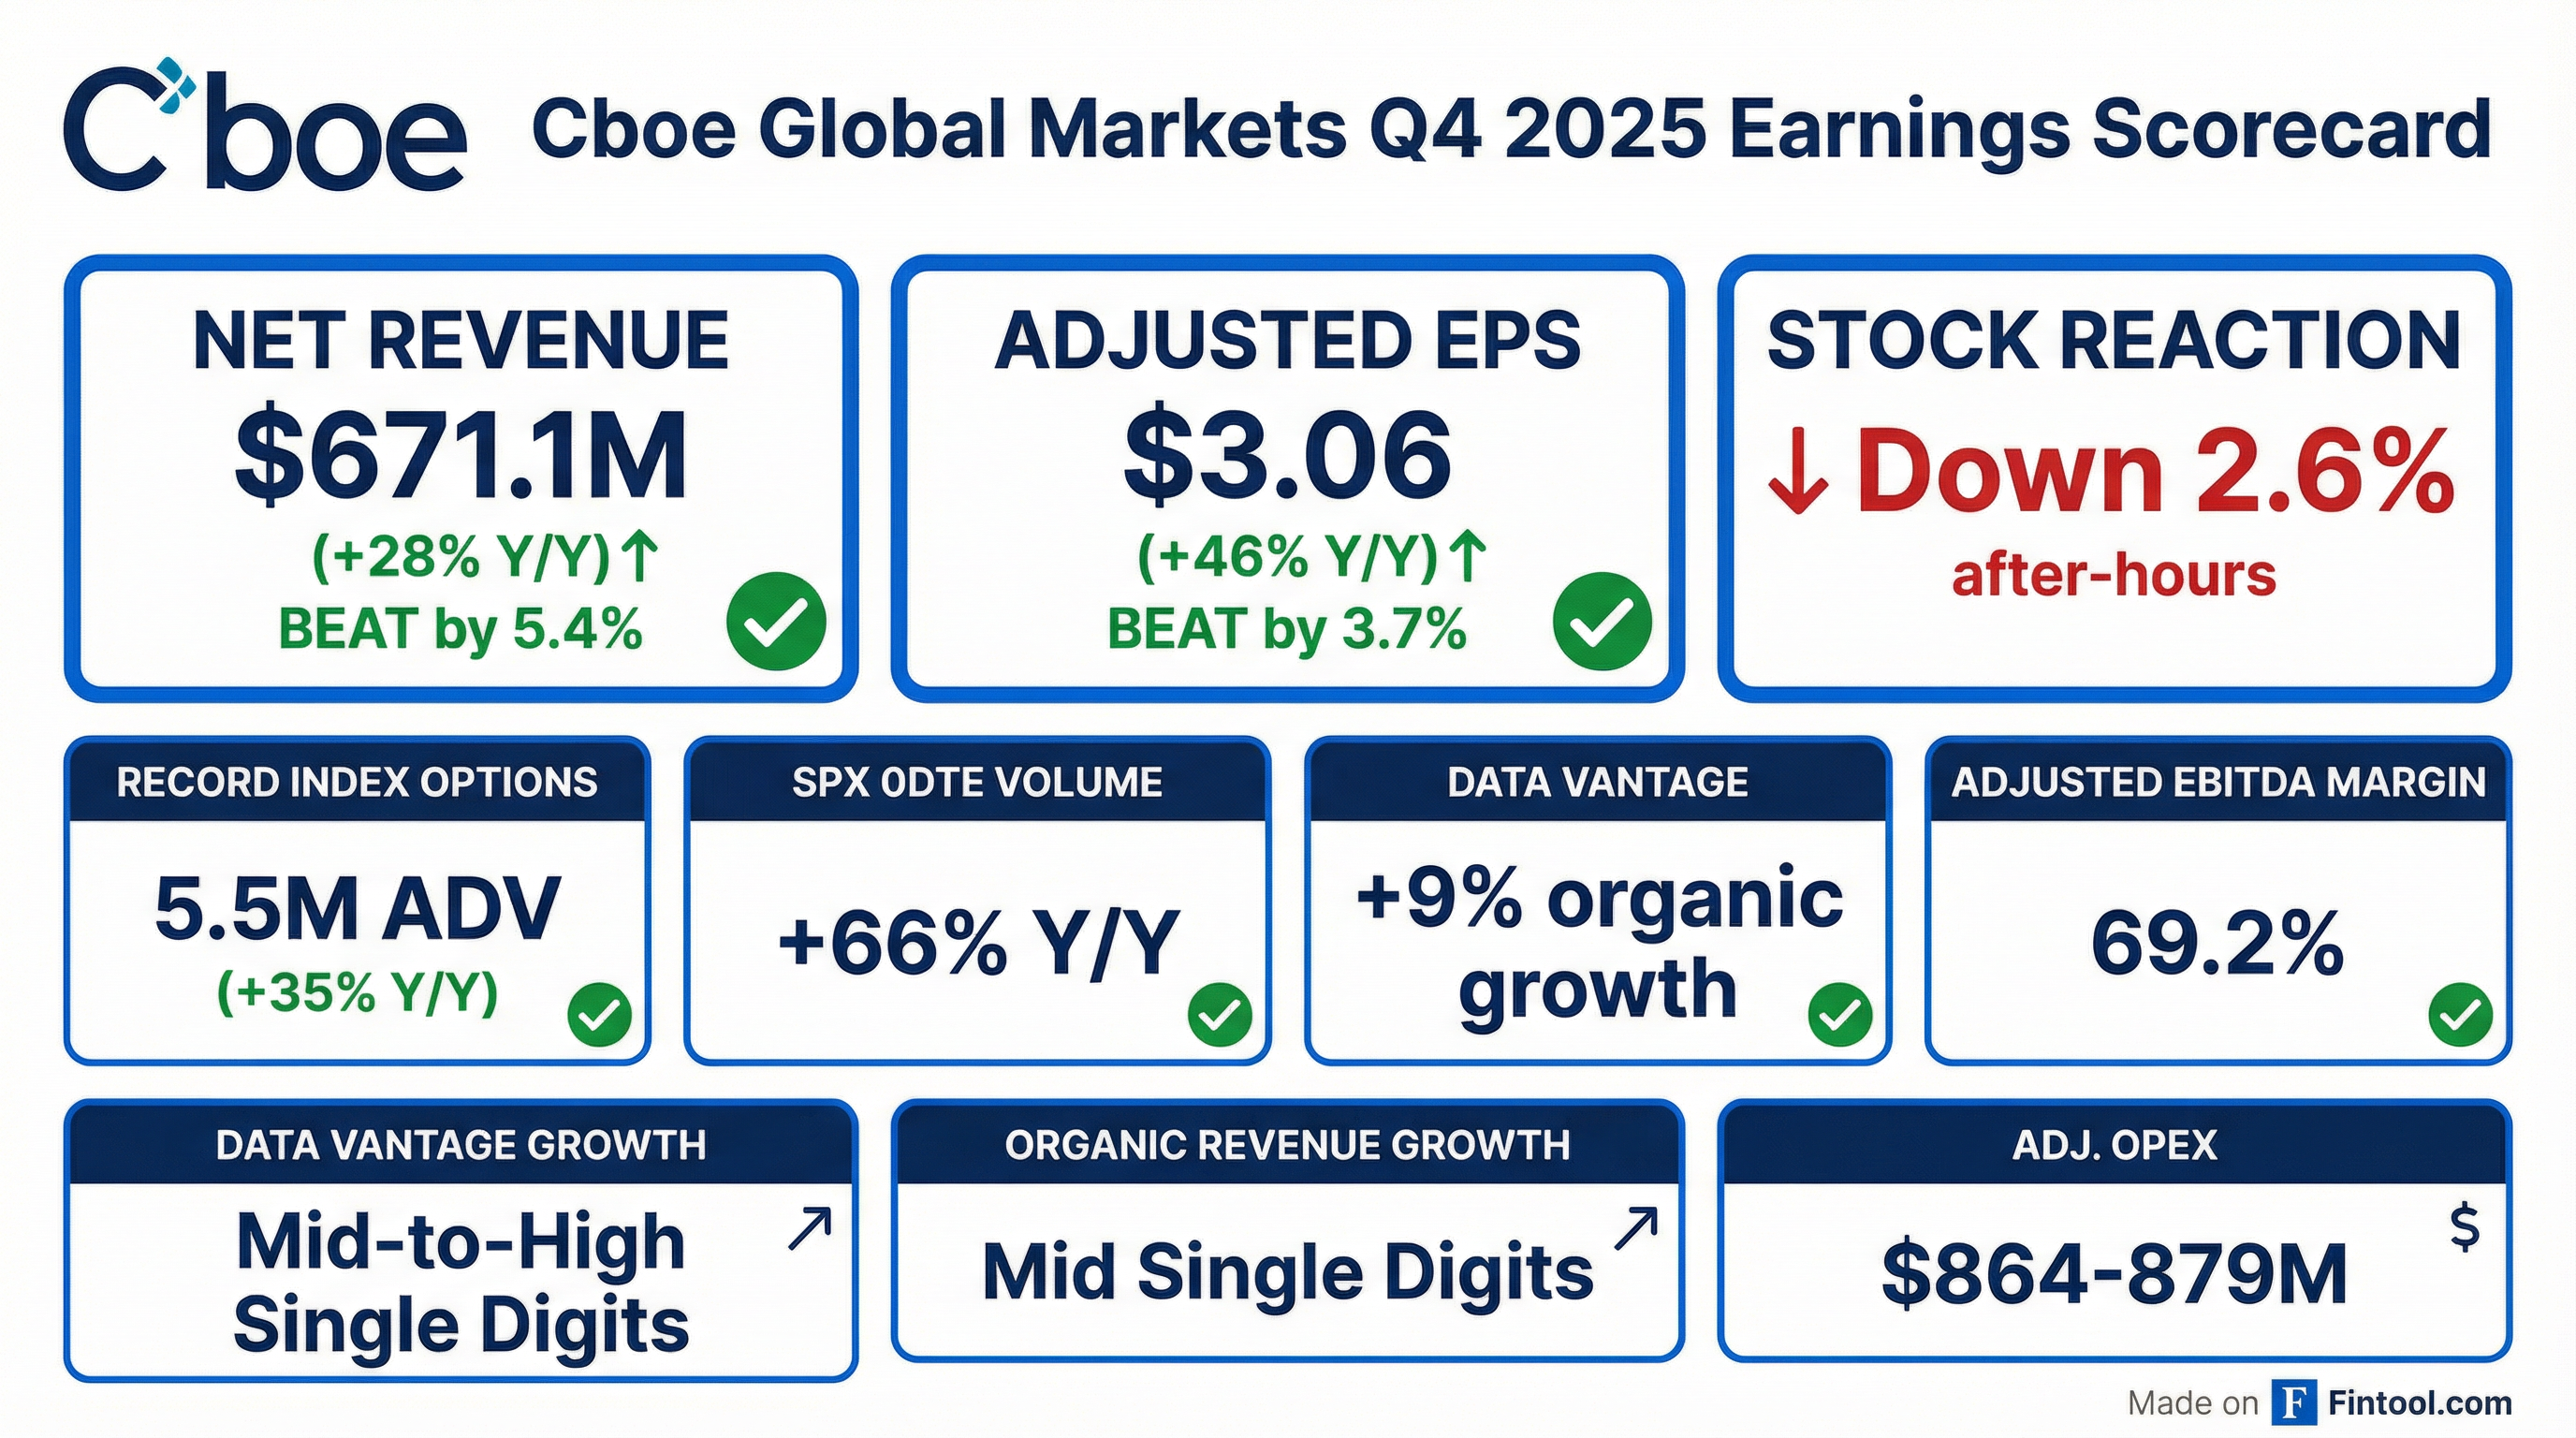
- Cboe delivered $671.1 million in Q4 net revenue, up 28% Y/Y, and $3.06 adjusted EPS, up 46% Y/Y.
- By segment, Derivatives Markets generated $386.0 million (+38% Y/Y), Data Vantage $159.5 million (+9%), and Cash & Spot $125.6 million (+27%).
- Trading metrics hit records: total options ADV rose 24% to a record 18.4 million, total index options ADV reached 5.5 million (+35% Y/Y), and SPX options ADV climbed to 4.3 million (+39% Y/Y) in the quarter.
- Returned $75.8 million in dividends ( $0.72 per share), held $2.217 billion in adjusted cash, and maintained a 0.9x debt/EBITDA ratio at year-end.
- Cboe delivered record Q4 net revenue of $671 million (up 28% YoY) and adjusted diluted EPS of $3.06 (up 46%), and for the full year achieved $2.4 billion in net revenue (up 17%) with EPS of $10.67 (up 24%).
- Derivatives net revenue grew 38% YoY in Q4, driven by record multi-list and proprietary SPX options volumes; SPX zero-DTE ADV rose 66% to a record 4.3 million contracts, representing 61% of SPX volumes.
- Cash & spot markets net revenue increased 27% YoY, led by Europe & APAC (+24%) and global FX (+22%), while Data Vantage revenue rose 9% on robust unit sales and pricing gains.
- For FY2026, the company forecasts mid-single-digit organic net revenue growth (with Data Vantage in the mid-to-high single-digit range) and guides adjusted operating expenses of $864 million–$879 million.
- Cboe has initiated the sale of its Canada and Australia businesses and plans to wind down CEDEX, with these impacts incorporated into the 2026 guidance.
- Cboe delivered record Q4 net revenue of $671 M (+28% YoY) and adjusted diluted EPS of $3.06 (+46%), capping a full-year net revenue of $2.4 B (+17%) and EPS of $10.67 (+24%).
- In Q4 2025, the Derivatives segment grew net revenue 38% YoY, with SPX options ADV at a record 4.3 M contracts and 0DTE strategies comprising over 61% of SPX volume; Cash & Spot Markets revenue rose 27%, and Data Vantage net revenue increased 9%.
- 2026 guidance includes total organic net revenue growth in the mid-single-digit range (Data Vantage mid-to-high single digits), adjusted operating expenses of $864 M–$879 M (+3.3%–5.1%), CapEx $73 M–$83 M, and D&A $56 M–$60 M.
- Announced strategic realignment: initiated sales processes for Cboe Canada and Australia, decided to wind down CEDX, and introduced leadership changes with Heidi Fischer as Cash & Spot Markets head and Scott Johnston as COO (Chris Isaacson to serve as advisor).
- Cboe posted Q4 net revenue of $671 million (+28% YoY) and adjusted diluted EPS of $3.06 (+46% YoY).
- For FY 2025, net revenue reached $2.4 billion (+17% YoY) and adjusted diluted EPS was $10.67 (+24% YoY).
- In Q4, Derivatives net revenue grew 38%, Cash & Spot Markets 27%, and Data Vantage 9%, driven by strong multi-list and index options volumes.
- Cboe began divesting its Canada and Australia units, is winding down CEDEX, and appointed a new COO and head of Cash & Spot Markets.
- 2026 guidance calls for mid-single-digit total organic net revenue growth, Data Vantage mid-to-high single digit growth, and adjusted operating expenses of $864–879 million.
- Cboe delivered record net revenue of $671.1 million, up 28%, and diluted EPS of $2.97, up 60% year-over-year for Q4 2025; full-year net revenue was $2.4 billion, up 17%, with diluted EPS of $10.42, up 45%.
- Across segments, Q4 net revenue growth was 38% in Derivatives, 27% in Cash & Spot Markets, and 9% in Data Vantage, driven by record options volumes and increased average daily volume in index and multi-listed products.
- For 2026, Cboe targets mid single-digit organic net revenue growth, mid to high single-digit Data Vantage growth, and adjusted operating expenses of $864–879 million.
- At December 31, 2025, Cboe held $2.22 billion in cash, paid $75.8 million in dividends ($0.72 per share), and had $614.5 million of remaining share repurchase capacity.
- Record diluted EPS of $2.97 for Q4 (up 60%) and $10.42 for the full year (up 45%)
- Record adjusted diluted EPS of $3.06 for Q4 (up 46%) and $10.67 for the full year (up 24%)
- Record net revenue of $671.1 million for Q4 (up 28%) and $2.4 billion for the full year (up 17%)
- Segment highlights: Derivatives net revenue +38% YoY; Cash & Spot +27%; Data Vantage +9% in Q4
- 2026 outlook: mid single-digit organic total net revenue growth, mid-to-high single-digit Data Vantage growth, and adjusted operating expenses guidance of $864–$879 million
- Multi-listed options ADV reached 14,093k contracts (+7.2% YoY), index options ADV was 5,477k contracts (+20.8% YoY), and futures ADV hit 230k contracts (+4.6% YoY).
- Equities trading saw U.S. on-exchange matched volume of 1,872 mn shares (+14.3% YoY), Canadian equities at 239,258 k shares (+50.3% YoY), and European equities notional ADV of €15,218 mn (+33.2% YoY).
- Global FX set a record monthly ADNV of $67.2 bn, driven by spot ADNV of $63.3 bn and SEF NDF ADNV of $3.9 bn.
- Cboe achieved record volumes in SPX options with 287k contracts in a single GTH session and a monthly ADV record for mini-SPX options at 150k contracts.
- Cboe Europe Periodic Auctions posted a record ADNV of €5.3 bn for January.
- Cboe Global Markets is exploring a relaunch of binary “all-or-nothing” fixed-return options for retail investors, designing a yes-or-no contract that pays a fixed cash amount at expiry.
- The move seeks to compete with prediction-market platforms like Kalshi and Polymarket, which posted over $17 billion in trading volume in January 2026.
- Any new binary contracts would face a lengthy legal and regulatory review, amid state-level enforcement actions and debate over whether they constitute gambling or regulated derivatives.
- Separately, Cboe is pushing to shift more European retail equity trading onto exchanges to boost broker revenues, enhance transparency and capture additional order flow.
Fintool News
In-depth analysis and coverage of Cboe Global Markets.


Quarterly earnings call transcripts for Cboe Global Markets.
Ask Fintool AI Agent
Get instant answers from SEC filings, earnings calls & more