CAMDEN PROPERTY TRUST (CPT)·Q4 2025 Earnings Summary
Camden Property Trust Posts FFO Beat But Stock Drops 2% on Soft 2026 Outlook
February 6, 2026 · by Fintool AI Agent
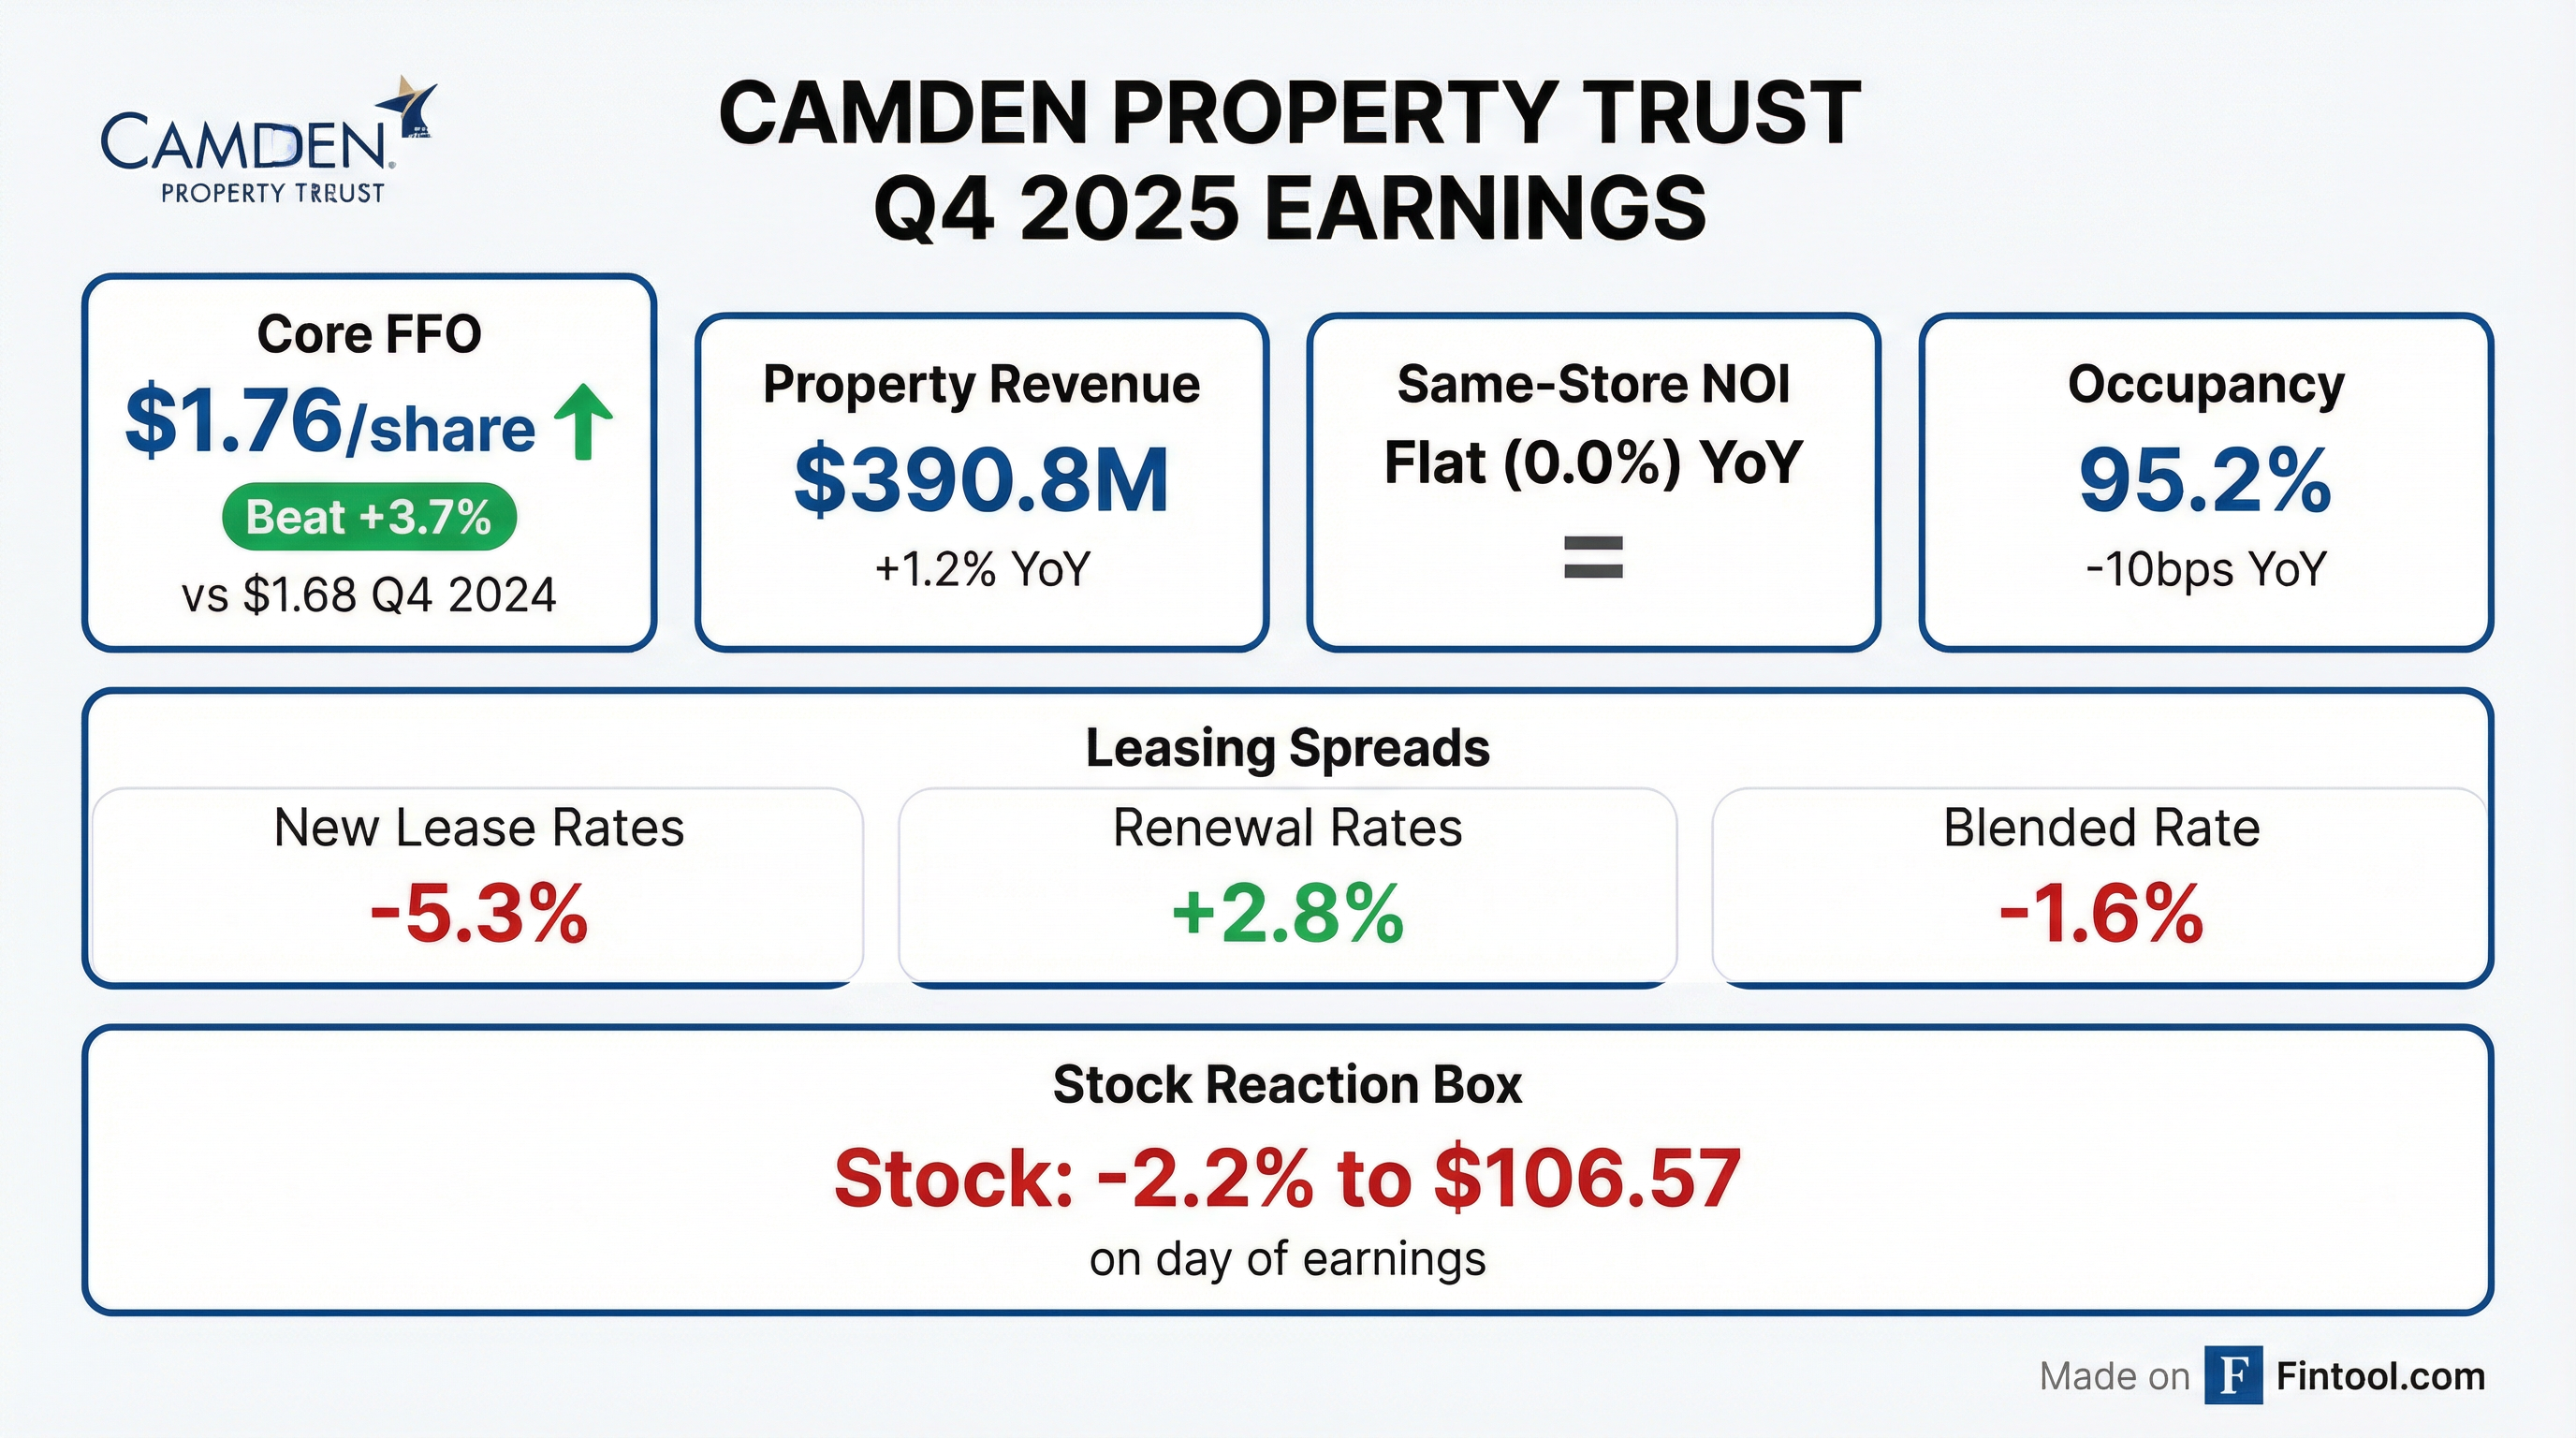
Camden Property Trust (NYSE: CPT) reported Q4 2025 results that topped expectations—Core FFO of $1.73 per share beat guidance—but the stock dropped 2.2% as investors focused on a cautious 2026 outlook. The Sun Belt-focused multifamily REIT guided same-store NOI to decline 0.5% at the midpoint, reflecting persistent supply headwinds and expense pressures.
CEO Rick Campo set the tone with a reference to The Doors: "The future's uncertain, and the end is always near. The end of uncertainty, that is." Despite the headline miss, management expressed confidence that the worst is behind them—new supply is "falling like a knife," 2025 saw one of the highest apartment absorption years in two decades, and the company is accelerating its Sun Belt focus by marketing its entire California portfolio for sale.
Did Camden Beat Earnings?
Yes, Camden beat guidance by $0.03/share:
The $0.03 beat was entirely driven by higher fee and asset management income from third-party construction business, as Camden favorably closed out several jobs that came in well under budget. Property revenues, expenses, and NOI were exactly in line with expectations.
For full-year 2025, Camden exceeded original guidance by $0.13/share—a result CEO Campo noted the team is "celebrating like they just won the Super Bowl."
What Did Management Guide for 2026?
The 2026 outlook was the key driver of the stock's negative reaction. Camden expects Core FFO to decline 2% year-over-year at the midpoint, with same-store NOI facing headwinds from expense growth:
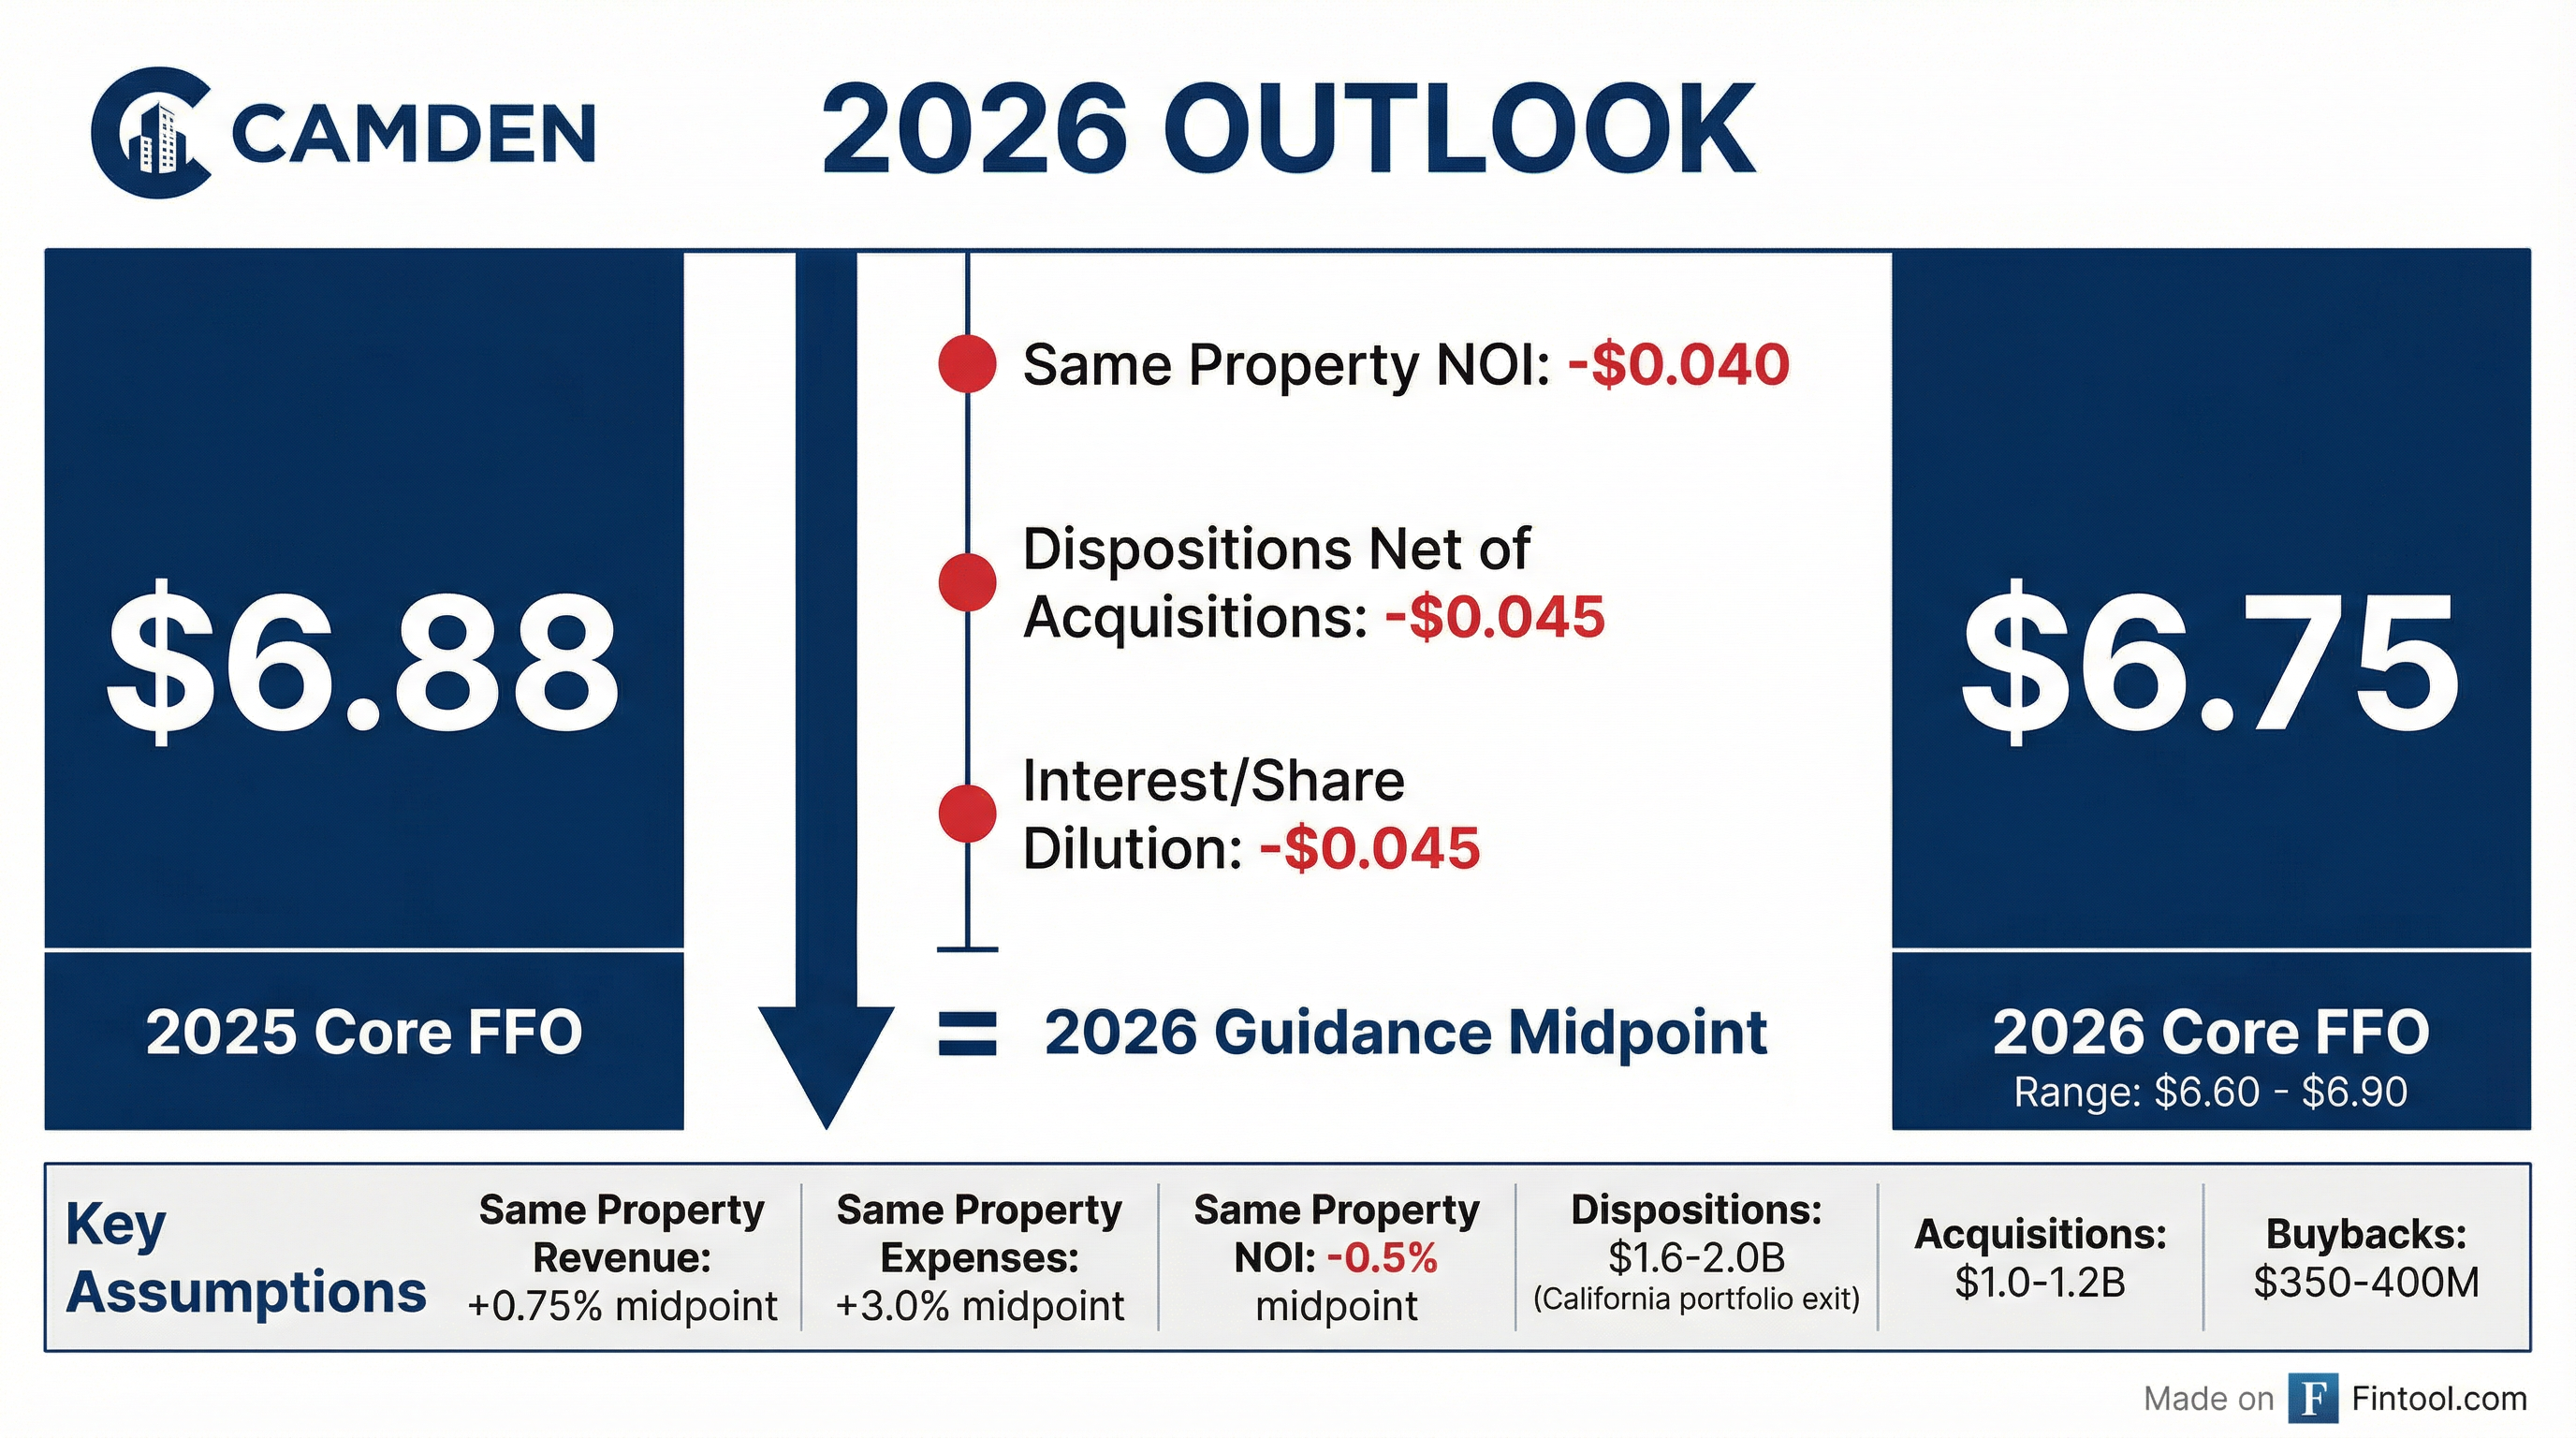
Key drivers of the $0.13/share FFO decline from 2025:
- Same-store NOI drag: -$0.045/share
- Decrease in fee and asset management income: -$0.04/share
- Increase in general overhead and other corporate expenses: -$0.045/share
Q1 2026 Core FFO guidance breakdown (midpoint $1.66 vs $1.76 Q4 actual):
- Expense-driven decrease in same-store NOI: -$0.05/share
- Decrease in fee and asset management income: -$0.04/share
- Higher interest expense (primarily from share repurchases): -$0.04/share
- Decrease in non-same store NOI: -$0.02/share
- Increase in Core FFO from share repurchases: +$0.05/share
How Did the Stock React?
Camden shares fell 2.2% to $106.57 on the day of earnings, underperforming the REIT sector—and continued sliding in afterhours trading to $105.33 (-3.1% from prior close). The stock now trades at a 9% discount to the consensus price target.
The negative reaction despite the FFO beat reflects investor concerns about:
- Soft 2026 same-store guidance – Midpoint NOI growth of -0.5% is below peers
- New lease rate pressure – Spreads worsened to -5.3% from -4.7% in Q4 2024
- Expense growth outpacing revenue – 3% expense growth vs 0.75% revenue growth
What Changed From Last Quarter?
Leasing trends deteriorated further:
New lease rate spreads worsened 60bps sequentially, indicating supply pressures continue in Camden's Sun Belt markets. However, management noted that "the worst appears to be behind us" with 2025 deliveries peaking and construction starts declining sharply.
Portfolio transformation accelerating:
- Acquired Camden Lake Buena Vista (Orlando) for $85.2M
- Sold 3 properties (Houston, Phoenix) for $201M, recognizing $128M gain
- Marketing 11 California communities for sale (strategic exit from CA)
- New $600M share buyback authorization
Capital Allocation: Big Portfolio Shift Underway
Camden is executing a significant capital recycling program—selling $1.6-2.0 billion of assets (primarily California) while buying $1.0-1.2 billion in stronger Sun Belt markets:
California Exit Strategy
Management detailed the planned California portfolio exit:
- 11 operating communities being marketed
- Preliminary value range: $1.5B to $2.0B with mid-year closing expected
- 60% of proceeds for 1031 exchanges → ~$1.1B of acquisitions
- 40% of proceeds for share repurchases → ~$650M of share repurchases
- No accretion or dilution anticipated in 2026
Why now? CEO Rick Campo explained the strategic rationale:
- Sun Belt pivot – Expecting a "turn" in Sun Belt markets; want to be in front of it, not behind
- Strong buyer market – California has been the most vibrant transaction environment; buyers don't need to "pick the bottom"
- Implied cap rate arbitrage – Selling CA at cap rates substantially below CPT's implied stock cap rate
Hidden cost of California: Over the past 5 years, 92% of Camden's political advocacy spend was in California. This 80bps annual NOI drag means California's actual returns have been ~3.2% NOI growth when adjusted, vs. 4% for the rest of the portfolio.
Development Pipeline: Camden has 1,162 apartment homes under construction across three projects—Camden South Charlotte (420 homes, $157M), Camden Blakeney (349 homes, $151M), and Camden Nations in Nashville (393 homes, $184M). Camden Village District in Raleigh (369 homes) recently completed construction and reached 60% leased as of January 2026.
Share buybacks ramped significantly:
- Q4 2025: Repurchased 2.07M shares at $106.82 avg
- Full Year 2025: 2.53M shares at $106.92 avg ($271M total)
- January 2026: 1.1M shares at $110.03 avg ($121M)
- New authorization: $600M available
Management's aggressive buyback activity signals confidence that shares are undervalued at current levels. At $106.57, CPT trades at 15.8x 2026 Core FFO guidance ($6.75 midpoint), below the multifamily REIT average.
Regional Performance: Sun Belt Headwinds Persist
2026 Market Grades
Management provided a market grading framework for 2026, grading the overall portfolio as a B with a stable but improving outlook:
Key market insights:
- D.C. Metro outperformed with 3.5% revenue growth in 2025 despite DOGE concerns; enters 2026 at 96% occupancy
- Austin earned a C+ after being stuck at C- for two years—management expects B or better in 2027 as supply finally slows
- Denver faces headwinds from new utility rebilling regulations (HB 25-1090), not market fundamentals
Q4 2025 Same-Store Results
Same-store results varied significantly by market:
DC Metro led performance with 2.2% NOI growth, benefiting from limited supply. Austin, Phoenix, and Houston—markets facing elevated deliveries—posted the weakest results with NOI declining 4-5%. The California exit should reduce exposure to regulatory risk while concentrating the portfolio in higher-growth (but currently oversupplied) Sun Belt markets.
Balance Sheet: Conservative Leverage
Camden maintains a fortress balance sheet with minimal near-term refinancing risk:
Leverage ticked up due to acquisition activity, but remains conservative relative to peers. Near-term maturities are manageable with $566M due in 2026 at a 5.0% weighted average rate and $172M in 2027 at 3.9%. The company maintains an investment-grade rating (A-/A3) and has $635M of liquidity between cash and its revolving credit facility.
Q&A Highlights: Management's Key Insights
On Rent Growth Inflection
Asked about the probability of new lease rates turning positive in 2026, CEO Rick Campo was confident: "I think it's probable. I think it's probable that it could happen this year." He added that when this inflection occurs, generalist investors will flood back into apartment REITs.
Unprecedented Rent Cycle
Executive Vice Chairman Keith Oden provided striking context: Properties built in the last 5 years are back to 2021 rent levels—year 5 of essentially zero rental growth. In Camden's 35+ year history, they've never had even a 3-year period of flat rents, not even during the GFC or COVID. Meanwhile, residents' incomes are up 4% annually (real) over that period, with rents at just 19% of income.
Urban vs Suburban Trends
CFO Alex Jessett noted that urban assets are now outperforming and starting to "gap out" from suburban properties—a reversal from the past 3-4 years. Class A urban is leading the recovery as it had the most ground to recover.
Denver Utility Regulation Impact
Colorado House Bill 25-1090 (effective January 1, 2026) eliminates common area utility rebilling. Impact to Camden: $1.8M annually or ~19bps of same-store NOI. Camden has sub-metered all Denver properties to capture as much data as possible. Management is not concerned about similar regulations spreading to other Sun Belt markets given their pro-business environments.
Development Cost Tailwinds
Development costs are coming down 5-8%, though projects remain challenging to pencil. New starts are targeting 5-5.5% untrended yields (6% trended). Baker (Denver) and Gulch (Nashville) starts are pushed to late 2026 pending better economics.
Bond Issuance Planned
Camden plans a $400-500M bond transaction later in Q1 2026, providing additional financial flexibility.
What to Watch Going Forward
- New lease rate inflection – Management sees it as "probable" this year; when it happens, could be 8%+ immediate rent increase as concessions burn off
- California disposition pricing – $1.5-2.0B range; execution in mid-2026
- Buyback pace – Already completed ~$400M of planned $650M; shares "screaming buy" per management
- 2026 guidance raises – Conservative initial guide leaves room for upward revisions if supply normalizes faster
- Urban outperformance trend – Class A urban assets could lead the recovery
Source Documents: Q4 2025 Earnings Call Transcript | Q4 2025 Earnings Presentation | Company Page