Earnings summaries and quarterly performance for CAMDEN PROPERTY TRUST.
Executive leadership at CAMDEN PROPERTY TRUST.
Board of directors at CAMDEN PROPERTY TRUST.
Frances Aldrich Sevilla-Sacasa
Director
Heather J. Brunner
Director
Javier E. Benito
Director
Kelvin R. Westbrook
Lead Independent Director
Mark D. Gibson
Director
Renu Khator
Director
Scott S. Ingraham
Director
Steven A. Webster
Director
Research analysts who have asked questions during CAMDEN PROPERTY TRUST earnings calls.
Brad Heffern
RBC Capital Markets
6 questions for CPT
Haendel St. Juste
Mizuho Financial Group
6 questions for CPT
John Kim
BMO Capital Markets
6 questions for CPT
Steve Sakwa
Evercore ISI
6 questions for CPT
Alexander Goldfarb
Piper Sandler
5 questions for CPT
Austin Wurschmidt
KeyBanc Capital Markets Inc.
5 questions for CPT
Rich Hightower
Barclays
5 questions for CPT
Adam Kramer
Morgan Stanley
4 questions for CPT
Alex Kim
Zelman & Associates
4 questions for CPT
Ami Probandt
UBS
4 questions for CPT
Eric Wolfe
Citi
4 questions for CPT
James Feldman
Wells Fargo
3 questions for CPT
Jamie Feldman
Wells Fargo & Company
3 questions for CPT
Julien Blouin
The Goldman Sachs Group, Inc.
3 questions for CPT
Linda Tsai
Jefferies
3 questions for CPT
David Segall
Green Street
2 questions for CPT
Jeffrey Spector
BofA Securities
2 questions for CPT
John Pawlowski
Green Street
2 questions for CPT
Mason Marion
Jefferies
2 questions for CPT
Michael Lewis
Truist Securities, Inc.
2 questions for CPT
Nick Joseph
Citigroup Inc.
2 questions for CPT
Rich Anderson
Cantor Fitzgerald
2 questions for CPT
Robert Stevenson
Janney Montgomery Scott LLC
2 questions for CPT
Wesley Golladay
Robert W. Baird & Co.
2 questions for CPT
Alexander Goldfarb
Piper Sandler Companies
1 question for CPT
Alexander Kim
Zelman & Associates
1 question for CPT
Alex Kalmus
Zelman & Associates
1 question for CPT
Ami
UBS
1 question for CPT
Connor Mitchell
Piper Sandler & Co.
1 question for CPT
Connor Peace
Deutsche Bank
1 question for CPT
Ianna Gallen
Bank of America
1 question for CPT
Jana Galan
Bank of America
1 question for CPT
John Pawlowski
Green Street Advisors LLC
1 question for CPT
Julian Vaughn
The Goldman Sachs Group, Inc.
1 question for CPT
Mason P. Guell
Baird
1 question for CPT
Nick Yulico
Scotiabank
1 question for CPT
Omotayo Okusanya
Deutsche Bank AG
1 question for CPT
Richard Anderson
Wedbush Securities
1 question for CPT
Yann Gallen
Bank of America Corporation
1 question for CPT
Recent press releases and 8-K filings for CPT.
- 2026 Guidance: Core FFO of $6.60–$6.90 per share, FFO $6.46–$6.76 per share, and EPS $0.40–$0.70 per share.
- Southern California Disposition: Marketing an 11-asset, 3,620-home portfolio with preliminary value of $1.5–$2.0 billion; midpoint of $1.75 billion proceeds to fund $1.1 billion of acquisitions and $650 million of share repurchases.
- Capital Markets Activity: Issued $600 million of 10-year senior unsecured notes at 4.9% coupon and repurchased ~1.85 million shares for $203 million at an average price of $109.37 year-to-date.
- Dividend & Liquidity: Increased the 2026 annual dividend to $4.24 per share, maintains $0.9 billion of undrawn credit capacity and an unencumbered asset pool of $17 billion.
- On February 17, 2026, Camden Property Trust entered into an underwriting agreement to issue $600 million of 4.900% Notes due 2036, with the offering closing on February 19, 2026.
- The Notes were offered at 99.936% of par, yielding 4.908%, and will pay interest semiannually on February 28 and August 28, commencing August 28, 2026.
- Net proceeds of approximately $594.0 million are earmarked to repay a portion of the Company’s $1.2 billion revolver, reduce its $600 million commercial paper balance, and support general corporate needs, including acquisitions, development, capex and working capital.
- Notes may be redeemed at any time at a make-whole premium based on Treasury rates +15 bps, or at par plus accrued interest if redeemed on or after November 28, 2035.
- Camden Property Trust issued $600 million of 4.900% senior unsecured notes due February 28, 2036, at 99.936% of par; settlement is February 19, 2026.
- Interest is payable semi-annually on February 28 and August 28, with the first payment on August 28, 2026.
- Net proceeds of approximately $594.0 million will repay a portion of its $1.2 billion revolving credit facility and its $600 million commercial paper program, with any remainder for general corporate purposes.
- Q4 Core FFO was $193.1 million ($1.73 per share), beating the midpoint of prior guidance by $0.03 due to higher fee and asset management income.
- 2026 Core FFO/sh guidance is $6.60–$6.90 (midpoint $6.75), a $0.13 per share decline, reflecting a 50 bp same-store NOI decrease, ~4 cents lower fee income, and higher corporate expenses.
- Marketing 11 California communities, targeting $1.5–$2 billion in proceeds: expecting ~60% reinvestment via 1031 exchanges in Sun Belt and ~$650 million for share buybacks; $400 million repurchased to date; new $600 million authorization approved.
- 2025 same-property revenue growth was +0.76%, with 2026 guidance at 75 bp growth and anticipated improvement in H2 due to declining supply and resilient demand.
- Core FFO of $193.1 M or $1.73 per share, beating the midpoint of guidance by $0.03
- Q4 same-property revenue growth of 76 bps; rental rate change: new leases -5.3%, renewals +2.8%, blended -1.6%
- 2026 guidance: Core FFO $6.60–$6.90 per share (midpoint $6.75), a $0.13/share decrease; same-store NOI -50 bps, revenue growth 75 bps, expense growth 3%
- Strategic actions: sold seven older assets for $375 M and acquired four newer for $423 M; marketing 11 California communities ($1.5–$2 B), planning
$1.1 B 1031 redeployment and $650 M share buybacks ($400 M completed) with new $600 M authorization
- Core FFO for Q4 2025 was $193.1 million, or $1.73 per share, $0.03 above midpoint guidance.
- Full-year 2025 same-property revenue grew 0.76%, beating midpoint guidance by 1 bp; 2026 same-property revenue guidance midpoint is 0.75%.
- 2026 Core FFO per share is guided to $6.60–$6.90 (midpoint $6.75), down $0.13 from 2025.
- Plan to sell 11 California communities for $1.5 billion–$2 billion, reinvest ~60% via 1031 exchanges into Sun Belt markets, and allocate ~$650 million to share repurchases (already $400 million executed; new $600 million authorization).
- 2026 same-store net operating income is expected to decline by 50 bps, with revenue growth of 75 bps and expense growth of 3%.
- 4Q25 Core FFO per share of $1.73 vs guidance midpoint of $1.70, boosted by higher nonrecurring fee and asset management income.
- 2026 Core FFO per share guidance midpoint of $6.75, down 13¢ from 2025’s $6.88, driven by lower fee income, higher corporate overhead, and same-store NOI headwinds.
- In 4Q25, disposed of 3 communities for $201 M and acquired an Orlando community for $85 M; full-year 2025 comprised 7 disposals ($375 M) and 4 acquisitions ($423 M).
- Proposed mid-year sale of 11 California communities valued at $1.5 B–$2.0 B, with
60% of proceeds for 1031 exchanges ($1.1 B of acquisitions) and40% for share repurchases ($650 M). - 2026 same-store revenue growth expected at 0.75%, expenses up 3.0%, leading to a 0.5% decline in same-store NOI.
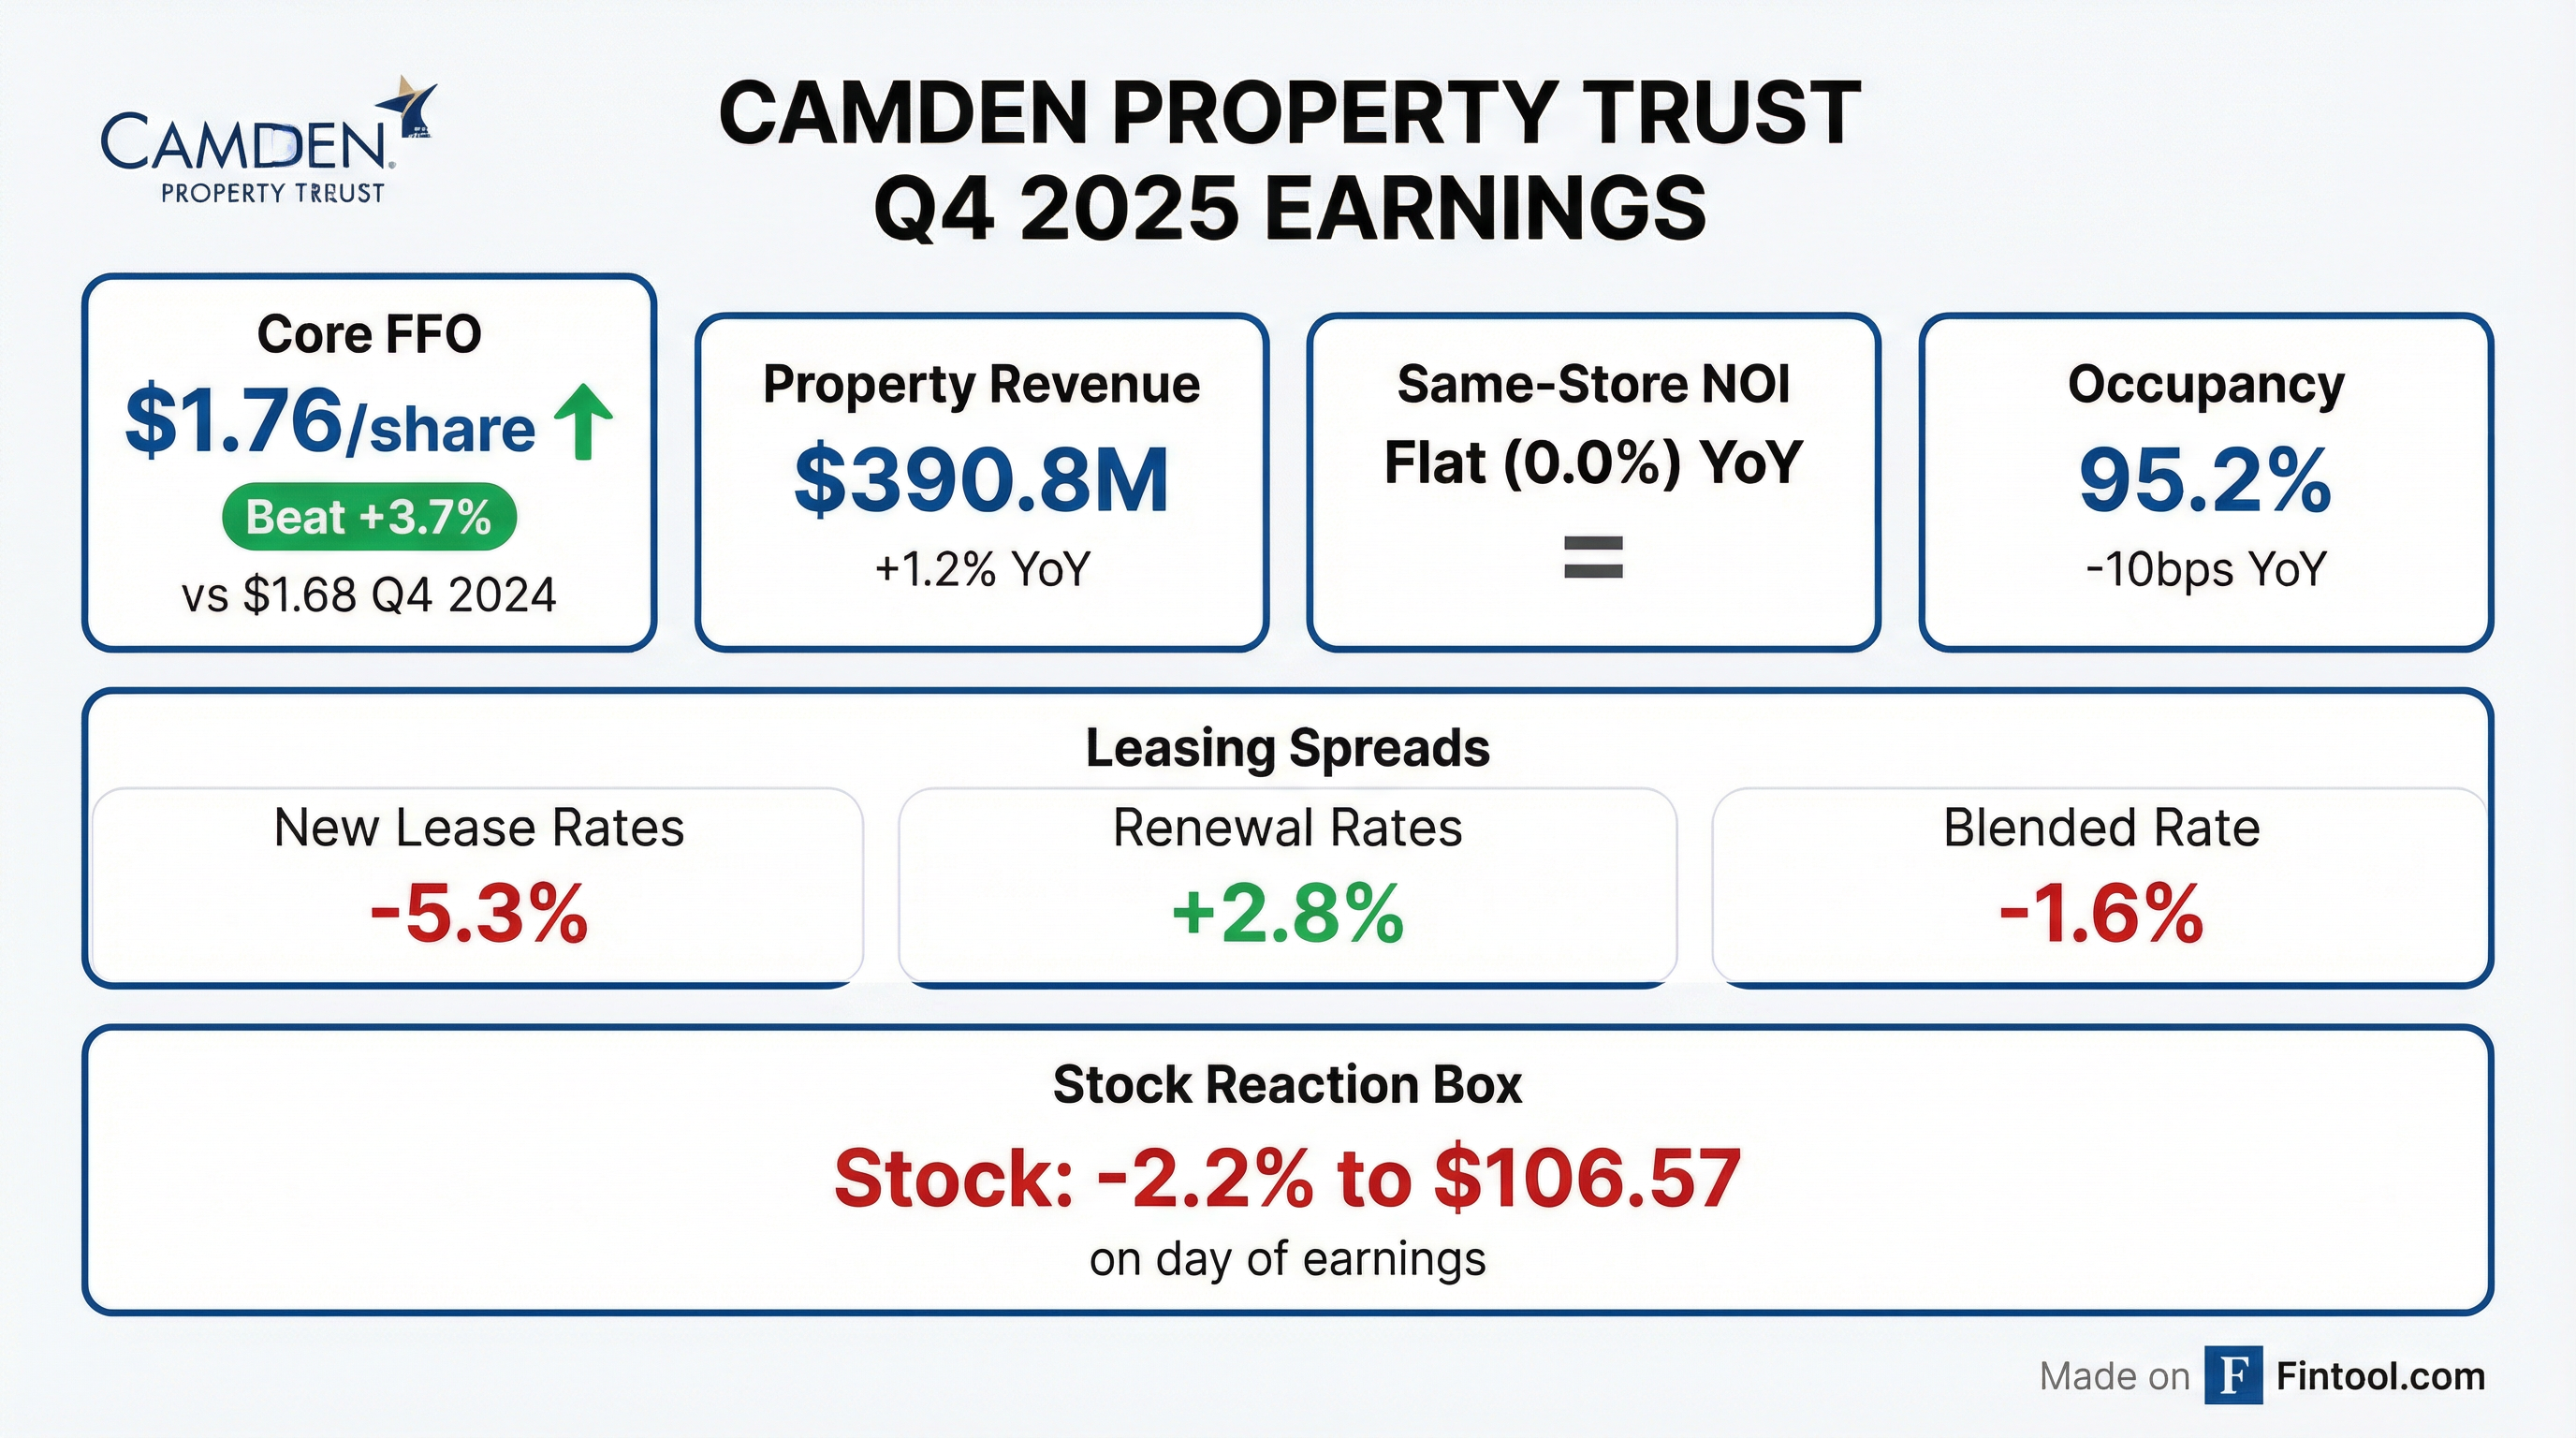
- Q4 2025 property revenues were $390.8 million, adjusted EBITDAre was $232.2 million, and net income attributable to common shareholders was $156.0 million ($1.44 per diluted share). Funds from operations totaled $189.5 million ($1.73 per share) and Core FFO was $193.1 million ($1.76 per share).
- Same property revenues grew 0.5% year-over-year, net operating income was flat, and occupancy stood at 95.2% as of December 31, 2025.
- The Board declared a Q1 2026 dividend of $1.06 per share, payable April 17, 2026, to shareholders of record March 31, 2026.
- 2026 outlook: expected FFO per share of $6.46–$6.76, Core FFO per share of $6.60–$6.90, and net operating income growth of –2.5% to 1.5%.
- EPS of $1.44 for 4Q25 and $3.54 for FY2025, compared to $0.37 and $1.50 a year earlier; FFO per diluted share of $1.73 in 4Q25 and $6.77 for FY2025; Core AFFO per share of $1.46 in 4Q25 and $5.90 for FY2025.
- Same-property revenue grew 0.5% year-over-year in 4Q25 with same-property NOI flat at 0.0%, and portfolio occupancy at 95.2% as of December 31, 2025.
- 2026 guidance updated to EPS of $0.40–$0.70, FFO of $6.46–$6.76, and Core FFO of $6.60–$6.90 per diluted share.
- Declared $1.06 dividend for Q1 2026 payable April 17, 2026, and authorized a new $600 million share repurchase program (full amount remaining).
- Same-store revenue growth of 0.8% in Q3 and 0.9% year-to-date; average occupancy at 95.5%, flat year-over-year.
- Effective rental rates: new leases down 2.5%, renewals up 3.5%, yielding 0.6% blended rate growth.
- Transaction market remains healthy with ample debt and equity; Class A cap rates at 4.5–5% and Class B at 5–5.5%.
- New supply in Camden’s markets projected to decline from 190,000 units in 2025 to 150,000 in 2026 and 110,000 in 2027.
- Capital allocation: intends to lean into share buybacks at approximately a 30% discount to NAV, funded by asset dispositions without raising leverage.
Quarterly earnings call transcripts for CAMDEN PROPERTY TRUST.
Ask Fintool AI Agent
Get instant answers from SEC filings, earnings calls & more