CENTERSPACE (CSR)·Q4 2025 Earnings Summary
Centerspace Core FFO Rises 3% as Strategic Review Continues
February 17, 2026 · by Fintool AI Agent
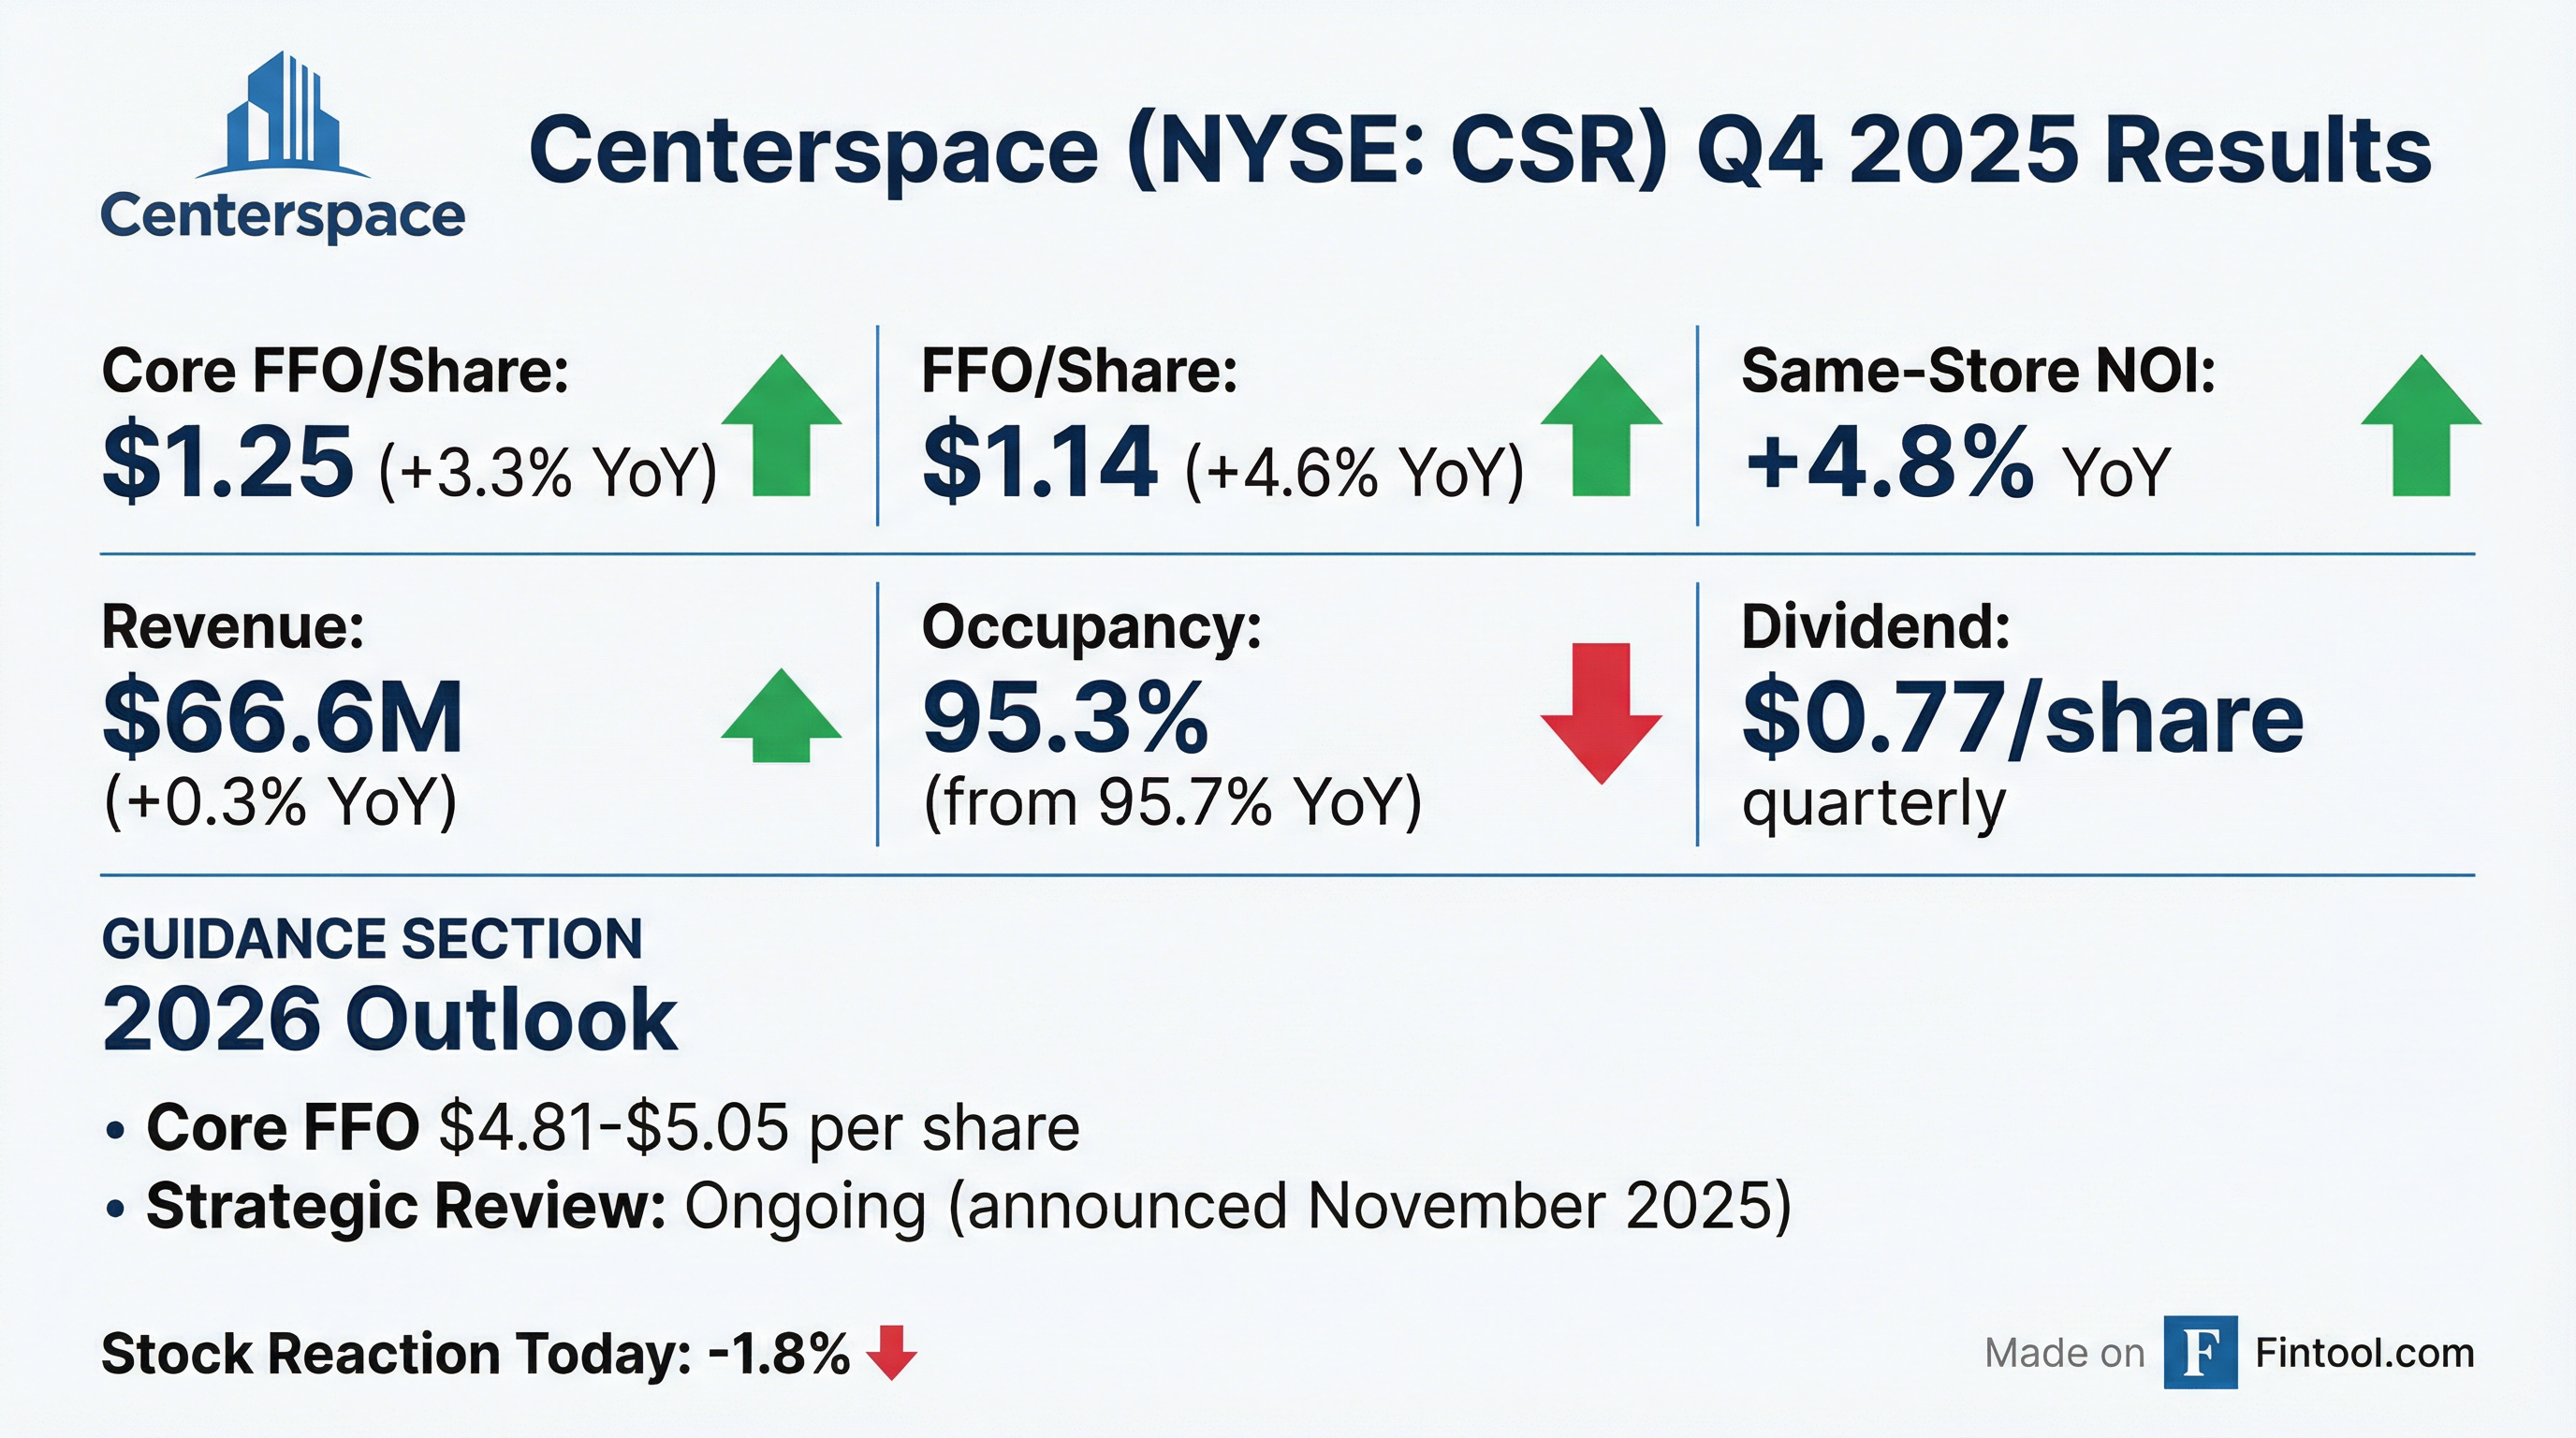
Centerspace (NYSE: CSR) reported Q4 2025 results today, delivering Core FFO of $1.25 per share, up 3.3% year-over-year. The Midwest-focused apartment REIT posted solid same-store NOI growth of 4.8% despite a challenging new lease environment, while the strategic review announced in November continues with no timeline disclosed.
The stock dropped 1.8% to $62.87 on the news, likely reflecting the softer 2026 guidance outlook.
Did Centerspace Beat Earnings?
For REITs, Funds from Operations (FFO) and Core FFO are the key performance metrics—not traditional EPS. Centerspace delivered solid growth across both metrics:
Net income was impacted by a $14.5M real estate impairment charge and depreciation—common non-cash items for REITs that are added back in FFO calculations.
Full Year 2025 showed improvement across the board:
What Did Management Guide?
Centerspace issued 2026 guidance that implies a potential step-back from 2025 levels at the midpoint:
The guidance implies modest deceleration, with same-store NOI potentially flat to slightly down at the low end. The company expects same-store capital expenditures of $1,250-$1,350 per home and value-add expenditures of $2.5M to $12.5M.
How Did the Stock React?
CSR shares fell 1.8% on earnings day to close at $62.87. The stock has been range-bound between $53 and $68 over the past year, with the strategic review announcement in November providing a brief lift before fading.
Key price levels:
- Today's Close: $62.87 (-1.8%)
- 52-Week High: $69.15
- 52-Week Low: $52.76
- 50-Day Moving Avg: $64.93
The dividend yield stands at 4.9% annualized ($3.08/year), providing income support for the stock.
What Changed From Last Quarter?
Same-Store Performance Decelerated Sequentially:
Same-store revenue dipped sequentially due to typical seasonal softness in Q4. The company controlled expenses well, with total same-store expenses down 5.1% YoY and 7.4% sequentially—driving NOI growth despite softer top-line.
New Lease Rates Remain Under Pressure:
New lease rate growth deteriorated to (4.8%), though renewals accelerated to +3.9%—suggesting existing residents are staying at higher rents while new tenant acquisition requires concessions.
What Is the Strategic Review Status?
In November 2025, Centerspace's Board announced a proactive review of strategic alternatives to maximize shareholder value. Key details:
"This review remains ongoing and there is no deadline or definitive timetable and there can be no assurance that this process will result in a transaction or any other strategic outcome. Centerspace will not be making disclosures or commenting relating to this process until it determines disclosure is required or appropriate."
The strategic review could result in:
- Sale of the company
- Merger with another apartment REIT
- Portfolio restructuring
- No transaction
For context, Centerspace owns 61 apartment communities with 12,262 homes across Colorado, Minnesota, Montana, Nebraska, North Dakota, South Dakota, and Utah.
Regional Performance
Same-store NOI performance varied significantly by market:
Standout: North Dakota surged +19.2% NOI growth in Q4, driven by strong rent growth (+5.9% YoY) and expense controls ((15.2%) YoY).
Laggard: Denver remains under pressure with (4.0%) NOI decline, facing supply headwinds with new apartment deliveries in the market.
Balance Sheet and Capital
Centerspace ended Q4 with a solid balance sheet:
2025 Capital Activity:
- Acquired: 2 communities (Sugarmont in Salt Lake City, Railway Flats in Loveland) for $281.2M
- Sold: 12 non-core Minnesota communities + 1 office building for $215.5M
- Repurchased: 62,973 shares at avg $54.86/share
Leverage ticked up slightly as the company deployed capital into acquisitions, but remains manageable with a 2.6x debt service coverage ratio.
Dividend
The Board declared a quarterly dividend of $0.77 per share, payable April 14, 2026 to shareholders of record March 30, 2026.
- Annualized Dividend: $3.08/share
- Payout Ratio (Core FFO basis): 62.5%
- Dividend Yield: ~4.9% at current price
The dividend increased from $0.75 in Q4 2024 to $0.77 in Q1 2025, representing a 2.7% hike.
Forward Catalysts
Near-Term:
- Earnings Call: February 18, 2026 at 10:00 AM ET
- Strategic Review Update: Any announcement would likely be material
- Q1 2026 Results: ~May 2026
Key Metrics to Watch:
- New lease rate trends (currently negative)
- Denver market stabilization
- Strategic review developments
- 2026 guidance tracking
Key Risks
-
New Lease Weakness: (4.8%) new lease rate growth indicates competitive pressure and potential oversupply in certain markets
-
Denver Exposure: 20% of NOI comes from Denver, which is underperforming with (4.0%) Q4 NOI decline
-
Strategic Review Uncertainty: No timeline or guaranteed outcome; execution risk if pursuing a transaction
-
Rising Leverage: Net Debt/EBITDA at 7.5x is elevated vs. historical levels, limiting financial flexibility
-
Guidance Below 2025: Midpoint of 2026 Core FFO ($4.93) is flat YoY; low end ($4.81) implies a (2.4%) decline
Data as of February 17, 2026. Core FFO and FFO are non-GAAP measures; see company's earnings release for definitions and reconciliations.