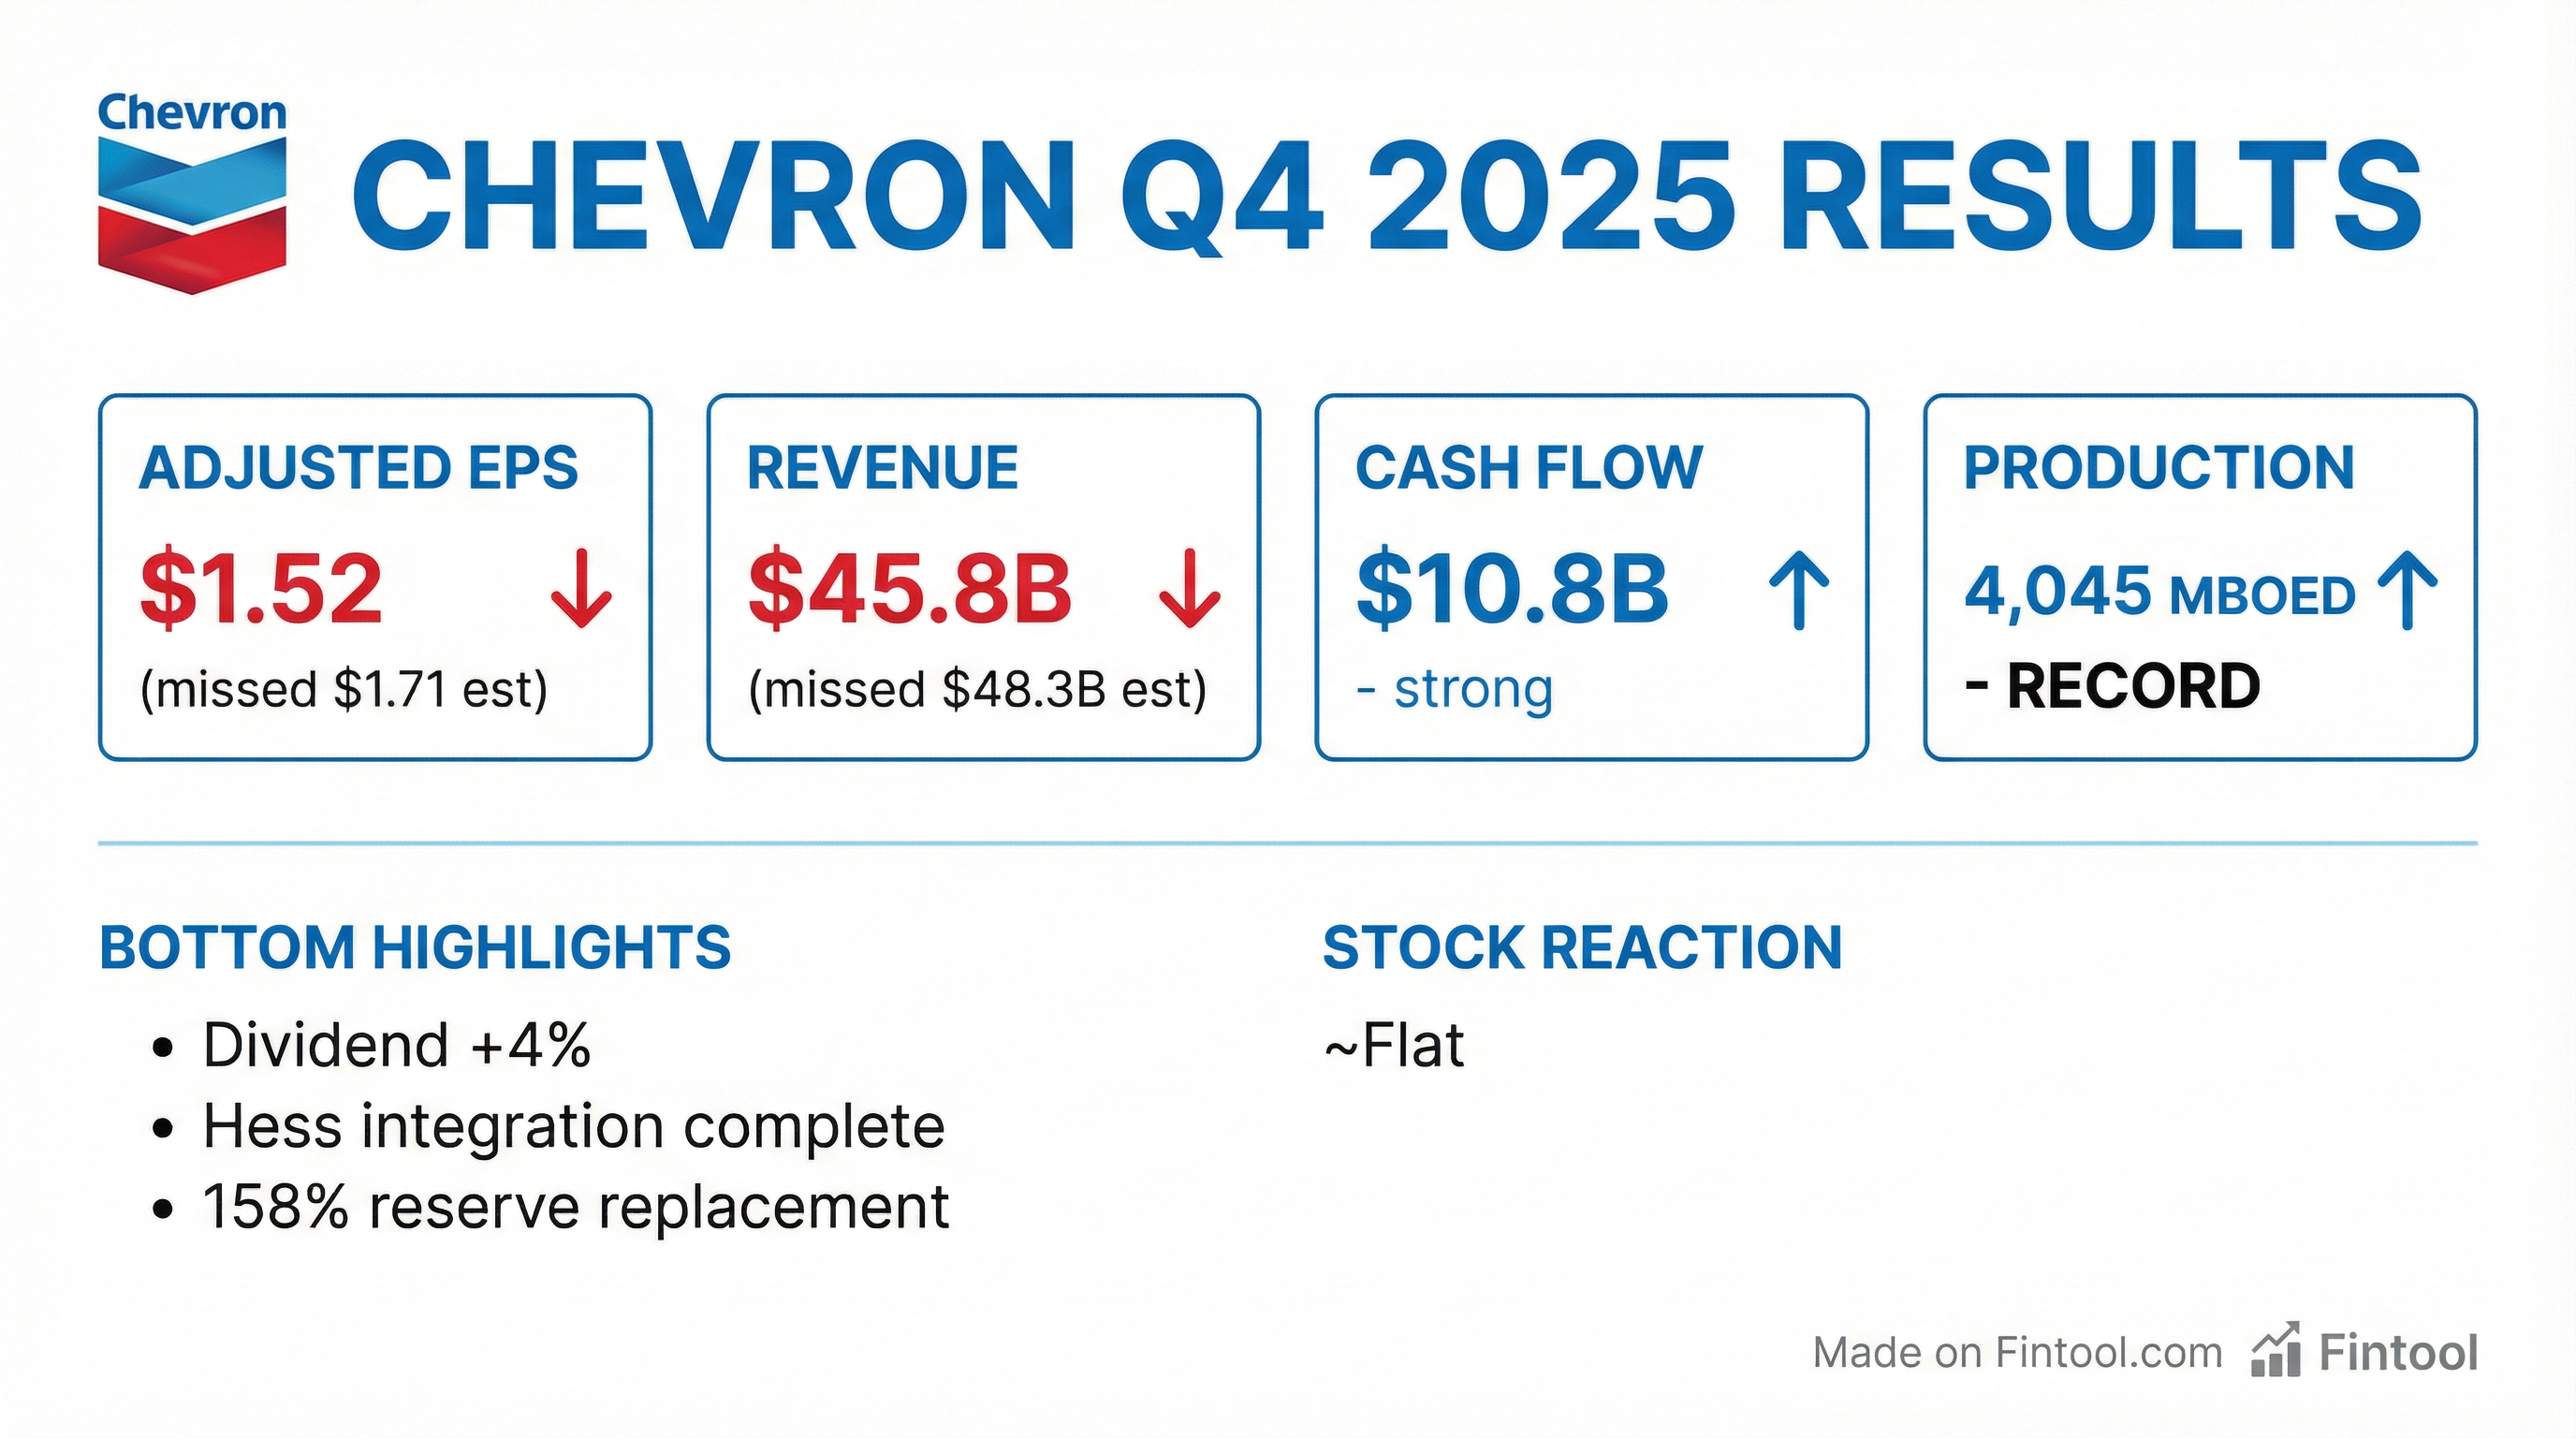
Earnings summaries and quarterly performance for CHEVRON.
Executive leadership at CHEVRON.
Board of directors at CHEVRON.
Alice Gast
Director
Charles Moorman
Director
Cynthia Warner
Director
Dambisa Moyo
Director
Debra Reed-Klages
Director
Enrique Hernandez, Jr.
Director
Jim Umpleby
Director
John Frank
Director
John Hess
Director
Jon Huntsman Jr.
Director
Marillyn Hewson
Director
Wanda Austin
Lead Independent Director
Research analysts who have asked questions during CHEVRON earnings calls.
Biraj Borkhataria
Royal Bank of Canada
8 questions for CVX
Devin Mcdermott
Morgan Stanley
8 questions for CVX
Jean Ann Salisbury
Bank of America
8 questions for CVX
Neil Mehta
Goldman Sachs
8 questions for CVX
Ryan Todd
Simmons Energy
8 questions for CVX
Jason Gabelman
TD Cowen
7 questions for CVX
Stephen Richardson
Evercore ISI
7 questions for CVX
Bob Brackett
Bernstein Research
6 questions for CVX
Lucas Herrmann
BNP Paribas
6 questions for CVX
Paul Cheng
Scotiabank
6 questions for CVX
Phillip Jungwirth
BMO Capital Markets
6 questions for CVX
Arun Jayaram
JPMorgan Chase & Co.
5 questions for CVX
Betty Jiang
Barclays
5 questions for CVX
Doug Leggate
Wolfe Research
5 questions for CVX
Geoff Jay
Daniel Energy Partners
5 questions for CVX
Paul Sankey
Sankey Research
5 questions for CVX
Alastair Syme
Citigroup
4 questions for CVX
John Royall
JPMorgan Chase & Co.
3 questions for CVX
Joshua Silverstein
UBS Group AG
3 questions for CVX
Nitin Kumar
Mizuho Securities USA
3 questions for CVX
Douglas Leggate
Wolfe Research
2 questions for CVX
James West
Evercore ISI
2 questions for CVX
Manav Gupta
UBS Group
2 questions for CVX
Paul Chang
Scotiabank
2 questions for CVX
Roger Read
Wells Fargo & Company
2 questions for CVX
Sam Margolin
Wells Fargo & Company
2 questions for CVX
Sam Marlin
Wells Fargo
2 questions for CVX
Douglas George Blyth Leggate
Wolfe Research
1 question for CVX
Francis Lloyd Byrne
Jefferies
1 question for CVX
Jeff Jay
Daniel Energy Partners
1 question for CVX
Josh Silverstein
UBS Group
1 question for CVX
Lloyd Byrne
Jefferies LLC
1 question for CVX
Neal Dingmann
Truist Securities
1 question for CVX
Robert Brackett
Bernstein Research
1 question for CVX
Wei Jiang
Barclays
1 question for CVX
Recent press releases and 8-K filings for CVX.
- Israel’s Energy Ministry ordered a temporary shutdown of parts of its natural gas infrastructure, including Chevron’s Leviathan offshore field, following U.S.-Israeli strikes on Iran.
- Chevron confirmed receipt of the order, stated all personnel and facilities at Leviathan are safe, and that onshore operations in the Partitioned Neutral Zone remain normal.
- Brent crude prices jumped to about $73/bbl (highest since July), with over-the-counter quotes near $80/bbl, reflecting fears of disrupted supply.
- Hundreds of vessels are anchored in the Gulf after movements through the Strait of Hormuz halted, highlighting chokepoint risks to global oil flows.
- The shutdown underscores how national security measures can override commercial operations, revealing vulnerabilities in offshore energy infrastructure.
- Chevron and HelleniQ Energy secured four offshore hydrocarbon exploration and production concession agreements with the Greek Republic, marking a strategic expansion of their upstream portfolios.
- The concessions cover South Crete 1, South Crete 2, South of Peloponnese and Block A2, spanning approximately 47,000 km² in ultra-deepwater environments.
- Chevron will operate the blocks with 70% working interest, while HelleniQ Energy holds 30%, following their selection via a 2025 international competitive bid by the Greek government.
- The consortium plans to undertake a three-phase exploration programme, including seismic evaluation, to assess hydrocarbon prospectivity.
- Chevron (70% operator) and HELLENiQ ENERGY (30% partner) signed offshore lease contracts with the Hellenic Republic for exploration and production in four blocks in southern Crete and Peloponnese covering approximately 47,000 km².
- The joint venture will conduct a three-stage exploration program in ultra-deep waters, some exceeding 1,500 meters below sea level, to assess hydrocarbon potential.
- The signing ceremony in Athens was attended by Greek Prime Minister Kyriakos Mitsotakis, Chevron VP Gavin Lewis, and HELLENiQ ENERGY CEO Andreas Shiamishis.
- The lease agreements are subject to ratification by the Hellenic Parliament.
- Chevron (70% operator) und HELLENiQ ENERGY (30%) haben Pachtverträge mit der Republik Griechenland für vier Offshore-Blöcke südlich von Kreta und dem Peloponnes über insgesamt 47.000 km² unterzeichnet.
- Die Konzessionen wurden im Rahmen einer internationalen Ausschreibung 2025 vergeben und sehen ein dreistufiges Explorationsprogramm in Tiefen von über 1.500 Metern vor.
- Die Verträge müssen noch vom griechischen Parlament ratifiziert werden, bevor Explorationsaktivitäten beginnen können.
- Die Unterzeichnungszeremonie in Athen verlief in Anwesenheit von Premierminister Kyriakos Mitsotakis, Chevron VP Gavin Lewis und HELLENiQ-CEO Andreas Shiamishis.
- Chevron holds 70% (operator) and HELLENiQ ENERGY holds 30% in the new joint venture for Greek offshore blocks.
- The JV secures rights to four deepwater blocks—“South Crete 1,” “South Crete 2,” “South of Peloponnese” and “A2”—covering 47,000 sq km.
- The agreement stems from Greece’s 2025 international bid round, marking HELLENiQ ENERGY’s entry into its next growth phase.
- Partners will execute a three-phase exploration program in ultra-deepwater (>1,500 m) with complex geological conditions.
- Chevron will operate with a 70% interest and HELLENiQ Energy holds 30% under a new concession signed with the Greek Republic for offshore oil and gas exploration and production.
- The agreement covers four high-potential blocks—South Crete 1, South Crete 2, South of Peloponnese and A2—totaling 47,000 km², under a three-phase exploration program.
- HELLENiQ Energy EVP Andreas Shiamishis calls the deal a strategic step in the company’s long-term growth and energy transition plans, combining scale, technical expertise and offshore capability.
- Chevron VP Gavin Lewis highlights Chevron’s global resources and technical strength will drive the development of this frontier offshore energy opportunity.
- Chevron, as operator with a 70% stake, and HELLENiQ ENERGY (30%) signed lease agreements with the Greek Republic for the exploration and production of hydrocarbons.
- The consortium will explore four offshore blocks—South Crete 1, South Crete 2, South Peloponnisos, and Block A2—covering approximately 47,000 km² south of Crete and the Peloponnese.
- The agreements, awarded through a 2025 Greek state tender, mark a key development in HELLENiQ ENERGY’s upstream portfolio and Greece’s hydrocarbon exploration efforts.
- As at 31 December 2025, remaining proved (1P) reserves were 1,882.1 MMboe, proved plus probable (2P) reserves were 2,999.5 MMboe, and 2C contingent resources were 5,795.7 MMboe.
- Excluding divestments and production, proved reserves increased by 134.1 MMboe and 2P reserves by 141.0 MMboe, driven by technical updates in Australia, Senegal and the US, and sanctioning of the Greater Western Flank 4, Turrum Phase 3 and Atlantis expansion projects.
- Compared with year-end 2024, proved reserves declined from 1,975.7 MMboe to 1,882.1 MMboe, and 2P reserves fell from 3,092.2 MMboe to 2,999.5 MMboe.
- At 2025 production levels, proved reserves support 8.9 years of production and 2P reserves 14.2 years.
- Chevron and HELLENiQ ENERGY signed lease agreements with the Hellenic Republic to explore four offshore blocks totaling approximately 47,000 km² south of Crete and the Peloponnese.
- Chevron will hold a 70% operator interest in the joint venture (HELLENiQ ENERGY 30%) under a three-phase exploration program to assess hydrocarbon potential.
- The concession areas lie in ultra-deepwater settings, with some blocks beyond 1,500 m sea depth targeting complex geological structures.
- The agreements, signed at Athens’s Maximos Mansion, are subject to ratification by the Hellenic Parliament.
- Chevron, with HELLENiQ ENERGY, signed lease agreements for four offshore Greece blocks (South Crete 1 & 2; South Peloponnese; A2) for exploration.
- Chevron holds a 70% operating interest (HELLENiQ ENERGY 30%) and will conduct 2D and 3D seismic surveys in phase one.
- The agreements are pending ratification by the Greek Parliament.
- This award complements Chevron’s Mediterranean portfolio, which includes Israeli gas fields and Cyprus’s Aphrodite field.
Fintool News
In-depth analysis and coverage of CHEVRON.

Venezuela Ends Two Decades of Oil Nationalization, Opens Sector to Foreign Investment

Chevron and Quantum Team Up for $22 Billion Lukoil Asset Grab

Trump's Venezuela Raid Sends Gold Surging, Defense Stocks Soaring—and Uncovers a $60 Billion Bitcoin Mystery

US Strikes Venezuela, Captures Maduro: Oil Markets Brace for Geopolitical Shock
Quarterly earnings call transcripts for CHEVRON.
Ask Fintool AI Agent
Get instant answers from SEC filings, earnings calls & more