Earnings summaries and quarterly performance for DEVON ENERGY CORP/DE.
Executive leadership at DEVON ENERGY CORP/DE.
Clay Gaspar
President and Chief Executive Officer
Dennis Cameron
Executive Vice President and General Counsel
Jeffrey Ritenour
Executive Vice President and Chief Financial Officer
John Raines
Senior Vice President E&P Asset Management
Tana Cashion
Executive Vice President Human Resources and Administration
Thomas Hellman
Senior Vice President E&P Operations
Trey Lowe
Senior Vice President and Chief Technology Officer
Board of directors at DEVON ENERGY CORP/DE.
Ann Fox
Director
Barbara Baumann
Director
Brent Smolik
Director
Gennifer Kelly
Director
John Bethancourt
Chair of the Board
Karl Kurz
Director
Kelt Kindick
Director
Michael Mears
Director
Robert Mosbacher Jr.
Director
Valerie Williams
Director
Research analysts who have asked questions during DEVON ENERGY CORP/DE earnings calls.
Arun Jayaram
JPMorgan Chase & Co.
10 questions for DVN
Neil Mehta
Goldman Sachs
10 questions for DVN
Paul Cheng
Scotiabank
8 questions for DVN
John Freeman
Raymond James Financial
7 questions for DVN
Kevin MacCurdy
Pickering Energy Partners
6 questions for DVN
Neal Dingmann
Truist Securities
6 questions for DVN
Scott Gruber
Citigroup
6 questions for DVN
Doug Leggate
Wolfe Research
5 questions for DVN
Phillip Jungwirth
BMO Capital Markets
5 questions for DVN
Scott Hanold
RBC Capital Markets
5 questions for DVN
Kalei Akamine
Bank of America
4 questions for DVN
Matthew Portillo
Tudor, Pickering, Holt & Co.
4 questions for DVN
Betty Jiang
Barclays
3 questions for DVN
Charles Meade
Johnson Rice & Company L.L.C.
3 questions for DVN
David Deckelbaum
TD Cowen
3 questions for DVN
Douglas George Blyth Leggate
Wolfe Research
2 questions for DVN
Doug Leggett
Wolfe Research
2 questions for DVN
Kaleinoheaokealaula Akamine
Bank of America
2 questions for DVN
Roger Read
Wells Fargo & Company
2 questions for DVN
Wei Jiang
Barclays
2 questions for DVN
Joshua Silverstein
UBS Group AG
1 question for DVN
Phillips Johnston
Capital One Securities, Inc.
1 question for DVN
Recent press releases and 8-K filings for DVN.
- Devon and Coterra merger targets $1 billion in annual pre-tax run-rate synergies by year-end 2027, enhancing scale and operational efficiency.
- Delivered $700 million of free cash flow in Q4 2025 and $3.1 billion for full year 2025, driven by production optimization, cost reductions, and capital efficiencies.
- Achieved 193% reserve replacement of production at an F&D cost of just over $6/BOE in 2025, underscoring portfolio quality.
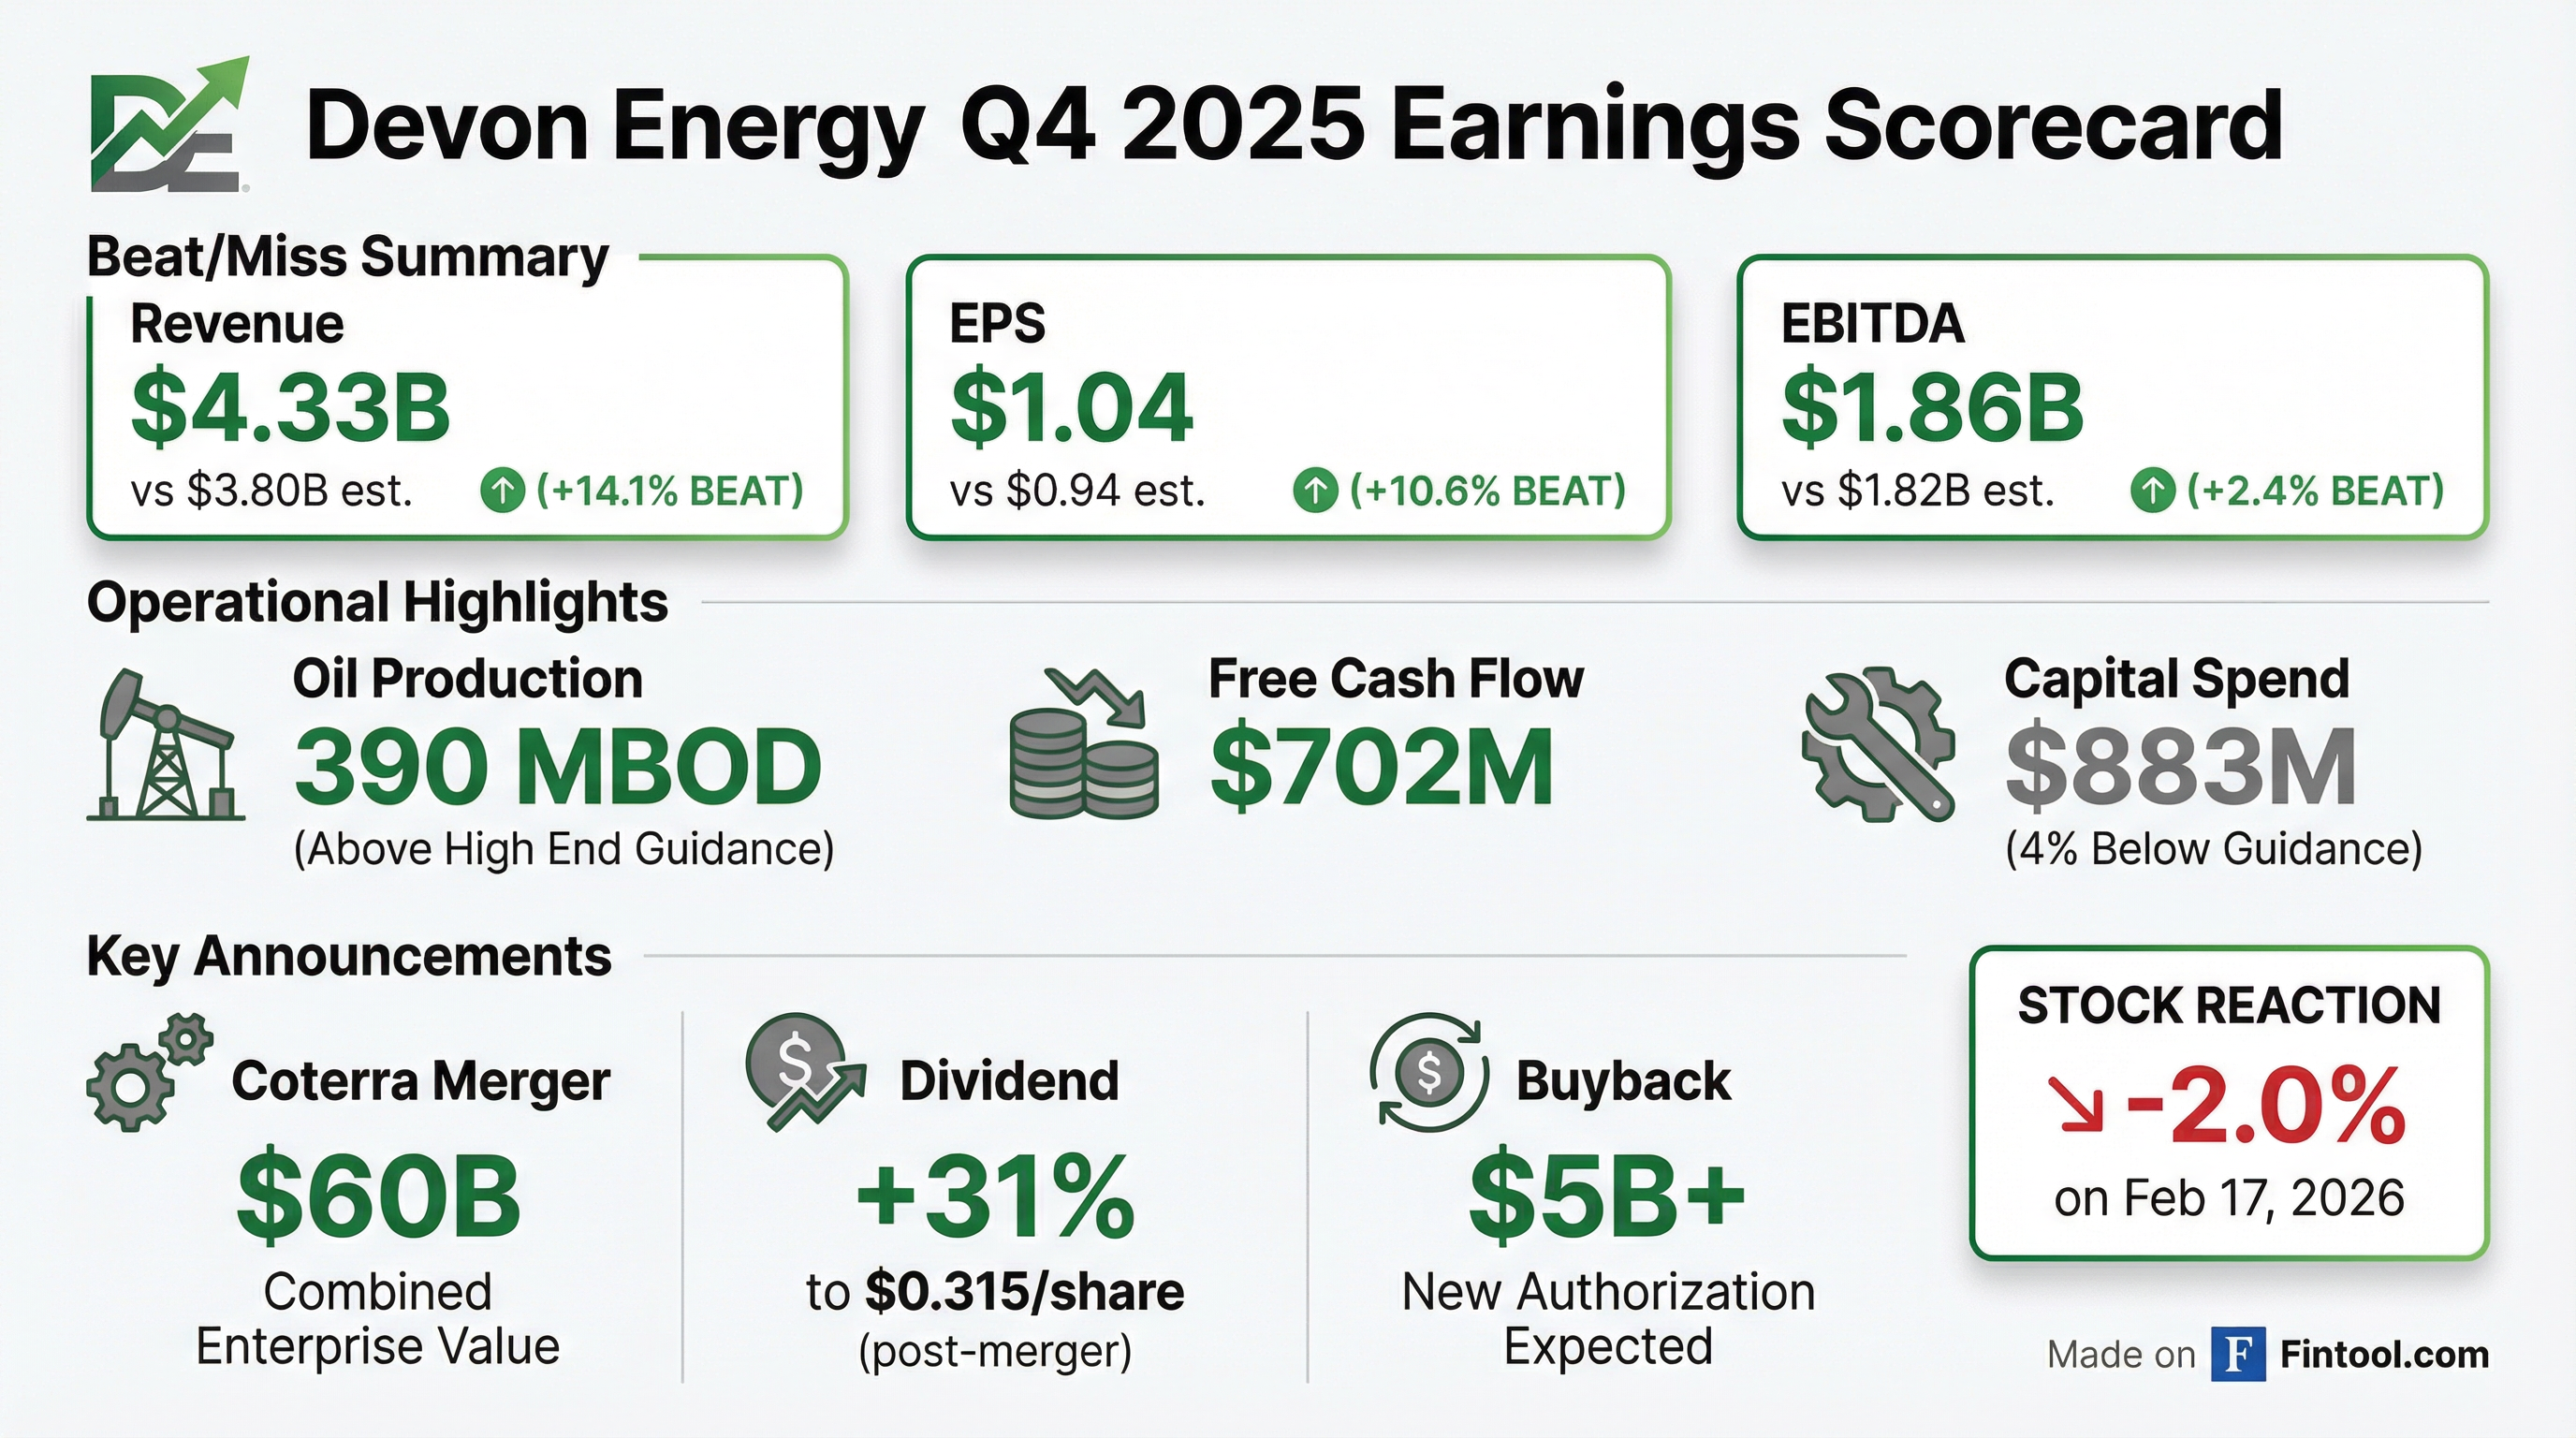
- Increased quarterly dividend 9% to $0.24 per share in 2025; pending merger close and board approval, plans to raise the dividend 31% and seek > $5 billion share repurchase authorization.
- Maintained 2026 outlook with Q1 production guidance of ~830,000 BOE/d (including ~10,000 BOE/d weather downtime) and full-year guidance unchanged.
- Announced a merger with Coterra Energy creating a combined company expected to deliver $1 billion in annual pre-tax synergies by year-end 2027 and enhance free cash flow for higher dividends and a new share repurchase authorization.
- Generated $700 million of free cash flow in Q4 2025, driven by production beating guidance, improved operating costs, and capital spending 4% below plan.
- Delivered $3.1 billion of free cash flow in 2025, returned $2.2 billion to shareholders via dividends, buybacks, and debt repayments, raised the quarterly dividend by 9% to $0.24/share, and ended the year with $1.4 billion cash and net debt/EBITDA <1×.
- Captured 85% of the standalone $1 billion annual business optimization target in under a year through 100+ workstreams and expects to achieve the remainder during 2026.
- Invested to acquire approximately 15% ownership in geothermal innovator Fervo Energy, leveraging Devon’s geoscience and drilling expertise to enter the power-generation sector.
- Announced merger with Coterra Energy to create a combined platform, targeting $1 billion of annual pre-tax synergies by year-end 2027.
- Generated $700 million of free cash flow in Q4 and $3.1 billion for full-year 2025, returning $2.2 billion to shareholders via dividends and buybacks.
- Increased 2025 dividend by 9% to $0.24 per share and reduced net debt to EBITDA to <1× as of year-end 2025.
- Achieved 193% reserve replacement at an F&D cost of $6/BOE and guided Q1 2026 production at 830,000 BOE/d (including ~10,000 BOE/d of weather-related downtime).
- Announced transformational merger with Coterra Energy, creating a premier shale operator with ~$60 billion pro forma enterprise value and targeting $1.0 billion of pre-tax synergies by year-end 2027.
- Delivered 390 MBOD of oil production, spent $883 million of capital (4% below midpoint guidance), and generated $702 million of free cash flow in Q4 2025.
- Achieved an 8% reduction in LOE & GP&T costs year-to-date and captured 85% of the $1 billion business optimization target by year-end 2025.
- Returned ~$400 million to shareholders in dividends and plans to raise the quarterly dividend to $0.315 per share, alongside a >$5 billion share repurchase authorization post-merger.
- Devon Energy entered into an all-stock merger agreement with Coterra Energy, expected to close in Q2 2026, creating a premier independent shale operator.
- Q4 2025 oil production averaged 390,000 Bbls/d, exceeding guidance, with net earnings of $562 million (or $0.90 per diluted share).
- Operations generated $1.5 billion of operating cash flow and $702 million of free cash flow in the fourth quarter.
- Declared a quarterly fixed dividend of $0.24 per share payable on March 31, 2026.
- The all-stock merger combines Devon and Coterra into a premier E&P company with 1.6 million boe/d of production and leading Delaware Basin presence.
- The transaction targets $1 billion in annual pre-tax synergies by end-2027, equivalent to ~20% of combined market cap.
- The combined company holds ~750,000 net acres of stacked pay and produces >860,000 boe/d in the Delaware Basin, backed by 5,000 gross drilling locations and sub-$40 break-even inventory over a 10-year runway.
- Pro forma liquidity of $4.4 billion, 0.9x net debt/EBITDAX, target <50% reinvestment rate, with a $0.315/share quarterly dividend and >$5 billion share buyback plan.
- Devon Energy and Coterra Energy have agreed to an at-market all-stock merger creating a premier large-cap E&P company, with Clay Gaspar as President & CEO and Tom Jorden as Chairman.
- The combined entity will leverage its Delaware Basin position—over half of pro forma production and cash flow—and a diversified Lower 48 portfolio enhanced by AI-driven operations.
- Management targets $1 billion in annual pre-tax synergies by year-end 2027 (≈20% of pro forma market cap), split among $350 million in capital optimization, $350 million in operating margins, and $300 million in corporate cost savings.
- Pro forma liquidity of $4.4 billion, net debt/EBITDAX of 0.9x, a base quarterly dividend of $0.315 per share, and a planned $5 billion+ share repurchase authorization underpin the combined company’s financial strategy.
- All-stock combination creates a premier shale operator with a pro forma enterprise value of $58 billion, an exchange ratio of 0.70 Devon share per Coterra share, and pro forma equity ownership of 54% Devon and 46% Coterra.
- Expected to close in Q2 2026, subject to shareholder and regulatory approvals.
- Targets $1.0 billion of pre-tax synergies by year-end 2027, with a pro forma net-debt-to-EBITDAX of 0.9x and $4.4 billion of liquidity.
- Leadership roles include Clay Gaspar as President & CEO and Tom Jorden as Non-Executive Chairman, with a combined board of 6 Devon and 5 Coterra directors.
- Plans to declare a quarterly dividend of $0.315 per share and seek share repurchase authorization in excess of $5 billion.
- The all-stock merger of Devon Energy and Coterra will create one of the world’s largest shale producers with pro forma output of 1.6 MMboe/d, including 860,000 boe/d from the Delaware Basin.
- The deal targets $1 billion in annual pre-tax synergies by year-end 2027 (≈ 20% of pro forma market cap) from capital optimization, operating margin enhancement, and corporate cost savings.
- The combined company will start with $4.4 billion in liquidity, 0.9x net debt/EBITDAX, supports a $0.315/share quarterly dividend, and plans > $5 billion in share repurchases.
- Headquarters will relocate to Houston, while maintaining a significant Oklahoma City presence.
- The all-stock merger at a 0.70 exchange ratio implies a $58 billion enterprise value and yields 1.6 MMBOED pro forma 2026e production with a balanced oil (34%), gas (44%), and NGL (22%) mix.
- The Delaware Basin franchise underpins 53% of pro forma volumes, with 746,000 net acres and 863,000 BOED of Q3 2025 production, offering >10 years of high-quality inventory.
- Identified $1 billion in annual pre-tax synergies to be realised by year-end 2027 across capital optimisation, operating margin improvements, and corporate cost reductions.
- Capital returns framework includes a planned $0.315 per share quarterly dividend and > $5 billion share repurchase program, alongside a pro forma 0.9x net debt/EBITDAX leverage ratio and $4.4 billion liquidity as of Q3 2025.
Fintool News
In-depth analysis and coverage of DEVON ENERGY CORP/DE.

Devon Energy and Coterra Merge in $58 Billion Deal to Create Shale Behemoth

Devon Energy and Coterra Announce $58 Billion Merger to Create Shale Giant

Devon and Coterra Explore Merger to Create $43 Billion U.S. Shale Giant

Devon and Coterra Explore $44 Billion Shale Mega-Merger
Quarterly earnings call transcripts for DEVON ENERGY CORP/DE.
Ask Fintool AI Agent
Get instant answers from SEC filings, earnings calls & more