EAGLE FINANCIAL SERVICES (EFSI)·Q4 2025 Earnings Summary
Eagle Financial Services Beats EPS as NIM Expands 58bps to 3.61%
January 27, 2026 · by Fintool AI Agent
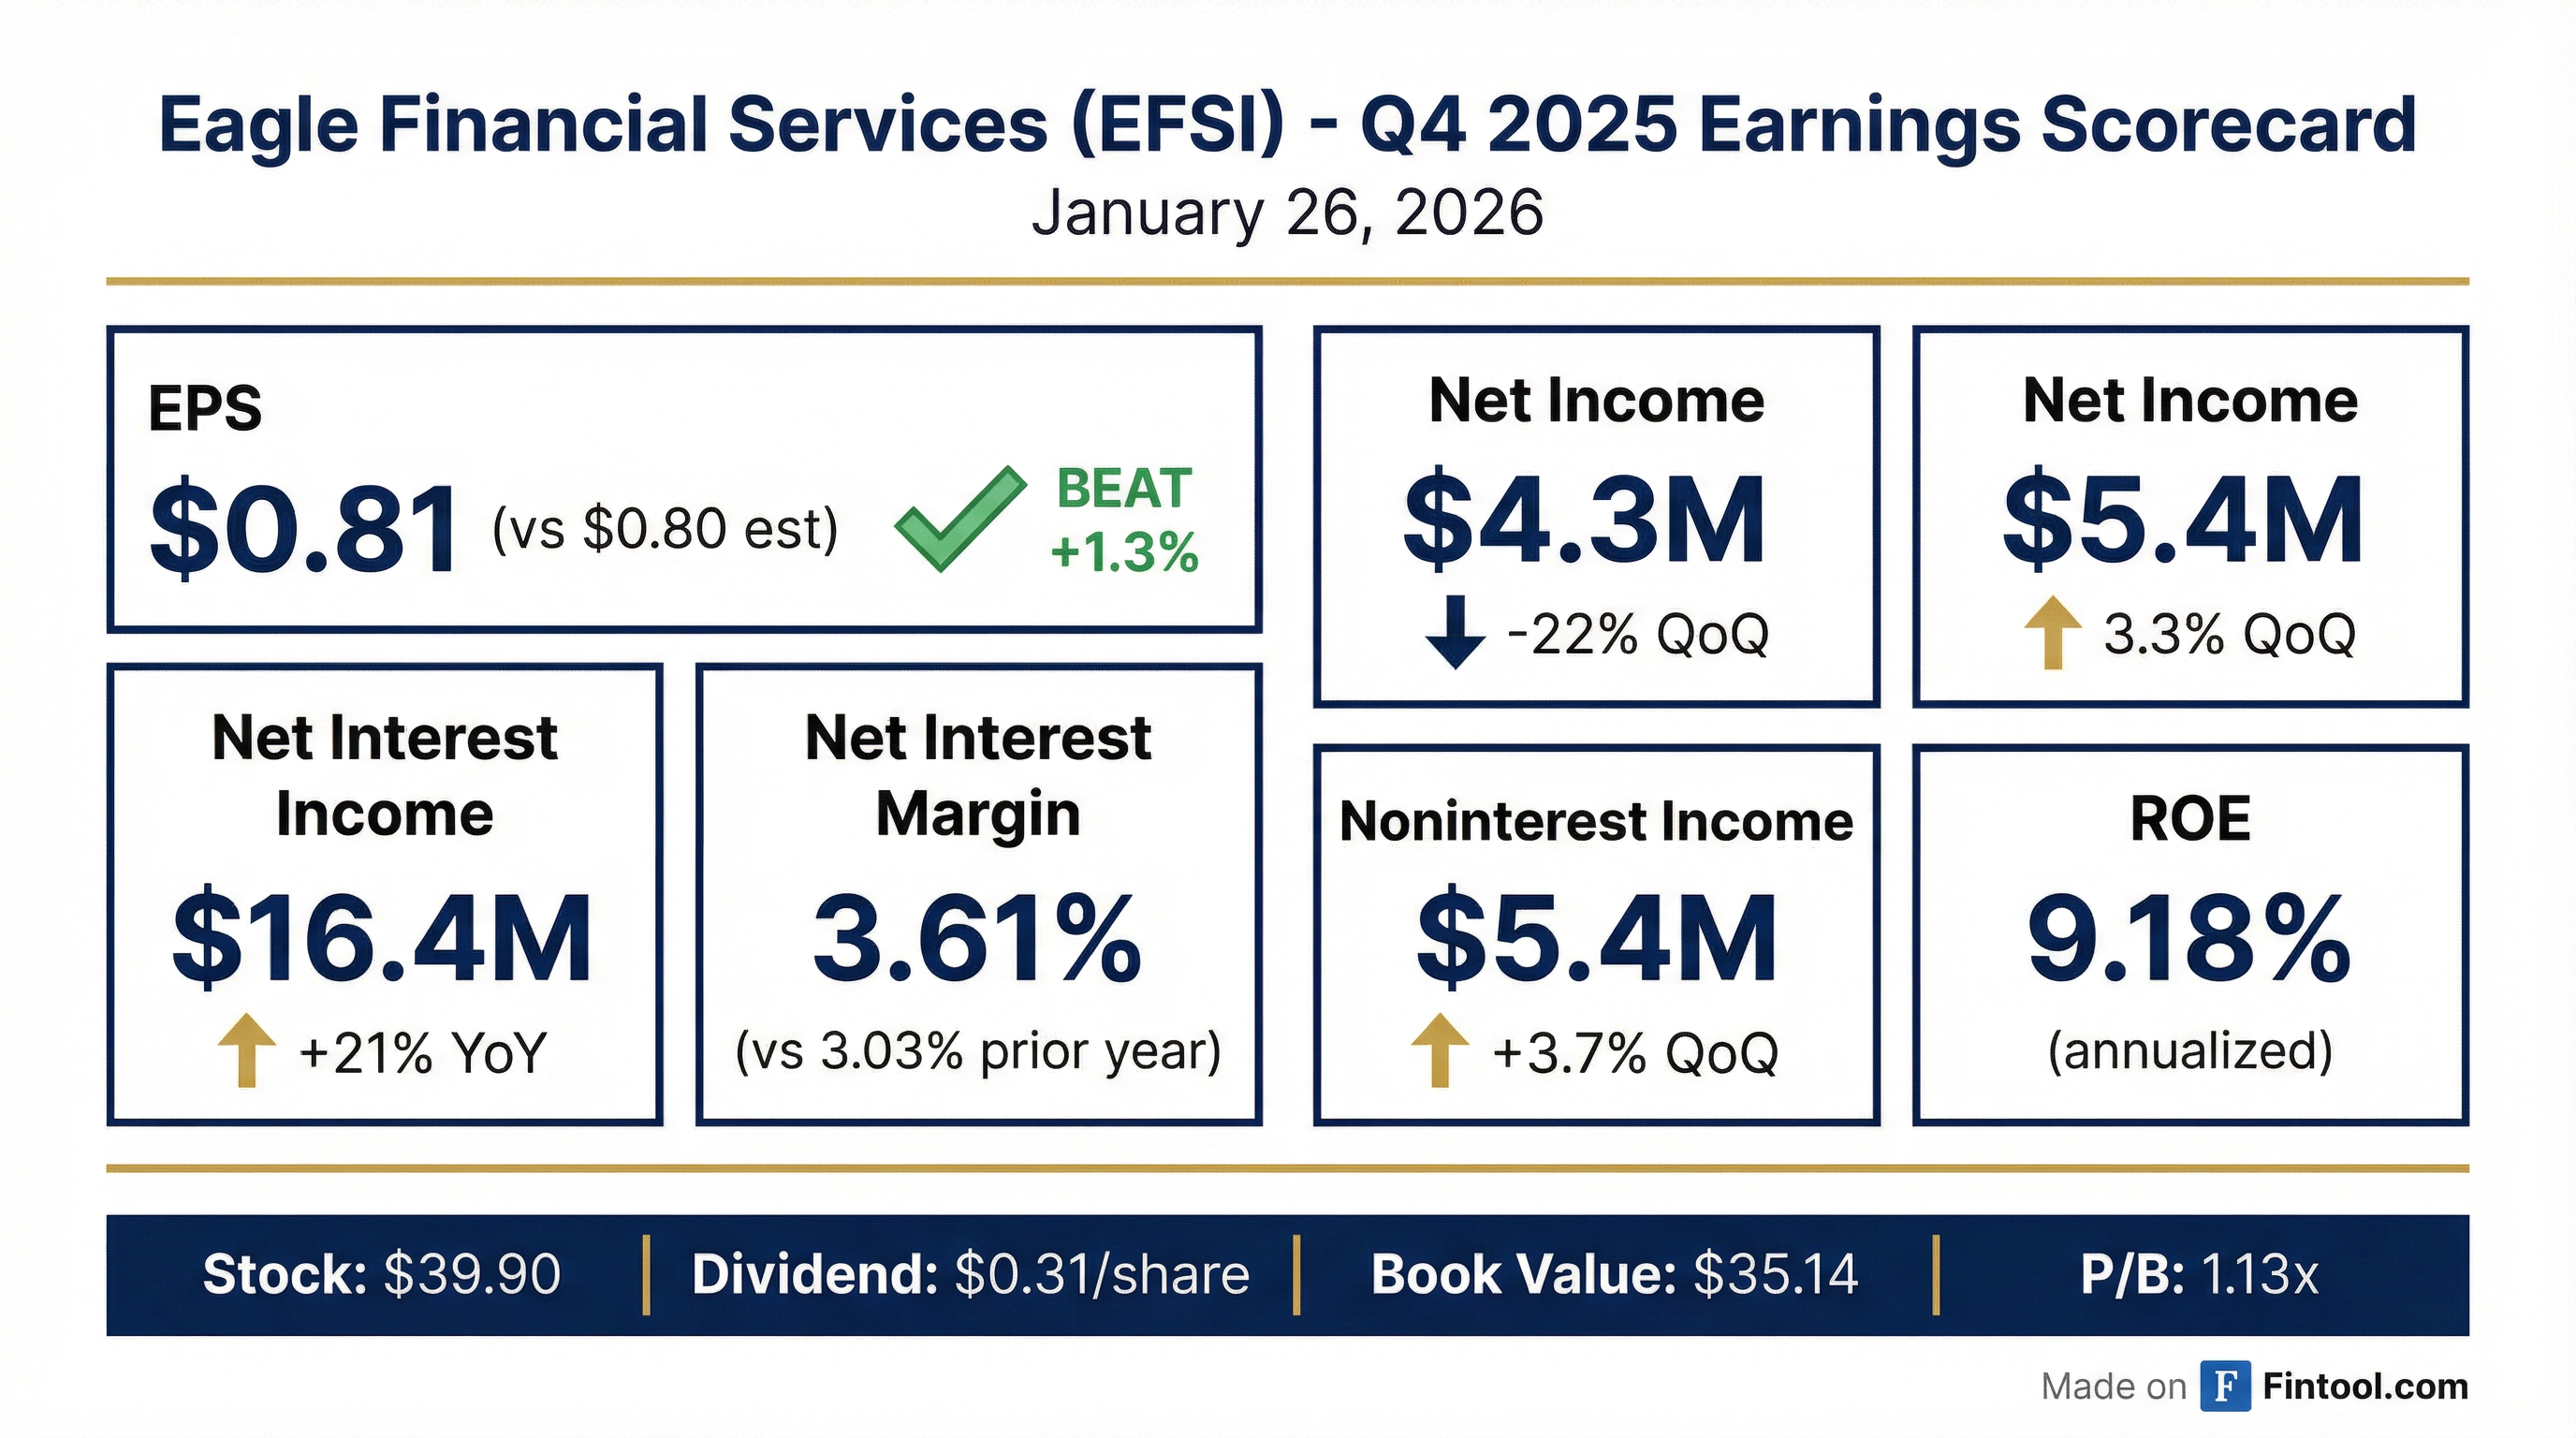
Eagle Financial Services (NASDAQ: EFSI), the holding company for Bank of Clarke, reported Q4 2025 earnings that topped analyst estimates, capping what CEO Brandon Lorey called a "pivotal year" marked by a successful capital raise, strategic balance sheet repositioning, and the company's NASDAQ uplisting.
The Virginia-based community bank delivered EPS of $0.81, edging past the $0.80 consensus by 1.3%, while net interest margin expanded 58 basis points year-over-year to 3.61%—the highest level in two years.
Did Eagle Financial Services Beat Earnings?
Yes. EFSI beat on both EPS and implied revenue:
The beat was driven by stronger-than-expected net interest income of $16.4 million (+21% YoY) and wealth management fee growth of 26% quarter-over-quarter.
However, net income declined 22% from Q3 2025's $5.6 million due to higher salaries and benefits expense from increased incentive accruals and headcount growth (254 vs 231 FTEs YoY).
What Drove the Margin Expansion?
Net interest margin of 3.61% was the headline story, up from 3.58% in Q3 2025 and 3.03% in Q4 2024.
Three factors drove the 58bps YoY improvement:
-
Securities repositioning — In Q1 2025, the bank sold $99.2 million in securities yielding 1.72% and reinvested $66 million at 4.70%, adding ~300bps to the portfolio yield.
-
FHLB paydowns — Average FHLB advances declined $102 million YoY as deposit growth funded the payoffs, reducing interest expense by $1.2 million.
-
Deposit cost discipline — Interest-bearing deposit costs fell 37bps YoY even as the rate environment remained elevated.
What Changed From Last Quarter?
Positives:
- Wealth management fees surged 25.8% to $2.3 million on higher AUM and account activity
- Net charge-offs dropped to $237K from $2.3 million in Q3 (which included a $1.1 million deficiency write-off)
- Total loans grew $13.1 million driven by $67 million in originations and $18.5 million of commercial loan growth
- Loan pipeline up over $100 million vs. January 2025 — strong forward indicator
Negatives:
- One $2.1 million C&I relationship moved to nonaccrual (part of a larger syndicated loan)
- Nonperforming assets ticked up to 0.77% of total assets from 0.74%
- Operating expenses rose 8.3% QoQ to $15.5 million on higher incentive compensation
- Marine portfolio runoff of $10.3 million partially offset commercial loan growth
Profitability metrics:
- Return on average assets: 0.91% (annualized)
- Return on average equity: 9.18% (annualized)
The deposit story: Total deposits fell $47.7 million sequentially as $74 million in large non-interest bearing deposits departed—proceeds from two customers' business sales that had temporarily parked at the bank in Q2.
How Did Management Guide?
On the earnings call, management provided qualitative guidance for 2026:
Efficiency ratio: CFO Kate Chappell expects the efficiency ratio to move "slightly below 70%" in 2026 as spread income improves and salaries normalize.
Fee income: Wealth management fees and gain on sale revenue expected to "remain generally consistent with 2025 levels."
Loan growth: Chief Banking Officer Joe Zmitrovich highlighted that the loan pipeline is up over $100 million compared to January 2025, with strong opportunities in both established and new markets.
M&A: CEO Brandon Lorey noted the bank continues to "engage in conversations with potential bank partners" that align with their community-focused model, though the approach remains disciplined.
"Our fourth quarter results put a fitting close on a year defined by focus and follow-through. We strengthened our balance sheet, kept asset quality on solid footing, and continued to perform at a level that compares favorably to many of our peers." — CEO Brandon Lorey
Forward analyst estimates point to continued earnings improvement:
Values retrieved from S&P Global
Credit Quality: One New Problem Loan
Nonperforming assets increased to $14.6 million (0.77% of assets) from $14.3 million in Q3, driven by one new relationship:
The new nonaccrual: A $2.1 million commercial and industrial loan that's part of a larger syndicated credit (EFSI's piece represents just 0.31% of the total commitment). The borrower is under a forbearance agreement for covenant violations, but performance has improved under new management. The bank believes collateral covers the entire balance.
Existing problem credits:
- A $2.2 million partially owner-occupied property where the owner passed away — foreclosure proceeding
- A $5.5 million Washington D.C. multifamily portfolio — receivership granted, properties being readied for sale
Capital Position: Well Capitalized
Eagle Financial bolstered its capital base significantly in 2025 through a public stock offering that raised $53.5 million in net proceeds (1.8 million shares at ~$30/share).
The $13.3 million improvement in accumulated other comprehensive loss reflects both the securities repositioning (realizing losses) and improving marks on the remaining portfolio.
Dividend: The Board declared $0.31 per share quarterly dividend, payable February 13, 2026. The payout ratio was 38.3% for the quarter.
How Did the Stock React?
EFSI shares traded at $39.90 on January 26, 2026, down 0.3% on the session. The muted reaction suggests the beat was largely expected given the company's consistent execution since the Q1 2025 capital raise.
Valuation snapshot:
- Price/Book: 1.13x
- Price/Tangible Book: 1.13x
- 52-Week Range: $28.70 - $41.12
- Market Cap: ~$215 million
The stock has appreciated 39% over the past year, outperforming the regional bank index, supported by margin expansion and the successful strategic pivot.
What's the Growth Outlook?
Management expressed confidence in the organic growth trajectory:
Maryland expansion: The commercial team in Maryland is expected to "build momentum and expand their presence" in 2026, representing a geographic growth lever.
Loan pipeline strength: At over $100 million above January 2025 levels, the pipeline reflects "solid opportunities not only in established markets, but also through new and expanding client relationships."
M&A optionality: While remaining disciplined, management is actively evaluating bank partnerships that "align with our community-focused model and long-term strategic objectives."
"We remain a strong organic growth company. The progress we delivered this year reflects the effectiveness of our execution and our relationship-based approach to banking. We believe our platform is well positioned to scale." — CEO Brandon Lorey
Key Takeaways
- EPS beat of $0.81 vs $0.80 estimate continues the execution streak post-capital raise
- NIM expansion to 3.61% (+58bps YoY) validates the securities repositioning strategy
- Loan pipeline up $100M+ YoY signals strong commercial momentum ahead
- Efficiency guidance for sub-70% in 2026 as salary costs normalize
- Credit quality bears watching — NPAs at 0.77% vs 0.16% a year ago, though losses remain contained
- M&A optionality — management actively evaluating partnership opportunities
Based on Q4 2025 earnings call held January 27, 2026 and 8-K filing. View full transcript | View 8-K filing.