Earnings summaries and quarterly performance for Elevance Health.
Executive leadership at Elevance Health.
Gail Boudreaux
President and Chief Executive Officer
Felicia Norwood
Executive Vice President and President of Government Health Benefits
Mark Kaye
Executive Vice President and Chief Financial Officer
Morgan Kendrick
Executive Vice President and President of Commercial and Specialty Health Benefits
Peter Haytaian
Executive Vice President and President of Carelon and CarelonRx
Board of directors at Elevance Health.
Antonio Neri
Director
Bahija Jallal
Governance Committee Chair
Deanna Strable
Director
Kerry Clark
Finance Committee Chair
Lewis Hay III
Director
Ramiro Peru
Independent Chair of the Board
Robert Dixon Jr
Director
Ryan Schneider
Audit Committee Chair
Steven Collis
Director
Susan DeVore
Director
Research analysts who have asked questions during Elevance Health earnings calls.
Andrew Mok
Barclays
8 questions for ELV
Erin Wright
Morgan Stanley
8 questions for ELV
George Hill
Deutsche Bank
8 questions for ELV
Justin Lake
Wolfe Research, LLC
8 questions for ELV
Lance Wilkes
Sanford C. Bernstein & Co., LLC
8 questions for ELV
Lisa Gill
JPMorgan Chase & Co.
8 questions for ELV
Ann Hynes
Mizuho Financial Group
7 questions for ELV
Ryan Langston
TD Cowen
7 questions for ELV
Joshua Raskin
Nephron Research
6 questions for ELV
Sarah James
Cantor Fitzgerald
6 questions for ELV
Scott Fidel
Stephens Inc.
6 questions for ELV
Benjamin Hendrix
RBC Capital Markets
5 questions for ELV
Dave Windley
Jefferies LLC
5 questions for ELV
Kevin Fischbeck
Bank of America
5 questions for ELV
A.J. Rice
UBS
4 questions for ELV
Albert Rice
UBS
3 questions for ELV
Benjamin Mayo
Leerink Partners
3 questions for ELV
Hua Ha
Robert W. Baird & Co. Incorporated
3 questions for ELV
Jason Cassorla
Guggenheim Partners
3 questions for ELV
Joanna Gajuk
Bank of America
3 questions for ELV
Stephen Baxter
Wells Fargo
3 questions for ELV
Stephen Baxter
Wells Fargo & Company
3 questions for ELV
Ben Hendricks
RBC Capital Markets
2 questions for ELV
David Windley
Jefferies Financial Group Inc.
2 questions for ELV
Josh Raskin
Nathron Research
2 questions for ELV
A.J. Rice
UBS Group AG
1 question for ELV
Christian Borgmeyer
TD Cowen
1 question for ELV
Michael Ha
Robert W. Baird & Co.
1 question for ELV
Whit Mayo
Leerink Partners
1 question for ELV
Recent press releases and 8-K filings for ELV.
- Elevance Health implements a leadership restructure to simplify decision-making and strengthen execution across Carelon and Health Benefits.
- Mark Kaye, EVP & CFO, will expand his role to oversee Carelon’s healthcare services operations, including pharmacy services, behavioral health, and value-based care.
- Felicia Norwood, EVP & Chief Health Benefits Officer, will lead the newly consolidated Health Benefits organization, unifying Commercial and Government health benefits under one structure.
- Peter D. Haytaian will transition from President of Carelon on May 4, 2026, and serve as Special Advisor through December 31, 2026 to support an orderly leadership handover.
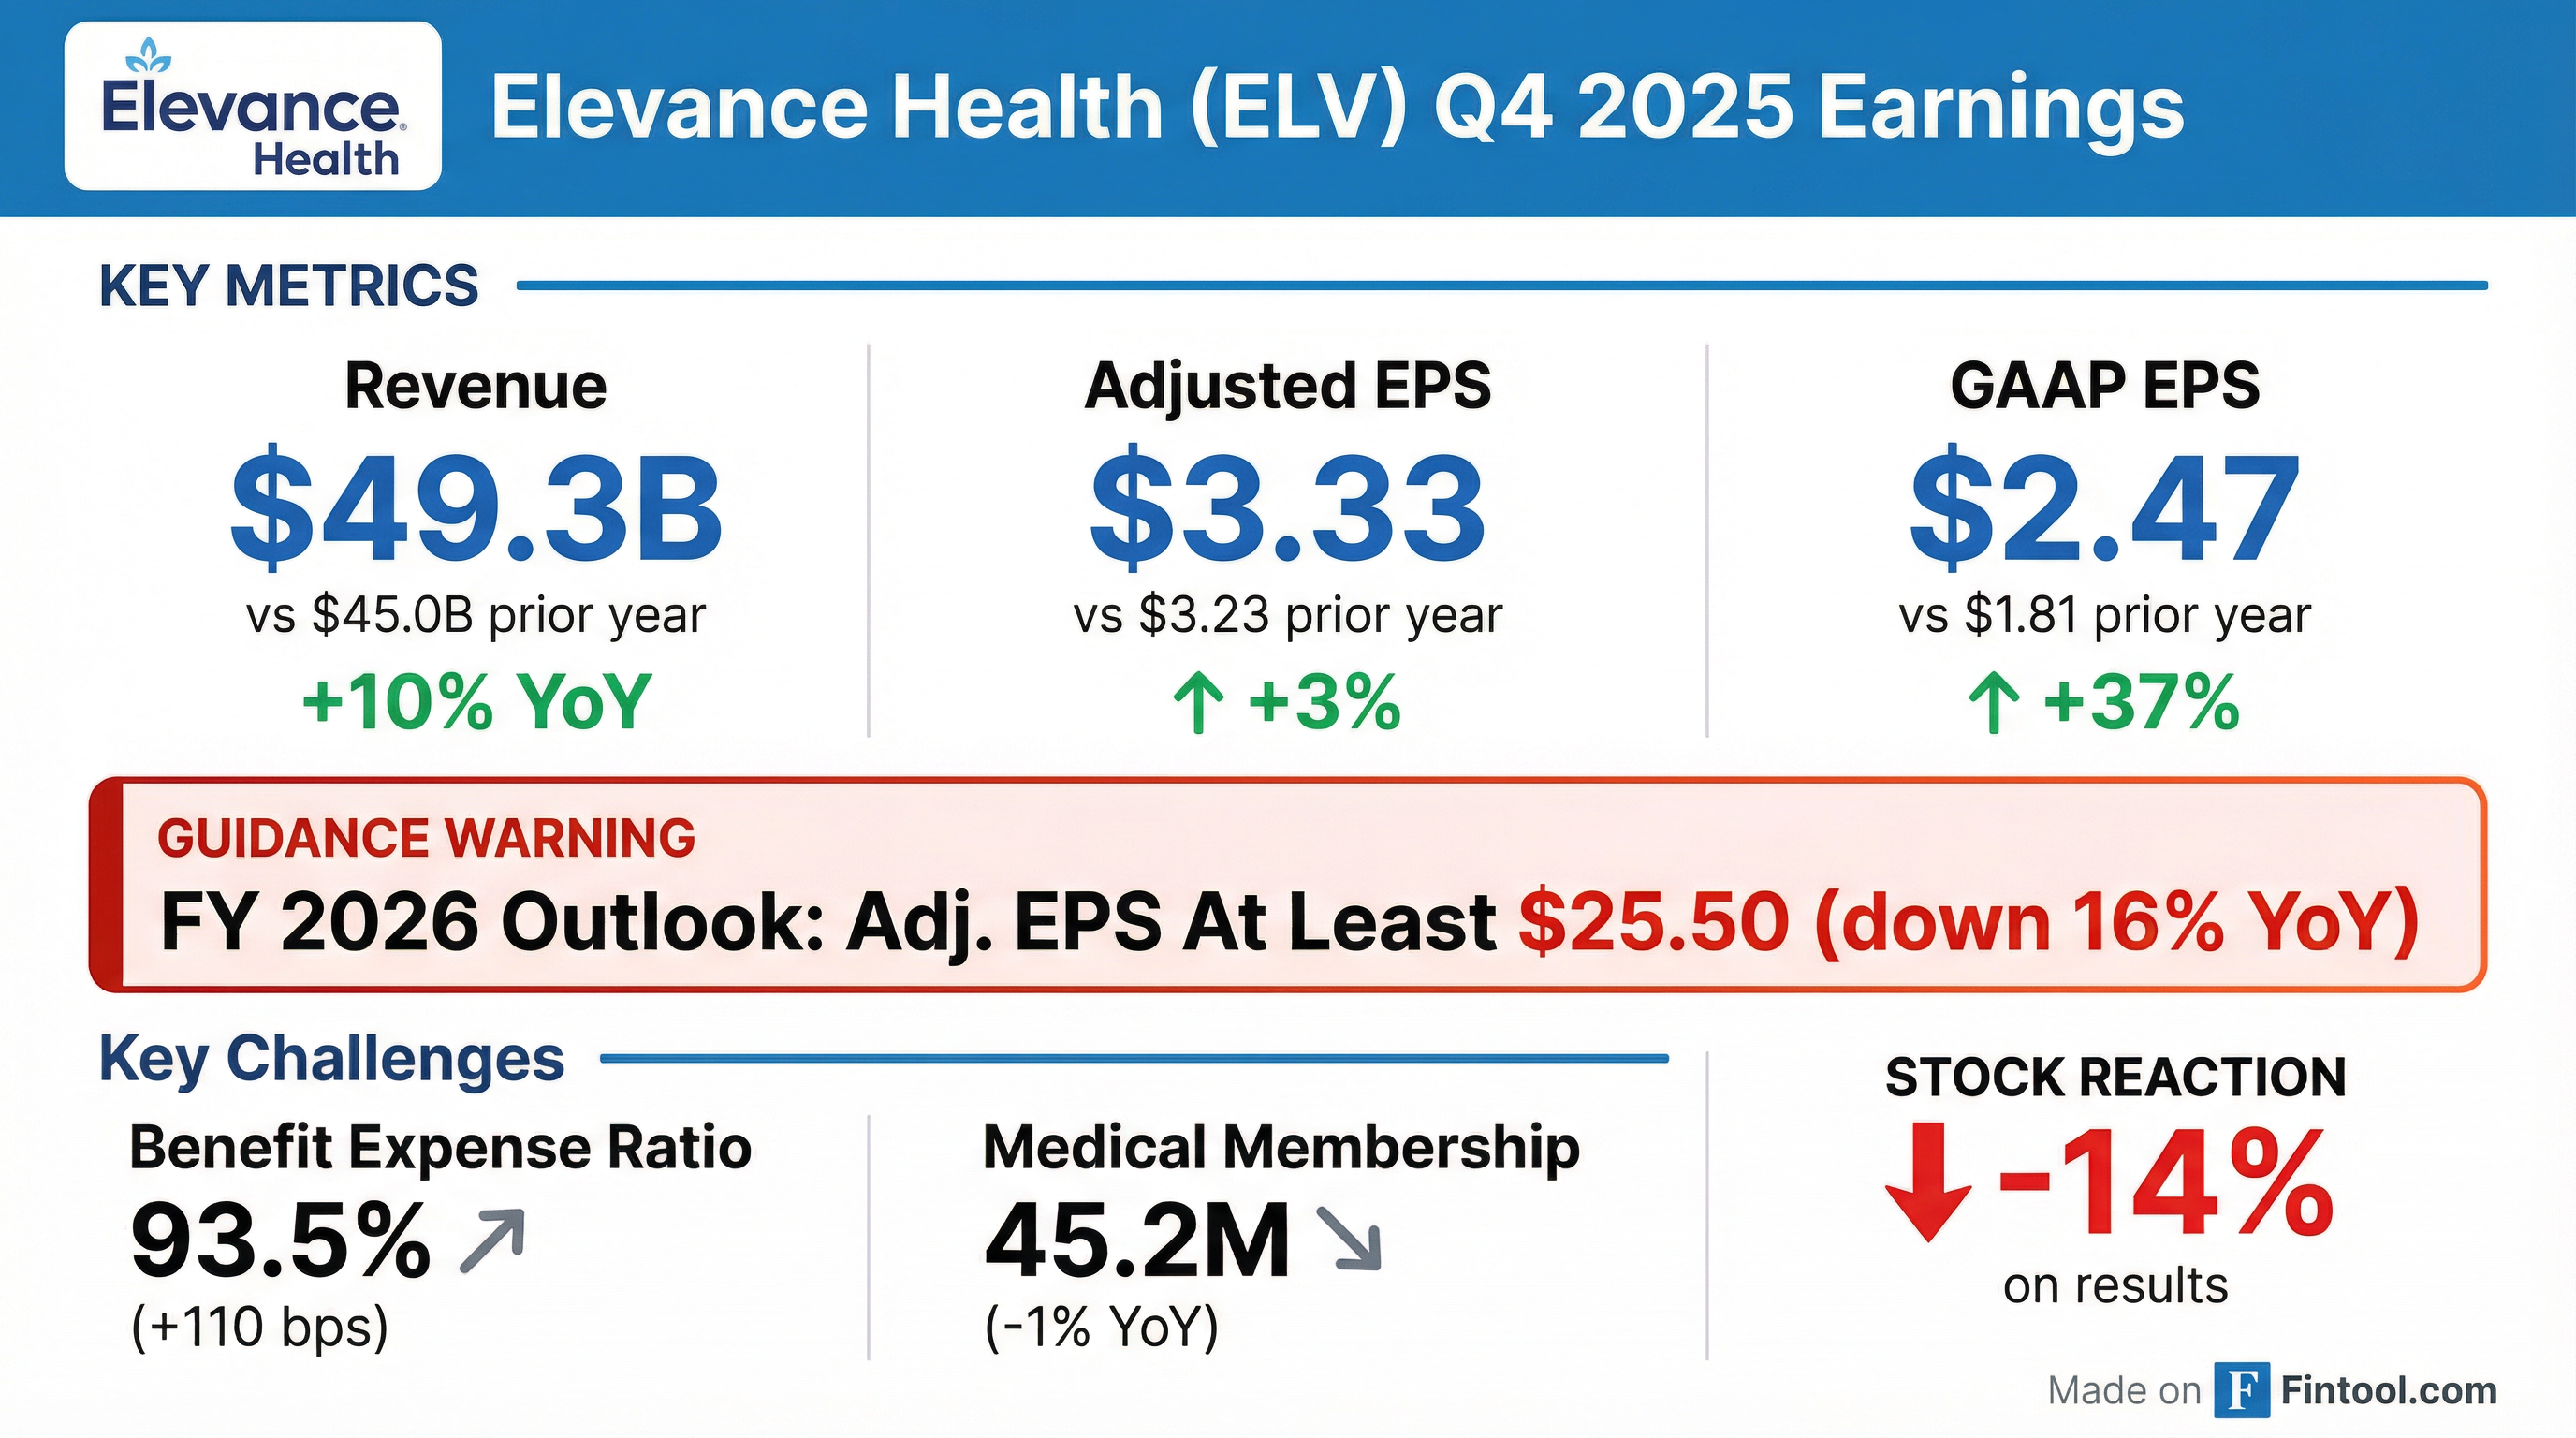
- Management set 2026 adjusted EPS guidance of at least $25.50, with operating revenue expected to decline low-single-digit % driven by membership declines, a consolidated medical loss ratio of 90.2% ±150 bps, and an adjusted operating expense ratio of 10.6% ±150 bps.
- 2026 is viewed as a trough year: Medicaid operating margin projected at approximately –1.75% amid membership declines and rate lag; Medicare Advantage membership is expected to drop in the high-teens % range; ACA plans are being repriced for elevated costs and subsidy expirations.
- Long-term targets were recalibrated to reflect current business mix: enterprise margin of 5–6%, health benefits mid-single-digit margins, and a return to at least 12% adjusted EPS growth in 2027 off the 2026 baseline.
- Capital deployment includes approximately $2.3 billion in share repurchases in 2026, with a reduced M&A focus and opportunistic buybacks prioritized.
- Q4 2025 adjusted diluted EPS of $3.33 (up 3.1% year-over-year) and full-year EPS of $30.29 (down 8.3%) driven by non-recurring 2024 tax benefits.
- Operating revenue of $49.3 billion in Q4 2025 (+9.6% YoY) and $197.6 billion for the full year (+12.8%) on higher premium yields, acquisitions, and Medicare Advantage membership growth.
- Benefit expense ratio of 93.5% in Q4 2025 and 90.0% for 2025; 2026 guidance targets a ratio of 90.2% ± 50 bps alongside a low-single-digit decline in operating revenue.
- 2026 adjusted diluted EPS guidance of at least $25.50, with an adjusted operating gain projected at a minimum of $6.8 billion.
- Ended Q4 with 45.2 million members, down ~500,000 YoY driven by Medicaid eligibility reverifications.
- Q4 operating revenue of $49.3 billion (+10% YoY), full-year benefit expense ratio of 90% and adjusted operating expense ratio of 10.5%.
- 2026 guidance: ≥ $25.50 adjusted diluted EPS; low-single-digit % revenue decline; medical loss ratio 90.2% (±50 bps); operating expense ratio 10.6% (±50 bps); ~65% of EPS in Q1.
- Segment outlook: Medicaid operating margin ~ -1.75%; Medicare Advantage membership down high-teens % with margin improvement; continued commercial momentum in ASO national accounts.
- Returned $4.1 billion of capital in 2025 including $2.6 billion of share repurchases; plans $2.3 billion of buybacks in 2026.
- Elevance reported adjusted diluted EPS of $3.33 in Q4 2025 and $30.29 for the full year.
- Operating revenue rose 10% year-over-year to $49.3 billion in Q4, while membership decreased by about 500,000 to 45.2 million.
- 2026 guidance assumes mid-single-digit cost trend, Medicaid operating margin of approximately –1.75%, and expects Medicare Advantage membership to decline in the high-teens % with meaningful margin improvement.
- Long-term margin targets refined to 5–6% enterprise margin, mid-single-digit health benefits margins, and unchanged targets for Carelon Services.
- Elevance Health posted 4Q 2025 operating revenue of $49.3 billion (+9.6% y/y) and full-year 2025 revenue of $197.6 billion (+12.8% y/y); 4Q GAAP diluted EPS was $2.47 (adjusted $3.33), and FY GAAP EPS was $25.21 (adjusted $30.29).
- The company projects FY 2026 GAAP diluted EPS of at least $22.30 and adjusted diluted EPS of at least $25.50.
- Returned $4.1 billion of capital to shareholders in 2025 and declared a Q1 2026 dividend of $1.72 per share, payable March 25, 2026.
- Total medical membership stood at 45.2 million as of December 31, 2025, down 1% year over year, driven by Medicaid attrition.
- Operating revenue of $49.3 billion in Q4 2025 and $197.6 billion for FY 2025, up 10% and 13% respectively
- Q4 2025 GAAP EPS $2.47 and adjusted EPS $3.33; FY 2025 GAAP EPS $25.21 and adjusted EPS $30.29
- Projects FY 2026 GAAP EPS of at least $22.30 and adjusted EPS of at least $25.50
- Returned $4.1 billion of capital to shareholders in 2025, including $471 million in Q4 share repurchases and a $1.71 Q4 dividend; declared Q1 2026 dividend of $1.72
- Elevance Health has issued a policy effective October 21, 2025 covering HistoSonics’ non-invasive histotripsy system for liver tumors
- Coverage applies to commercial, Medicare, and Medicaid plans in 14 states, including California, Colorado, Connecticut, Georgia, Indiana, Kentucky, Maine, Missouri, Nevada, New Hampshire, New York, Ohio, Virginia, and Wisconsin
- The expansion increases access to approximately 45.4 million members
- Decision is based on growing clinical evidence of long-term safety and efficacy of HistoSonics’ histotripsy therapy
- Elevance Health will extend insurance coverage for HistoSonics’ non-invasive histotripsy treatment of hepatic tumors to about 45.4 million members across its commercial, Medicare and Medicaid plans, effective October 21, 2025.
- Coverage will include plans in 14 states—California, Colorado, Connecticut, Georgia, Indiana, Kentucky, Maine, Missouri, Nevada, New Hampshire, New York, Ohio, Virginia and Wisconsin—broadening patient access to the therapy.
- The decision is driven by growing clinical evidence of the long-term safety and efficacy of the Edison® Histotripsy System, with additional real-world data currently being collected worldwide.
- Elevance Health will extend insurance coverage for HistoSonics’ Edison® histotripsy system to 45.4 million plan members across 14 states, broadening access to non-invasive liver tumor treatment.
- The Edison® system, FDA-cleared via De Novo in October 2023, uses focused ultrasound to mechanically ablate tumors without incision, radiation, or heat.
- In the HOPE4LIVER pivotal trial, the system achieved 90 % tumor control at 12 months with comparable outcomes and shorter recovery versus existing ablation therapies.
- Coverage decisions build on multiple Blue Cross Blue Shield plan approvals, and HistoSonics is pursuing UNOS recognition to include histotripsy in liver transplant candidate selection.
Quarterly earnings call transcripts for Elevance Health.
Ask Fintool AI Agent
Get instant answers from SEC filings, earnings calls & more