Equitable Holdings (EQH)·Q4 2025 Earnings Summary
Equitable Beats on Both Lines as Capital-Light Transformation Gains Momentum
February 5, 2026 · by Fintool AI Agent
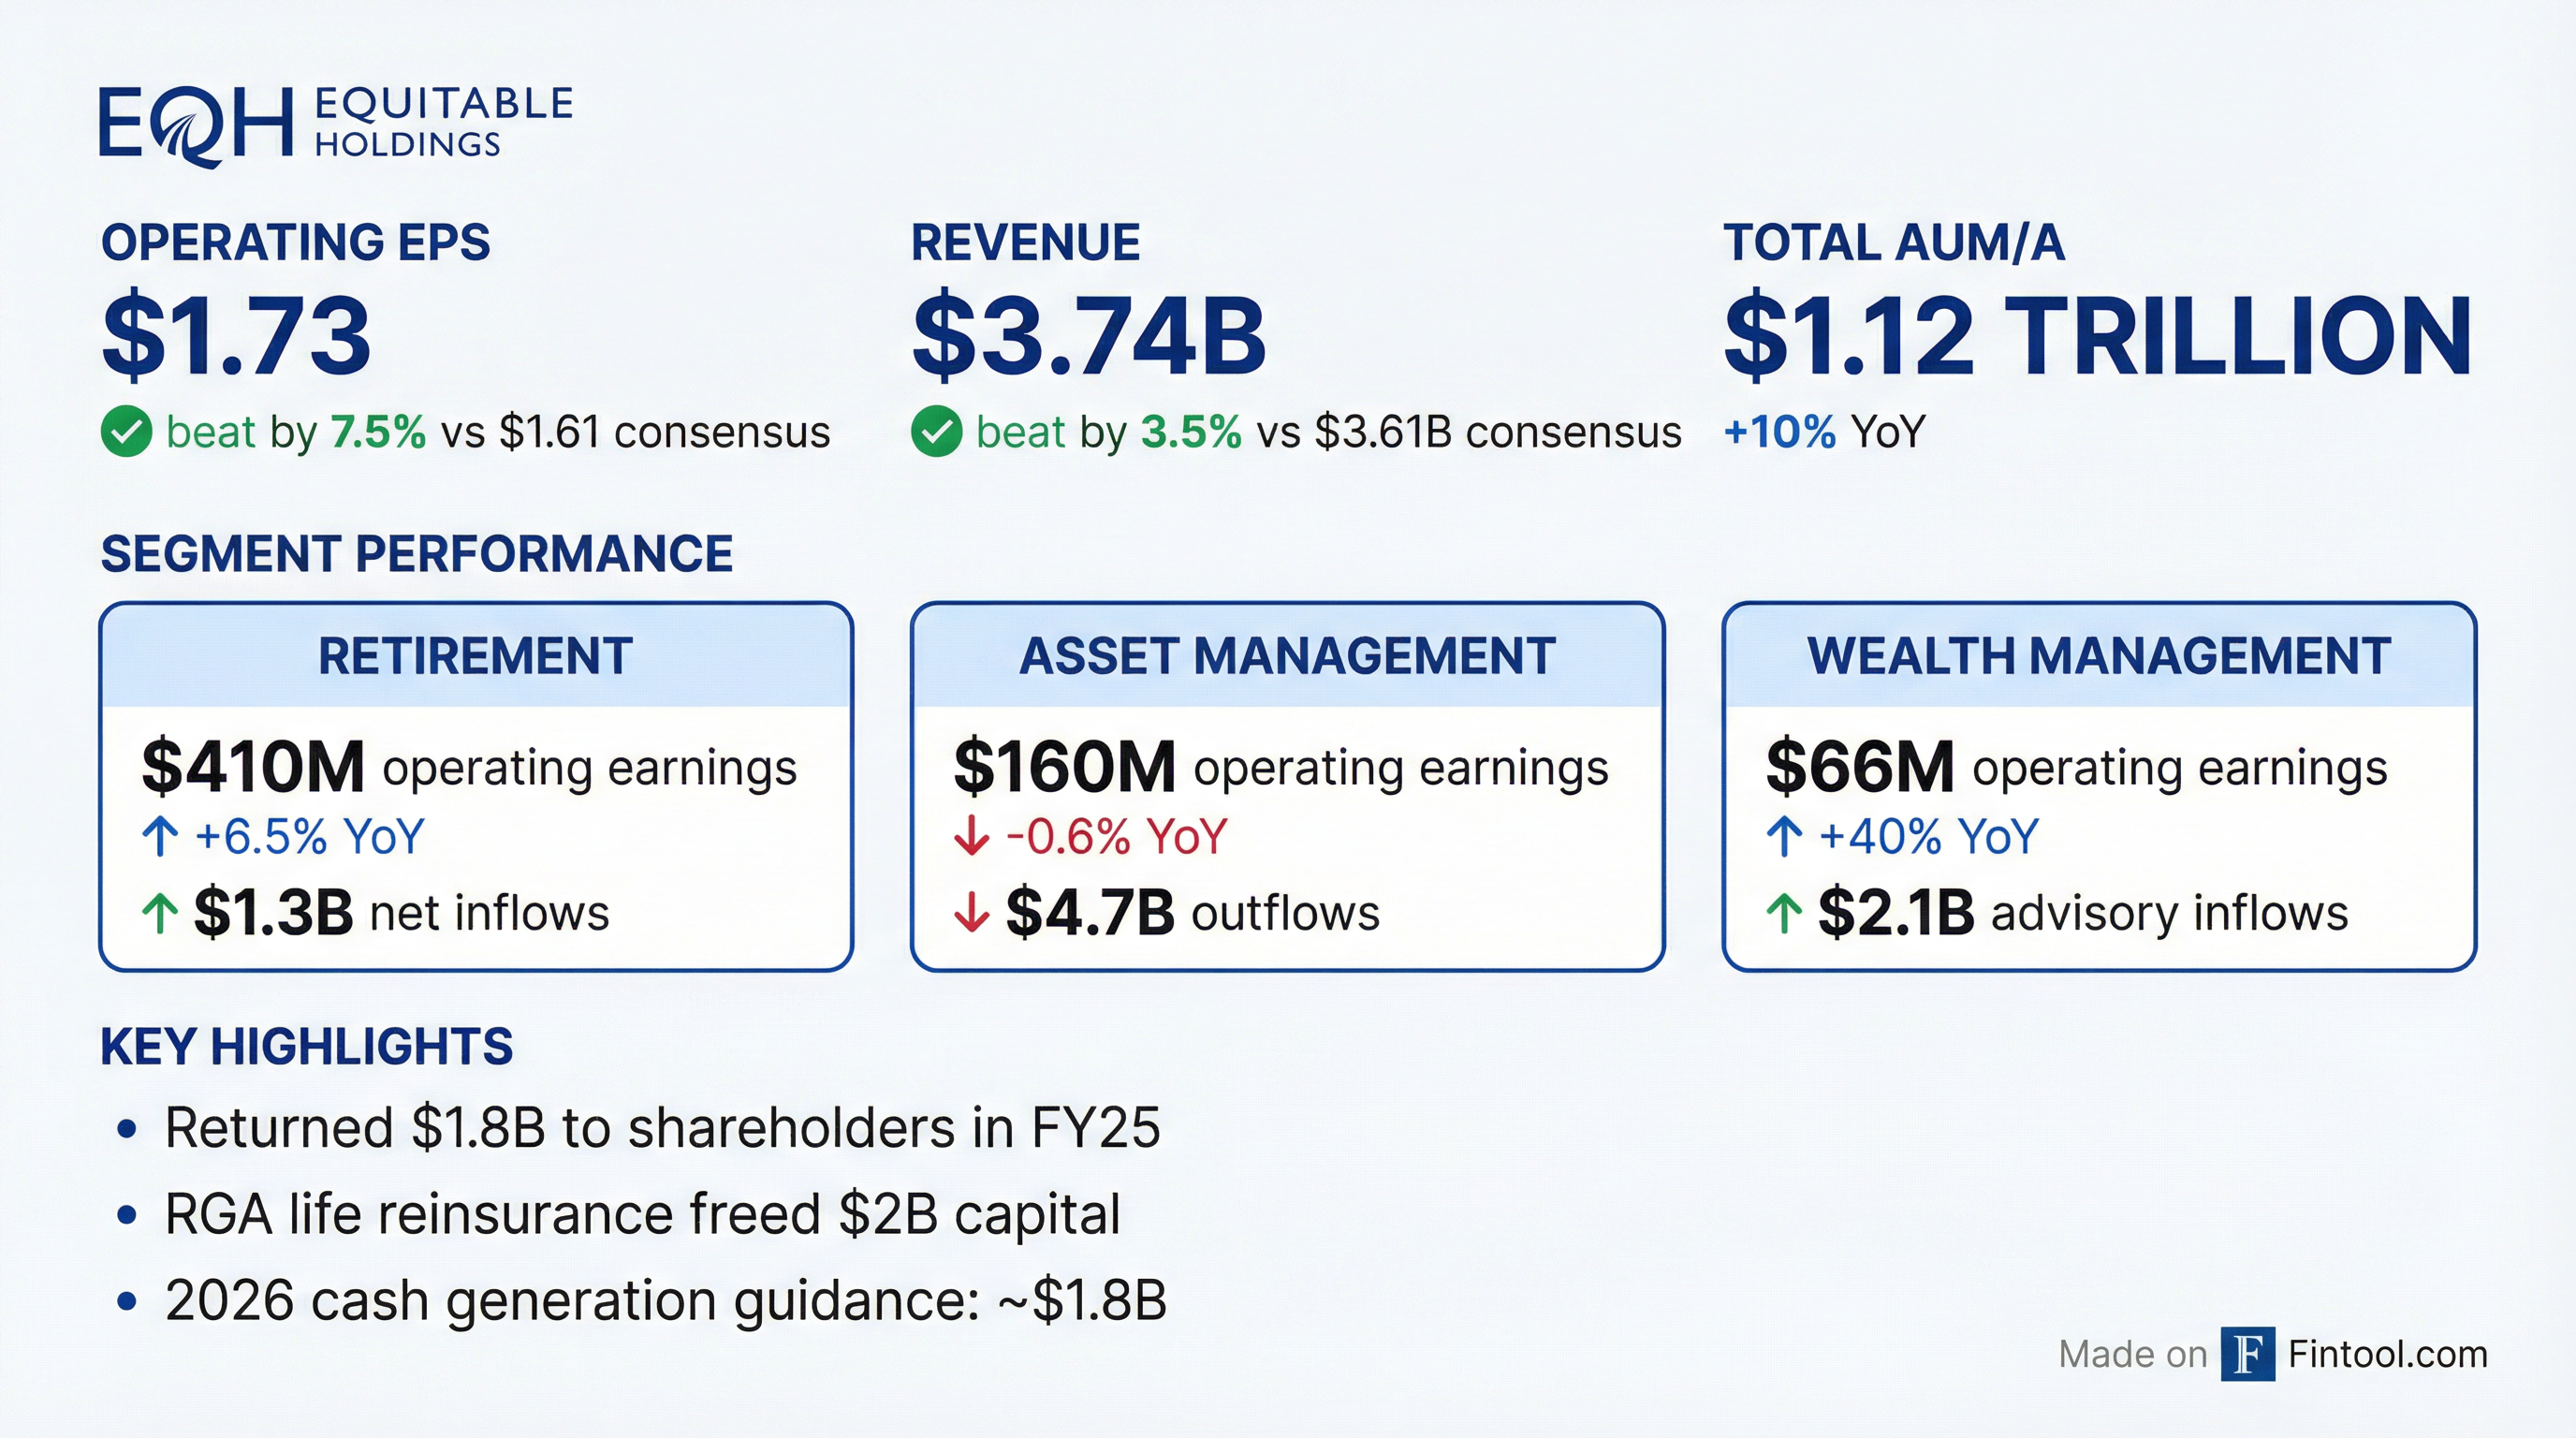
Equitable Holdings delivered a double beat in Q4 2025, with operating EPS of $1.73 (+7.5% vs. consensus) and revenue of $3.74B (+3.5% vs. consensus). The quarter capped a transformational year that saw the company reinsure 75% of its individual life block to RGA, freeing $2 billion of capital and materially reducing mortality exposure.
Total AUM/A crossed $1.1 trillion for the first time, up 10% year-over-year, while the company returned $1.8 billion to shareholders — at the high end of its 60-70% payout target.
Did Equitable Beat Earnings?
Yes — on both revenue and EPS.
The beat was driven by:
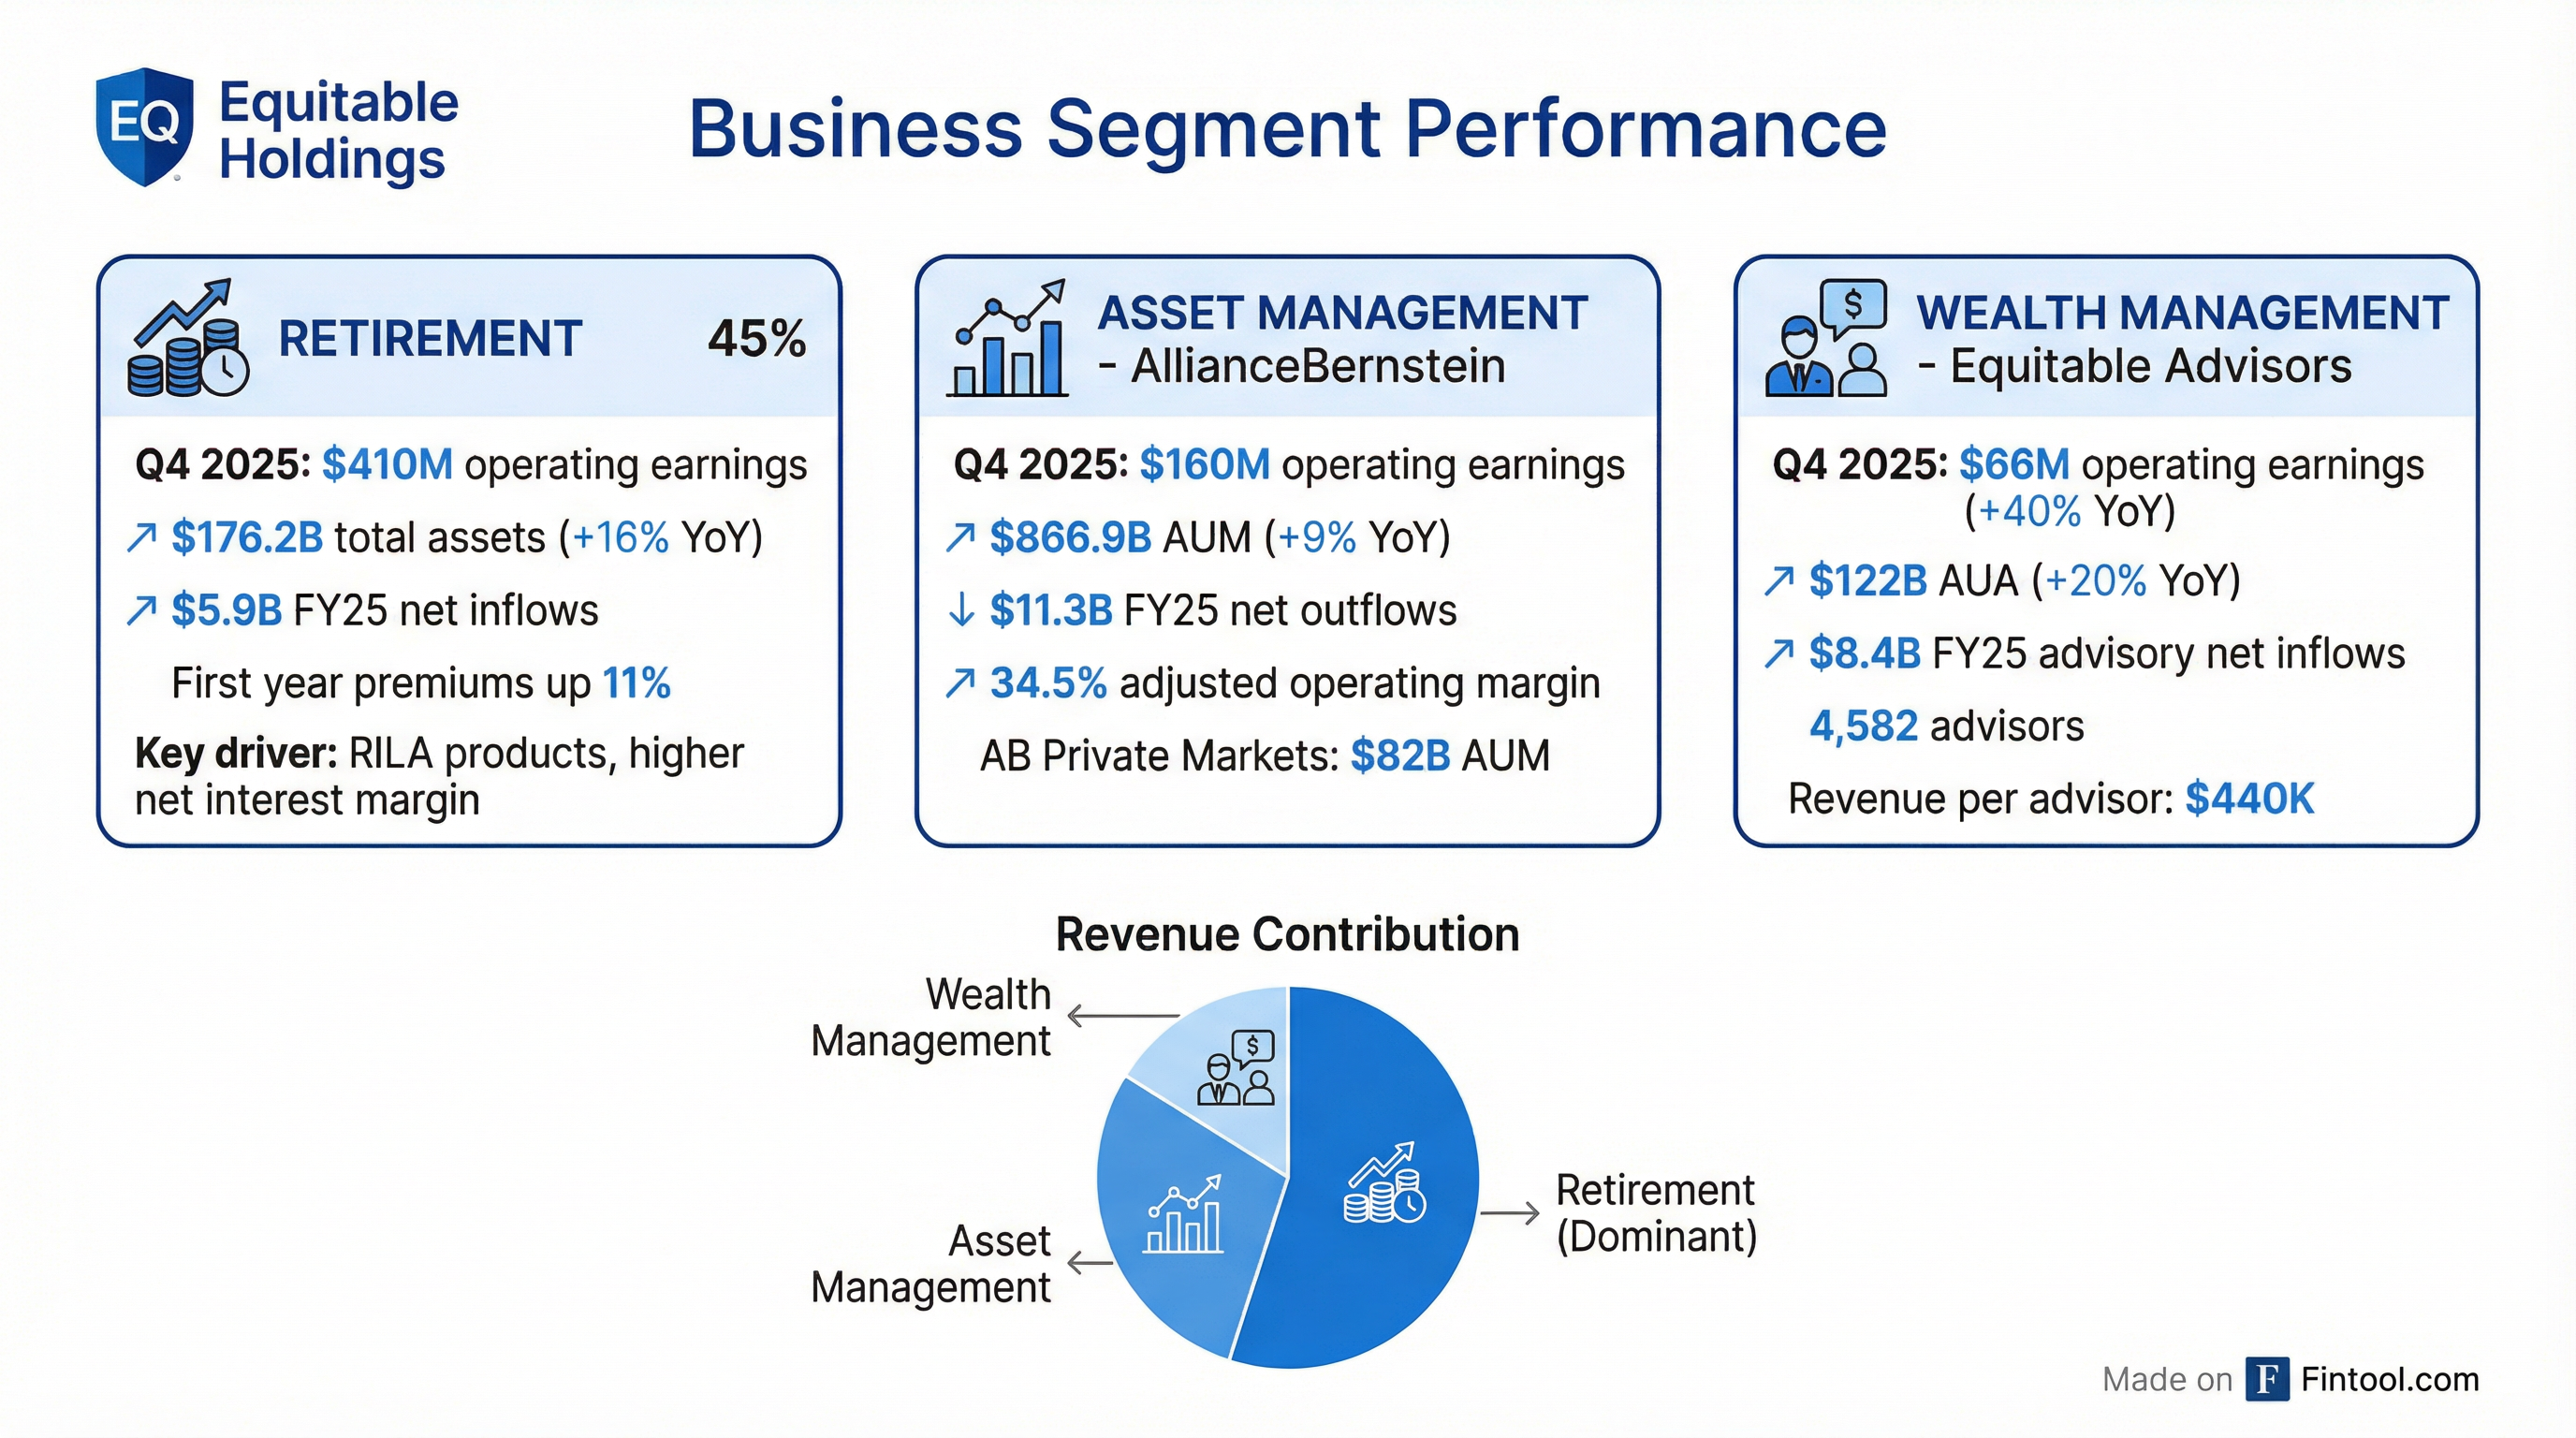
- Retirement: Operating earnings up 6.5% to $410M on higher net interest margin and fee income
- Wealth Management: Operating earnings surged 40% to $66M on higher AUA and transaction activity
- Lower effective tax rate in Retirement segment
Adjusting for notable items of $10M, Q4 operating EPS was $1.76 vs. $1.63 in the prior year.
What Did Management Guide?
Cash generation accelerating; 2026 EPS growth expected to exceed the 12-15% target.
CFO Robin Raju: "Putting it all together, we expect growth in 2026 earnings per share, excluding notable items, to exceed our 12%-15% target."
CEO Mark Pearson emphasized the company's improved positioning: "We have been intentional about refining our business mix to focus on three core growth engines: U.S. retirement, asset management, and wealth management. These are very attractive and growing markets, and they are integral to our mission of helping our clients secure their financial well-being."
2026 Segment Guidance
Tax Rate Guidance
Management noted potential for additional opportunistic tax benefits in 1H'26.
Market Sensitivities
The 2026 cash generation guidance of ~$1.8B assumes:
- 6% equity returns
- 2% dividend yield
- Interest rates following the forward curve
How Did the Stock React?
Flat — the beat was largely expected.
The muted reaction reflects the market's focus on full-year GAAP losses ($1.4B or -$4.83/share) driven by variable annuity product features and investment losses from the RGA transaction.
What Changed From Last Quarter?
Capital structure transformed; segment mix shifting.
Key developments since Q3:
- RGA transaction closed: Freed $2B capital, reduced mortality exposure by 75%
- Expense savings on track: Achieved $120M of $150M run-rate target
- Incremental investment income target achieved: $110M target hit with opportunity for further upside
- AB outflows worsened: $4.7B Q4 outflows driven by Retail and Institutional
How Did Each Segment Perform?
Retirement — The Growth Engine
RILA (registered indexed-linked annuities) drove the growth with record sales, up 12% YoY. Equitable was a top-five FABN issuer with $5B issued in 2025, expanding spread lending capabilities.
Asset Management (AllianceBernstein) — Mixed Results
Bright spot: AB Private Markets reached $82B AUM, benefiting from EQH's $19B capital deployment commitment.
Wealth Management — Standout Performer
Pre-tax operating margin expanded to 16.4% from 12.3% a year ago.
On competitive hiring pressure: "We recruited $1.4 billion in assets for the year in 2025... There are about 150,000 Series 7 producers. About 12,000 a year are looking for new homes. We hired a 20-year veteran to run our EXP hires... We are very intentional about the type of advisors we target." — Nick Lane
Capital Deployment Efficiency
New business delivers 15%+ IRR with growing value creation.
VNB represents the present value of future cash flows above capital deployed — a key metric showing how efficiently Equitable is deploying growth capital. The 15%+ IRR on new business demonstrates strong unit economics.
CFO Robin Raju noted: "VNB payback period has come down over time and IRRs have gone up. The RILA product is a shorter duration product compared to most of the longer duration products that we've been selling... much shorter duration, faster payback periods, faster cash conversion on the product portfolio that we sell today."
Capital Return and Balance Sheet
Aggressive buybacks; leverage elevated but manageable.
The elevated debt-to-capital ratio reflects significant AOCI losses (unrealized investment losses) rather than increased borrowings. Adjusting for AB at market value, debt-to-capital is 24.9%.
Investment Portfolio Quality
Conservative positioning with high-quality assets.
The alternatives portfolio has delivered a ~10% average return since 2017, with management continuing to expect 8-12% annual returns over time. Q4 2025 alternatives return was 7.8% annualized.
Q&A Highlights — What Analysts Asked
Private Credit Exposure
The most pressing question: is Equitable exposed to the software lending concerns rippling through private credit?
Robin Raju, CFO: "Private credit is about 16% of our total GA. Within that, almost 50% is corporate private placements, which is nothing new for insurance companies... Direct lending is 1% of the total GA. Software, specifically within the direct lending, is 15 basis points of the total General Account — it's really immaterial for us."
Onur Erzan, AB President: "Over the last decade plus, we have deployed $15 billion with software companies. We had zero net losses in that. When we look at our current portfolio, our elevated risk rating is only 3% of those companies."
RILA Market Competition
With new entrants offering teaser rates, is Equitable's market leadership at risk?
Nick Lane, President: "We see players enter at the tail end of 2024, so we've been operating in this new normal for over a year. Traditionally, we see new entrants offer teaser rates and then revert to more sustainable levels, and we saw this dynamic in the fourth quarter."
Mark Pearson, CEO: "There's about $600 billion of assets coming out of 401(k)s a year, going precisely into this type of market... We don't look at market share, we look at sales growth, and sales growth is at record level."
AB Valuation Gap
Why does Equitable trade at ~6x earnings when AB has done so well?
Mark Pearson: "We see the gap as well, and it is perplexing. Having said that, AB has done incredibly well... Looking at our valuation, I think there's two or three things — attractive and growing markets, a good track record of execution. It certainly is not an expensive stock now. It's 6x future earnings."
In-Plan Annuity Opportunity
How big is the institutional retirement opportunity?
Nick Lane: "It's an $8 trillion DC market. We see the potential addressable market being about $400 billion-$600 billion for in-plan solutions. We're still in the early innings, but there is momentum... We had roughly $920 million in sales in our broader institutional business for the year."
Mortality Exposure
What's the remaining risk after the RGA deal?
Robin Raju: "In the quarter, we did see a mix of some large claims, also smaller claims that we didn't have reinsurance coverage on before the RGA transaction benefits kick in. So this led to about $25 million adverse mortality in the quarter. For 2026, we felt prudent to include in our corporate and other guide of $350 million-$400 million an increased GAAP guidance of about $50 million in terms of mortality."
Key Risks and Concerns
-
GAAP Losses Obscure Results: Full year net loss of $1.4B makes headline comparisons difficult. Variable annuity hedging and investment losses drove the GAAP shortfall.
-
AB Outflows Persistent: Asset Management has now seen net outflows in 4 consecutive quarters, with $11.3B FY25 outflows including $4B related to the RGA transaction.
-
Interest Rate Sensitivity: The 2026 guidance assumes rates follow the forward curve — a Fed pivot could pressure spread earnings.
-
Book Value Erosion: Book value per share ex-AOCI declined 36% YoY to $18.14 from $28.30. However, management argues the more meaningful measure is adjusted book value with AB at market value, which stood at $33.84.
What Did Management Avoid?
- No specific EPS dollar guidance for 2026 — only stated it will exceed 12-15% growth, no point estimate
- VNB payback period not quantified — CFO said it's "materially lower" but wouldn't disclose the actual number
- No subsegment disclosure within Corporate & Other — when pressed on life insurance visibility, CFO said: "We're not gonna disclose subsegments within corporate and other because there's noise within there"
- No structural solution to AB valuation gap — CEO acknowledged it's "perplexing" but offered no concrete plan beyond execution
Forward Catalysts
The Bottom Line
Equitable delivered a solid beat in Q4, but the real story is the structural transformation. The RGA life reinsurance deal fundamentally reshapes the company — less mortality risk, more fee-based earnings, better capital flexibility. With over 50% of cash generation now from Asset and Wealth Management, EQH is becoming a different company than it was two years ago.
The challenge: AB outflows remain a headwind, and the industry-wide fee compression isn't going away. The investment in Private Markets ($82B AUM) is the bet that higher-margin alternatives can offset traditional asset management decay.
At ~8x operating earnings and returning capital aggressively, the valuation isn't demanding — if you believe the transformation plays out.
View Equitable Holdings Company Page