Earnings summaries and quarterly performance for EQUITY RESIDENTIAL.
Executive leadership at EQUITY RESIDENTIAL.
Mark J. Parrell
Chief Executive Officer
Alexander Brackenridge
Executive Vice President and Chief Investment Officer
Barry S. Altshuler
Executive Vice President – Investments
Catherine M. Carraway
Executive Vice President and Chief Human Resources Officer
Michael L. Manelis
Executive Vice President and Chief Operating Officer
Robert A. Garechana
Executive Vice President and Chief Financial Officer
Scott J. Fenster
Executive Vice President, General Counsel and Corporate Secretary
Board of directors at EQUITY RESIDENTIAL.
Angela M. Aman
Director
Ann C. Hoff
Director
David J. Neithercut
Chairman of the Board
Linda Walker Bynoe
Director
Mark S. Shapiro
Director
Mary Kay Haben
Director
Nina P. Jones
Director
Stephen E. Sterrett
Lead Independent Director
Tahsinul Zia Huque
Director
Research analysts who have asked questions during EQUITY RESIDENTIAL earnings calls.
Alexander Goldfarb
Piper Sandler
9 questions for EQR
Steve Sakwa
Evercore ISI
9 questions for EQR
Rich Hightower
Barclays
8 questions for EQR
Eric Wolfe
Citi
7 questions for EQR
John Kim
BMO Capital Markets
7 questions for EQR
Adam Kramer
Morgan Stanley
6 questions for EQR
Brad Heffern
RBC Capital Markets
6 questions for EQR
Jamie Feldman
Wells Fargo & Company
6 questions for EQR
John Pawlowski
Green Street
6 questions for EQR
Haendel St. Juste
Mizuho Financial Group
5 questions for EQR
Julien Blouin
The Goldman Sachs Group, Inc.
5 questions for EQR
Jana Galan
Bank of America
4 questions for EQR
Michael Goldsmith
UBS
4 questions for EQR
Alex Kim
Zelman & Associates
3 questions for EQR
David Segall
Green Street
3 questions for EQR
Omotayo Okusanya
Deutsche Bank AG
3 questions for EQR
Alexander Kim
Zelman & Associates
2 questions for EQR
Ami
UBS
2 questions for EQR
Ami Probandt
UBS
2 questions for EQR
Haendel Juste
Mizuho
2 questions for EQR
Ianna Gallen
Bank of America
2 questions for EQR
James Feldman
Wells Fargo
2 questions for EQR
Jeffrey Spector
BofA Securities
2 questions for EQR
Linda Tsai
Jefferies
2 questions for EQR
Nick Joseph
Citigroup Inc.
2 questions for EQR
Richard Anderson
Wedbush Securities
2 questions for EQR
Alex Brackenridge
Zelman & Associates
1 question for EQR
Alex Kalmus
Zelman & Associates
1 question for EQR
Anthony Paolone
JPMorgan Chase & Co.
1 question for EQR
Daniel Tricarico
Scotiabank
1 question for EQR
Daniel Tucker
Scotiabank
1 question for EQR
Haendel St. Just
Mizuho Securities
1 question for EQR
Linda Yu Tsai
Jefferies Financial Group Inc.
1 question for EQR
Michael Gorman
BTG Pactual
1 question for EQR
Mike Coto
Mizuho Securities
1 question for EQR
Nicholas Yulico
Scotiabank
1 question for EQR
Recent press releases and 8-K filings for EQR.
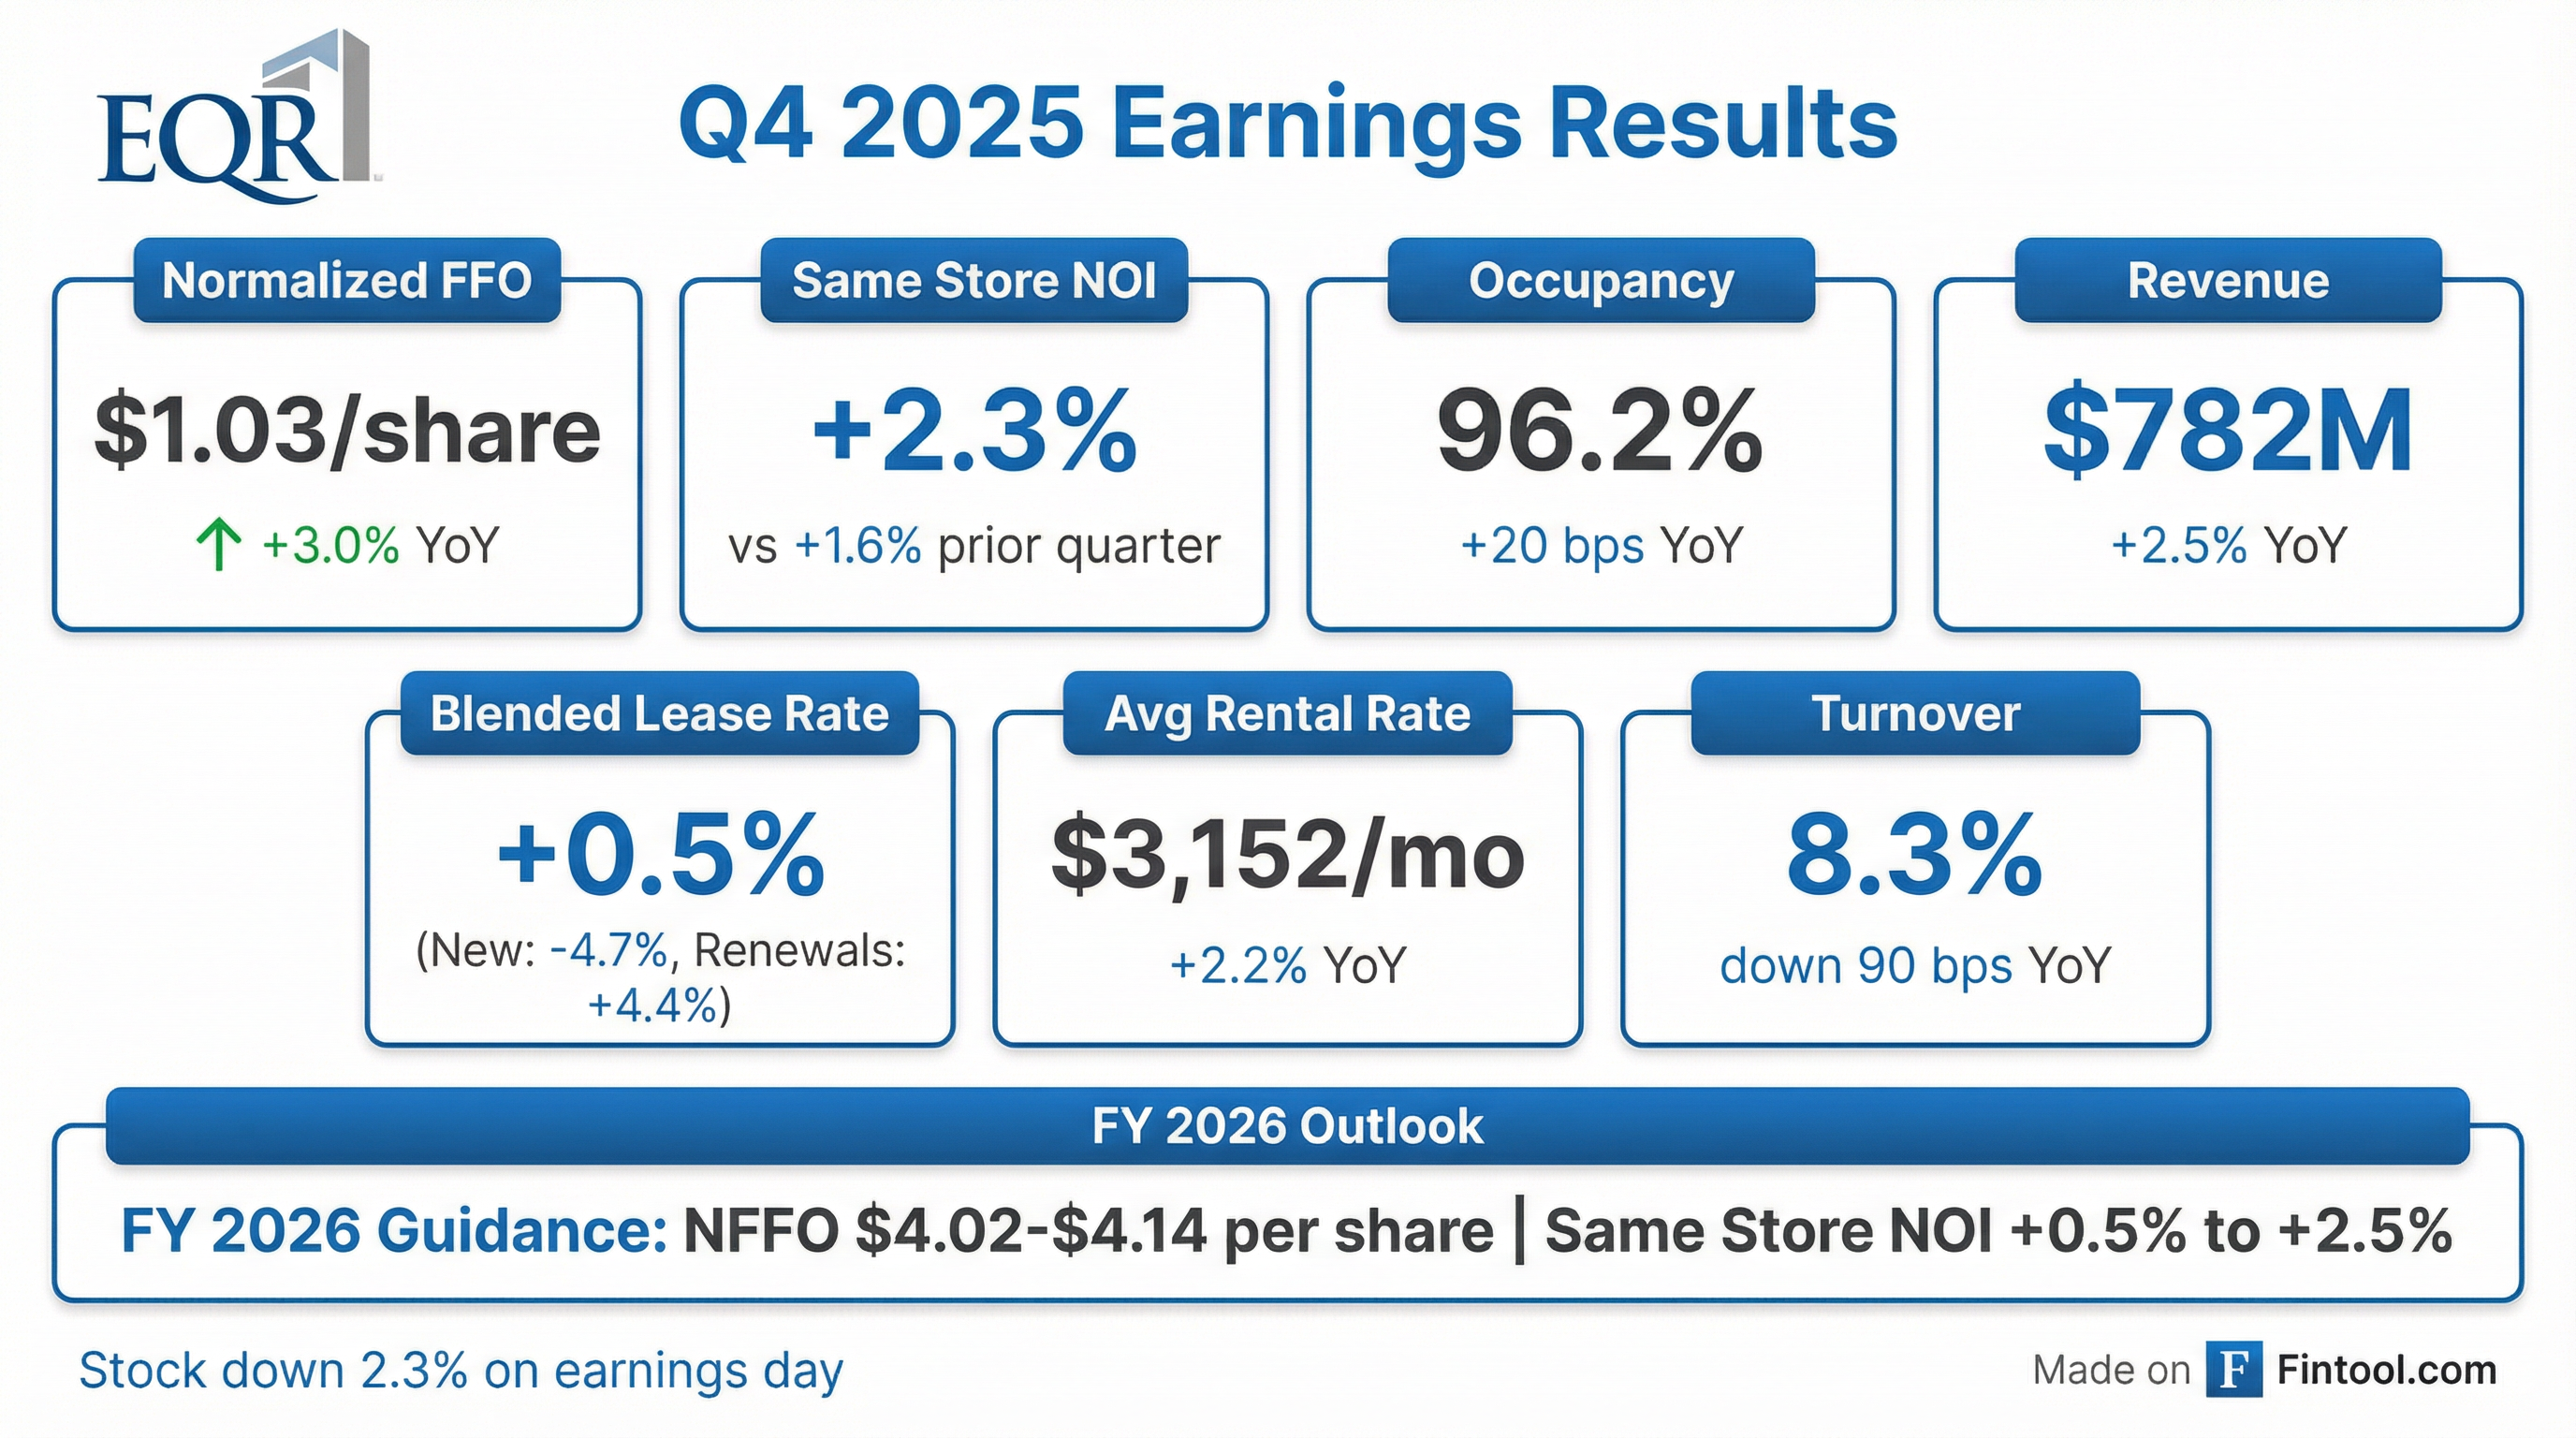
- Full-year 2025 same-store revenue grew 2.6%, expenses rose 3.7%, and NOI increased 2.2%; in Q4 2025, revenue was up 2.5%, expenses up 2.9%, NOI up 2.3%, and physical occupancy was 96.2%.
- Q4 2025 EPS was $1.00, FFO per share was $0.97, and normalized FFO per share was $1.03.
- For 2026, the company guides same-store revenue growth of 1.2%–3.2%, expense growth of 3.0%–4.0%, and NOI growth of 0.5%–2.5%, with EPS of $1.44–$1.56, FFO of $3.98–$4.10, and NFFO of $4.02–$4.14.
- Guidance assumes weighted average debt of $8.33 B–$8.53 B, net interest expense of $321 M–$327 M, and reinvestment of approximately $200 M of 2025 disposition proceeds into share repurchases in H1 2026.
- 2025 Same Store NOI matched initial guidance; portfolio occupancy exceeded 96%, with San Francisco and New York driving outperformance amid broader market deceleration.
- Returned $1.3 billion to shareholders in 2025 through $300 million of share repurchases and dividends, prioritizing buybacks over acquisitions given current capital costs.
- 2026 guidance: Same Store revenue growth of 1.5%–3.0%, Same Store expense growth of 3%–4%, and normalized FFO per share of $4.08 (up 2.25% vs. 2025).
- Plan to refinance a $500 million 2.85% note due Nov 2026 and a $92 million stub payment, with net debt/EBITDAre at 4.3× and an S&P positive outlook.
- Equity Residential reported Net income of $391.5 million for Q4 2025, down from $433.9 million in Q4 2024.
- Q4 2025 EBITDAre was $458.8 million, slightly below the $462.8 million recorded in Q4 2024.
- Weighted average diluted shares totaled 388.7 million in Q4 2025.
- Trailing twelve months EBITDAre reached $1.855 billion as of December 31, 2025.
- Same Store NOI in 2025 matched guidance, though rental revenue momentum decelerated later in the year across most markets except San Francisco and New York.
- 2026 Same Store revenue guidance assumes blended rate growth of 1.5%–3% with portfolio occupancy of 96.4%, reflecting steady demand and improving supply conditions.
- 2026 Same Store expense growth is forecast at 3%–4%, with bulk internet rollout adding 70 bps in expenses but contributing ~$6 million to NOI.
- Normalized FFO per share is guided to $4.08, up 2.3%, driven by Same Store performance, lease-up stabilization, and offsetting sales with share repurchases.
- Capital allocation in 2025 included $300 million of share buybacks ($1.3 billion total returns) funded by property sales, with further repurchases planned to enhance growth.
- Q4 occupancy at 96.4%, achieved renewal rate 4.5% with blended rent change +0.5%, driven by low turnover and strong retention.
- 2026 Same Store revenue guidance: 1.5–3.0% blended rate growth, stable occupancy at ~96.4%, and 40 bps contribution from other income.
- 2026 Same Store expenses expected to grow 3–4%; bulk Wi-Fi rollout to add 70 bps of expense (net $6 m NOI); Normalized FFO per share guidance $4.08 (+2.25%).
- Returned $1.3 bn to shareholders in 2025 via dividends and buybacks (including $300 m repurchased), targeting further share repurchases funded by asset sales; net debt/EBITDAre 4.3×, S&P outlook positive.
- 30% of NOI concentrated in New York and San Francisco markets; competitive supply in core markets to decline ~35% (~40 k units) in 2026, while expansion markets represent ≈11% of NOI.
- Q4 net income fell to $381 million ($1.00/share) from $419 million ($1.10) year-over-year, while revenue rose 2% to $781.9 million.
- FFO was $376 million ($0.97/share) and normalized FFO increased 3% to $399 million ($1.03/share), narrowly missing consensus.
- For full-year 2025, net income was $1.11 billion ($2.94/share), FFO $1.53 billion ($3.94/share) and normalized FFO $1.55 billion ($3.99/share); same-store revenue and NOI grew 2.6% and 2.2%.
- 2026 guidance calls for same-store revenue growth of 1.2–3.2%, NOI growth of 0.5–2.5%, earnings of $1.44–1.56/share, and FFO of $3.98–4.10/share.
- Q4 EPS of $1.00 down 9.1% YoY, with FFO per share flat at $0.97 and Normalized FFO per share up 3.0% to $1.03.
- For the full year 2025, EPS rose 8.1% to $2.94, FFO per share increased 4.8% to $3.94, and Normalized FFO per share grew 2.6% to $3.99.
- Provided 2026 guidance of EPS $1.44–$1.56, FFO $3.98–$4.10, and Normalized FFO $4.02–$4.14.
- Repurchased and retired ~3.4 million shares in Q4 at an average $61.06 and ~4.8 million shares in 2025 at $62.03, with board authorizing up to 13 million shares.
- Entered a new $2.5 billion unsecured revolving credit facility maturing December 2030 at SOFR + 0.725% plus a 0.125% fee.
- On December 3, 2025, Equity Residential’s operating partnership entered into a $2.5 billion unsecured revolving credit agreement with Bank of America, N.A. as Administrative Agent, replacing its prior $2.5 billion facility and maturing on December 3, 2030.
- The facility bears interest at Term SOFR plus 72.5 basis points and carries a 12.5 basis point annual facility fee, both rates linked to the partnership’s long-term debt rating.
- The agreement includes an accordion feature to increase commitments by up to $1.0 billion and contains customary representations, covenants and events of default.
- Third-quarter results included a 2.2% blended rent increase, 4.5% renewal rate growth, and 96.3% occupancy, led by strong performance in San Francisco and New York, with leasing traffic softening in late September, notably in Washington, DC.
- 2025 same-store revenue guidance revised to 2.5%–3.0% (midpoint 2.75%), same-store expenses held at 3.5%–4.0%, implying same-store NOI of 2.1%–2.6% (mid 2.35%), and normalized FFO per share of $3.98–$4.02 (mid $4.00).
- Returned capital through $100 million of share repurchases in the quarter and narrowed full-year acquisitions and dispositions guidance to $750 million each.
- Management expects an elongated recovery in high-supply Sunbelt markets (Denver, Dallas, Austin, Atlanta), anticipates significant supply declines in 2026 to support growth, and foresees continued deceleration in fourth-quarter pricing trends.
- Strong third-quarter operations: Renewal rate +4.5%, blended rent +2.2%, and occupancy at 96.3%; new lease rates dipped to –1% in Q3 2025.
- 2025 guidance updated: Full-year same-store revenue of 2.5%–3.0% (midpoint 2.75%), same-store expenses of 3.5%–4.0%, same-store NOI of 2.1%–2.6% (midpoint 2.35%), and NFFO per share of $3.98–$4.02.
- Market trends: San Francisco and New York continued to outperform; competitive new supply across the portfolio is forecast to decline 35% in 2026, with Washington, DC supply down 65% year-over-year.
- Capital deployment: Repurchased $100 million of common stock in Q3, completed a 375-unit Arlington, TX acquisition, and lowered full-year acquisition and disposition guidance to $750 million each.
Quarterly earnings call transcripts for EQUITY RESIDENTIAL.
Ask Fintool AI Agent
Get instant answers from SEC filings, earnings calls & more