EQUITY RESIDENTIAL (EQR)·Q4 2025 Earnings Summary
Equity Residential FFO Misses as Stock Drops 2.3%, But Guidance Points to Supply-Driven Recovery
February 6, 2026 · by Fintool AI Agent
Equity Residential (NYSE: EQR) reported Q4 2025 results that delivered a mixed picture: revenue edged past consensus while FFO/share came in light. The stock dropped 2.3% on the day as investors digested weaker-than-expected quarterly FFO and a guidance range that implies modest growth in 2026. However, management struck an optimistic tone, citing "dramatically declining" new apartment supply and strong positioning in the San Francisco and New York markets.
Did Equity Residential Beat Earnings?
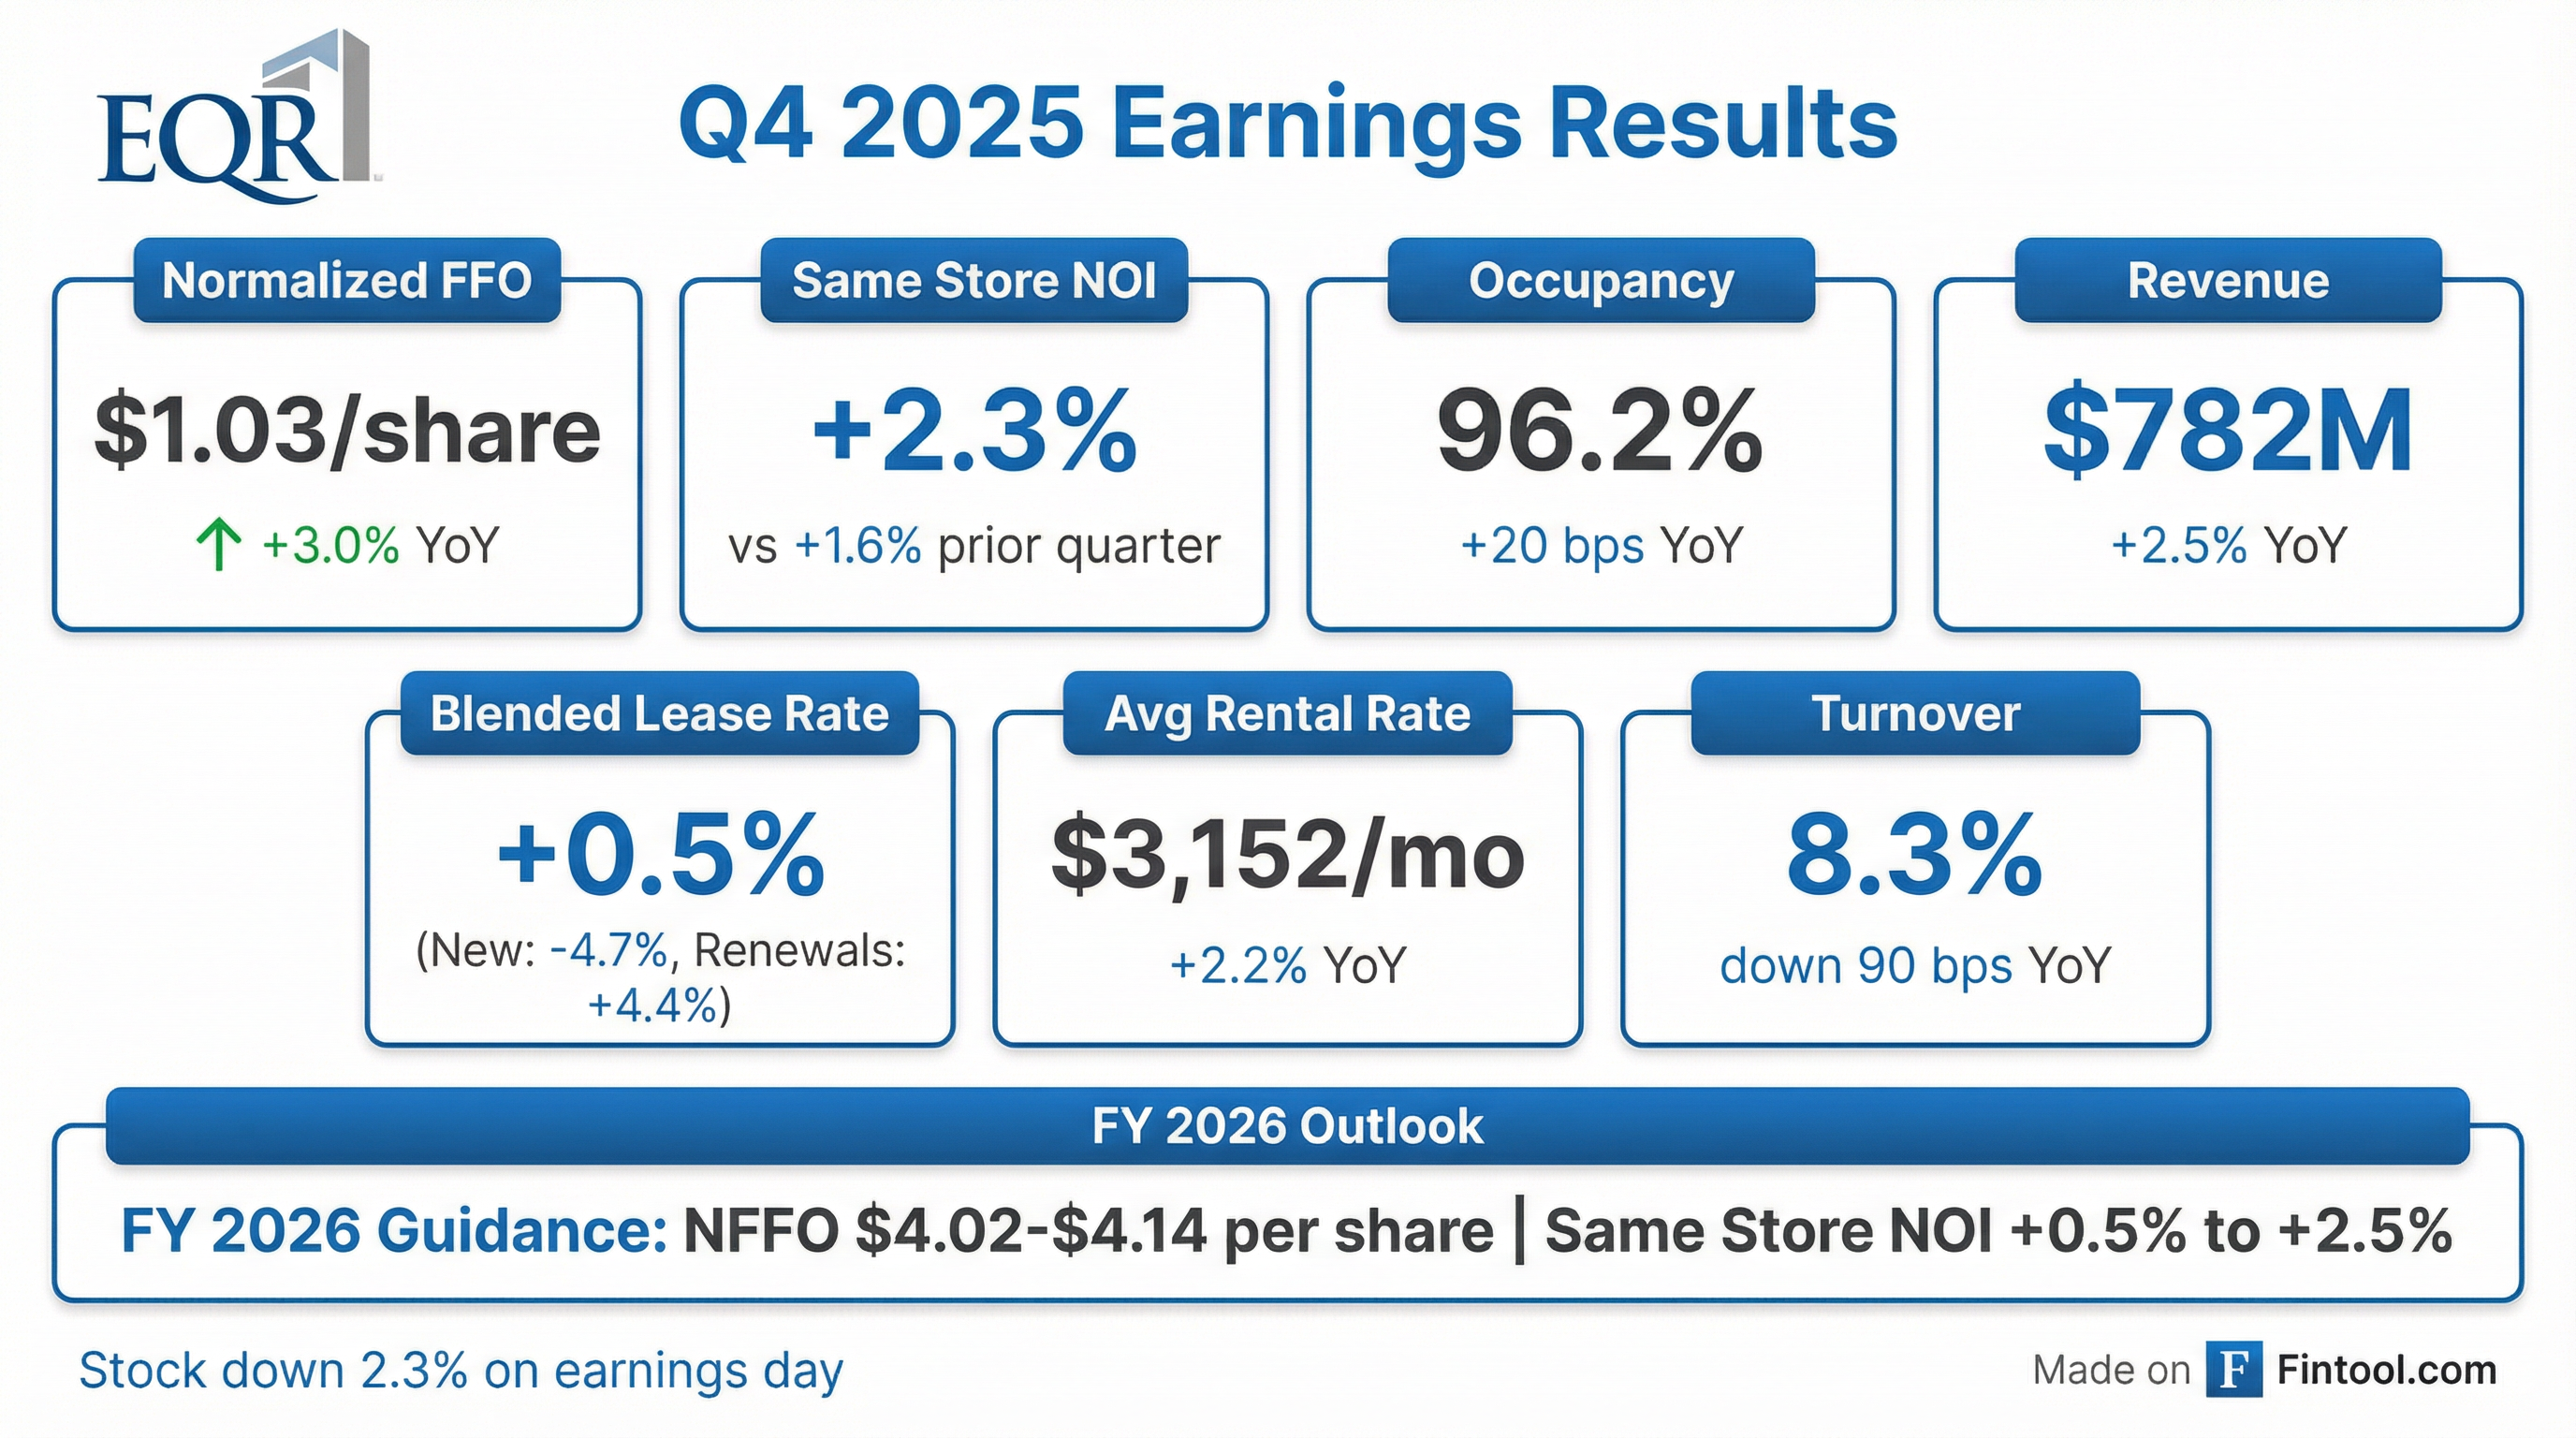
The quarter produced mixed signals depending on which metric you emphasize:
*Values retrieved from S&P Global
The EPS decline was driven primarily by lower property sale gains in Q4 2025 versus Q4 2024. On an operating basis, Normalized FFO of $1.03 grew 3.0% year-over-year, powered by same store NOI gains of +2.3%.
Full Year 2025 delivered solid growth across key metrics:
How Did the Stock React?
EQR shares dropped 2.3% on the day, falling from $63.08 to $61.77. The decline reflects investor disappointment with the FFO miss and potentially cautious near-term outlook.
Year-to-date, EQR has traded in a range of $58.38 to $75.86, with the current price sitting near the 50-day moving average of $61.61. The stock remains 18.6% below its 52-week high.
What Did Management Guide?
Management provided 2026 guidance that implies continued but modest growth:
The sharp EPS decline is almost entirely driven by lower expected property sale gains and depreciation changes—not operating weakness.
2026 Same Store Revenue Drivers (at midpoint):
- Leasing rates: +1.7% (driven by 0.6% embedded growth + ~1.1% contribution from blended rate growth)
- Vacancy gain: +0.1%
- Bad debt improvement: +0.3%
- Other income growth: +0.1%
2026 Same Store Expense Drivers (at midpoint):
- Real estate taxes: +0.9%
- Payroll: +0.5%
- Utilities: +1.0% (largest contributor, though slower than 2025)
- Repairs & maintenance: +0.2%
- Connectivity expense adds ~$6.8M incremental expense (offset by revenue)
Key guidance assumptions:
- No operating property acquisitions or dispositions included
- ~$200M in excess 2025 disposition proceeds to be reinvested in share repurchases in H1 2026
- Interest expense of $321M-$327M
- Capital expenditures for same store properties: $310M ($125M NOI-enhancing, $185M recurring)
- Weighted average shares: 384.2M (down from 390.4M)
- Same Store expense growth of 3%-4%, with midpoint 20 bps lower than 2025
- Blended rate growth expected between 1.5% and 3% for the year
2026 Debt Maturities:
- November 2026: $500M at 2.85% coupon
- August 2026: $92M stub payment at 7.57% coupon
- Both expected to be refinanced with unsecured debt at or near maturity
What Changed From Last Quarter?
Positive Developments:
- Record retention: 2025 delivered the highest full-year resident retention in company history
- Occupancy improvement: Physical occupancy rose to 96.2% vs 96.0% in Q4 2024
- San Francisco recovery: Same store NOI jumped +7.0% YoY, the strongest among all markets
- New York strength: Same store NOI grew +6.3% YoY with 97.6% occupancy
Challenges:
- Expansion market weakness: Denver same store NOI fell -7.1% YoY; Other Expansion Markets down -1.4%
- New lease pricing pressure: Blended rate of just +0.5% in Q4 2025 vs +1.0% in Q4 2024
- Expense growth outpacing revenue: Same store expenses +3.7% vs revenue +2.6% for full year
Portfolio Positioning (85,190 total units):
- ~30% of NOI concentrated in high-growth/low-supply markets of New York (14% NOI) and San Francisco (16% NOI)
- Average resident household income of $177,000, providing resilience against economic shocks
- Lower exposure to oversupplied Sunbelt markets in the near-term
Same Store Performance by Market (Q4 2025 vs Q4 2024):
What Did Management Say?
CEO Mark Parrell struck an optimistic tone on the call despite near-term headwinds:
"With new apartment supply dramatically declining, continued social and cost considerations that favor rental housing and a portfolio that is well positioned with high current occupancy and significant exposure to the strong San Francisco and New York markets, we expect operating momentum to improve as we move through the year."
On capital allocation, Parrell highlighted the aggressive share buyback program:
"We repurchased approximately $300 million of our stock during the year using sale proceeds from properties with slower forward growth prospects. At this price, and with the positive near term prospects we see for our business, we feel that our stock is a bargain."
On buyback economics and the assets being sold:
"These are typically assets that are older... and typically non-core, which your implication of your question really shows also that they tend to have higher CapEx loads. We look at these as being lower growth areas... where AFFO is burdened with capital that we find isn't ROI-enhancing."
On Los Angeles challenges:
"The issues in L.A. are quality of life considerations, especially in central Los Angeles and the West Side. They also include just a difficult business climate on the political side. And then just challenging job growth... Right now in Los Angeles, I just think this is just the rotation of capital. People run towards San Francisco now."
Q&A Highlights
On Renewals & Consumer Health:
- Renewal quotes going out at ~6%, achieving ~4.5% with high confidence
- No signs of economic hardship from resident base—no acceleration in lease breaks due to layoffs
- Rent-to-income ratio remains healthy for new move-ins
- Only 7.4% of residents gave buying a home as reason for move-out in 2025—lowest in company history
On Market Dynamics:
- D.C.: "A tale of two markets in 2025"—strength in H1 eroded by federal job cuts, National Guard deployment, and government shutdown. However, 2026 supply drops from 12,000 to 4,000 units.
- Los Angeles: Management admits "continuing anxiety"—lacks both economic drivers and quality of life drivers. Added litigation cost adjustments to California per-unit underwriting.
- Atlanta: "We have seen acceleration of rents since November, which continues to support our view that we are pulling away from the bottom here."
On Loss-to-Lease:
- Portfolio starting 2026 with 1.2% gain-to-lease
- Expected to flip to loss-to-lease by end of Q1 as spring leasing season kicks in
- San Francisco and New York have opportunity for rents to continue rising through peak season
On AI & Tech Employment:
- Management reminded investors that EQR's customer base is "mostly not the first home for just out-of-college residents"
- Demographic skews toward 24-35 year-olds in second/third jobs—less directly impacted by new grad hiring freezes
- San Francisco exposure to AI development is a positive, but broader productivity/displacement concerns create uncertainty
On Development Restart:
- No starts in 2025; expects some starts in 2026
- Acquired land parcels in Q4 for two Atlanta projects starting in Q1 2026
- EQR acting as LP with local developers ("sharpshooters")—less overhead, better terms given reduced LP capital availability
On Blend Rate Expectations:
- Expecting blends to mirror typical seasonal pattern: Q1 > Q4 2025, Q2 builds further, Q3 decelerates, Q4 decelerates further
- Second half of 2026 not expected to decelerate "anywhere near like we saw in the second half of 2025"
- San Francisco and New York will deliver best blends; expansion markets lowest
- 70% of concession use still tied to expansion markets
Technology & Innovation Update
Management highlighted significant progress on operational efficiency initiatives:
"Creating the foundation of what will be the most efficient and scalable operating platform in our business is very exciting."
Capital Allocation Update
EQR was a net seller in 2025, rotating out of slower-growth assets to fund buybacks:
The Board reauthorized a 13 million share repurchase program in December 2025.
Balance Sheet Highlights:
- Total debt: $8.18B with 6.7 year weighted average maturity
- Net debt to Normalized EBITDAre: 4.3x
- 90.3% unencumbered NOI
- New $2.5B unsecured credit facility maturing December 2030
- S&P positive outlook received in November 2025, reflecting balance sheet strength
Key Risks Flagged
Management acknowledged several headwinds in the filing:
- Near-term supply pressure: Despite declining new construction starts, existing pipeline deliveries continue to pressure expansion markets
- Expense inflation: Utilities (+8.3% YoY) and repairs/maintenance (+5.3%) outpacing revenue growth
- Expansion market underperformance: Denver and other expansion markets delivering negative NOI growth
- Interest rate uncertainty: Floating rate debt exposure of 9.5% of total
2026 FFO Bridge
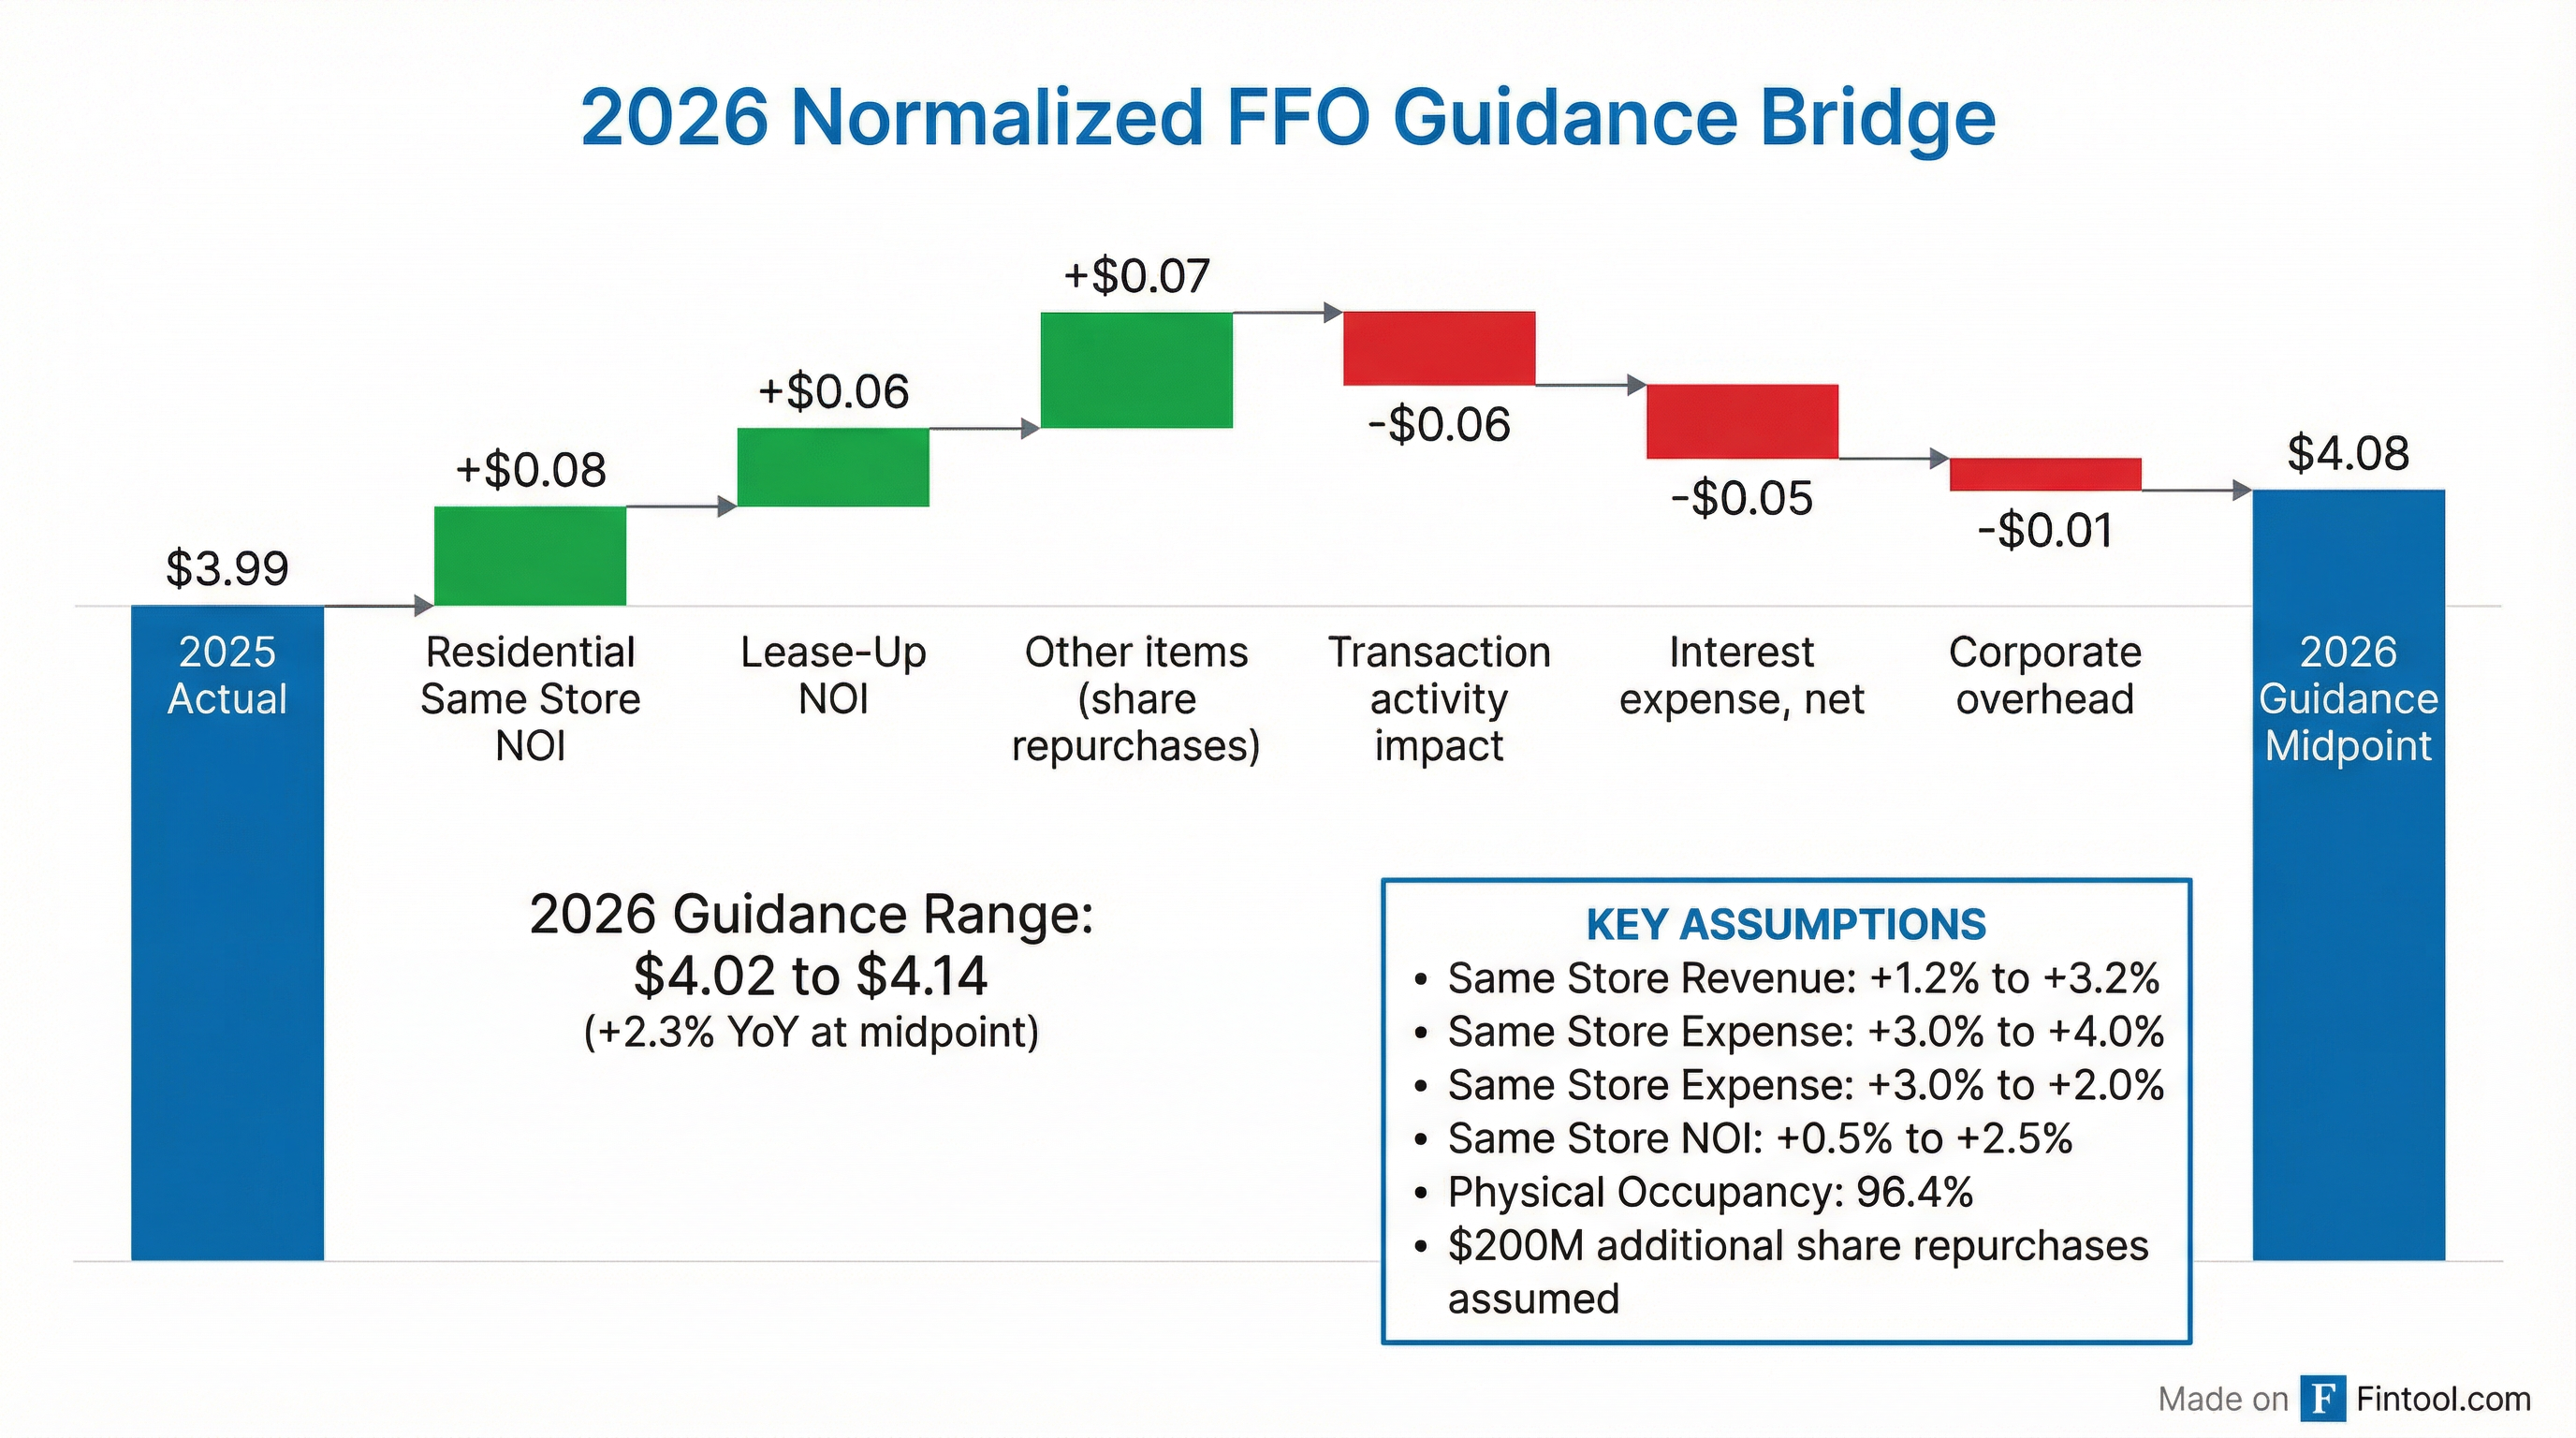
CFO Bret McLeod provided a detailed bridge from 2025 Normalized FFO of $3.99 to 2026 guidance midpoint of $4.08:
Transaction activity is effectively neutral to FFO/share as the share buyback benefits offset lost NOI from dispositions.
Supply Relief: 35% Decline in Multifamily Deliveries
A key driver of management's 2H26 optimism is the 35% decline in competitive new supply, particularly in EQR's expansion markets:
The supply picture supports management's expectation of a more typical leasing season in 2026 with better year-over-year blended rate growth in the second half.
Forward Catalysts
- Q1 2026 earnings: Guided Normalized FFO of $0.94-$0.98
- Supply inflection: 35% decline in deliveries should ease competition in H2 2026
- Share repurchases: ~$200M additional buybacks expected in H1 2026
- San Francisco momentum: Strongest coastal market showing continued recovery