EQT (EQT)·Q4 2025 Earnings Summary
EQT Crushes Q4: Adjusted EPS Beats by 147% as FCF Hits $2.5B for 2025
February 17, 2026 · by Fintool AI Agent
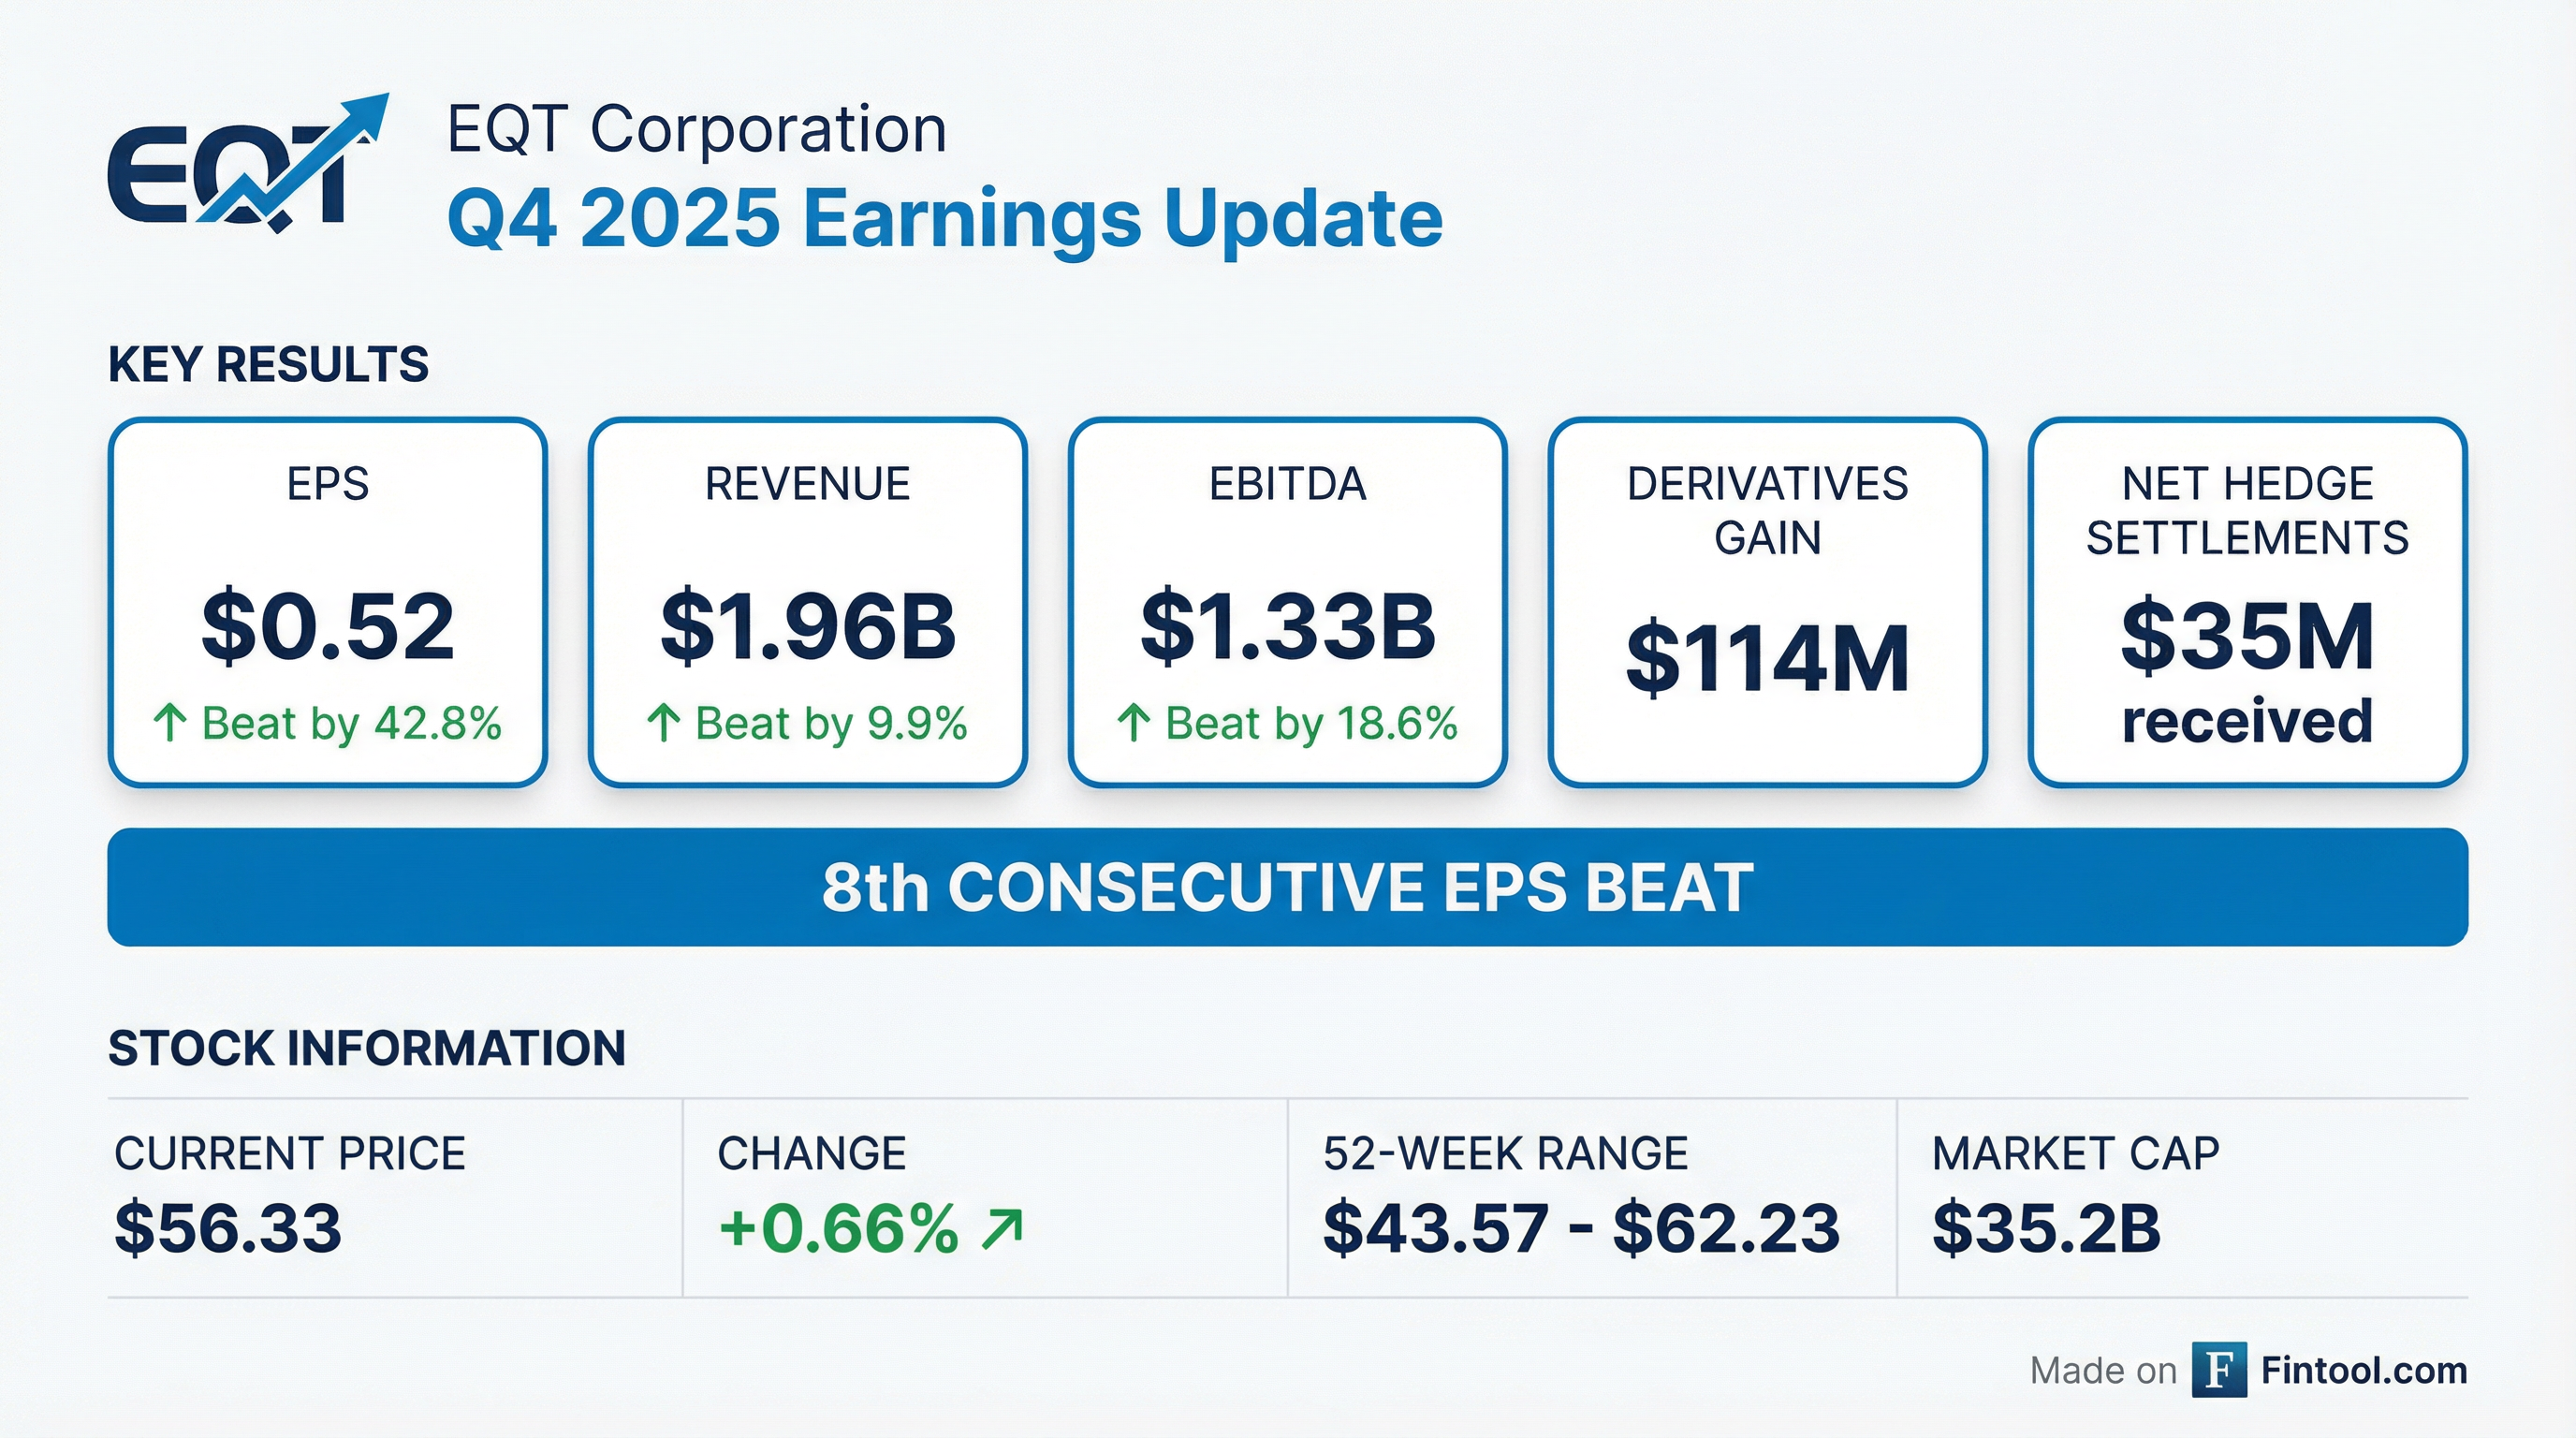
EQT Corporation (NYSE: EQT), America's largest natural gas producer, delivered a blowout Q4 2025 with Adjusted EPS of $0.90 crushing the $0.36 consensus by 147%. The company generated $2.5 billion of free cash flow for full year 2025 while reducing net debt by $1.4 billion to $7.7 billion. CEO Toby Rice highlighted "outstanding performance across the board" as EQT guides to approximately $3.5 billion of free cash flow in 2026 at current strip pricing.
Did EQT Beat Earnings?
Yes — and it wasn't close. EQT delivered its 9th consecutive quarter of EPS outperformance with the largest beat in recent history:
*Consensus values retrieved from S&P Global
The massive beat was driven by:
- Strong well performance — production above high-end of guidance
- Tighter differentials — $0.11 better than mid-point guidance from marketing optimization
- Lower costs — CapEx 4% below guidance, operating costs toward low end
- Derivatives gains — $114M gain on derivatives with $35M net cash settlements
Beat/Miss History: A Pattern of Outperformance
*Values retrieved from S&P Global
Key insight: EQT has beaten EBITDA estimates in all 8 quarters with an average beat of +18%, demonstrating consistent operational excellence regardless of commodity price environment.
What Were the Full Year 2025 Results?
EQT delivered exceptional full year 2025 performance:
The dramatic improvement in earnings and free cash flow reflects higher realized prices, increased production from the Equitrans Midstream integration, and continued cost discipline.
What Did Management Guide for 2026?
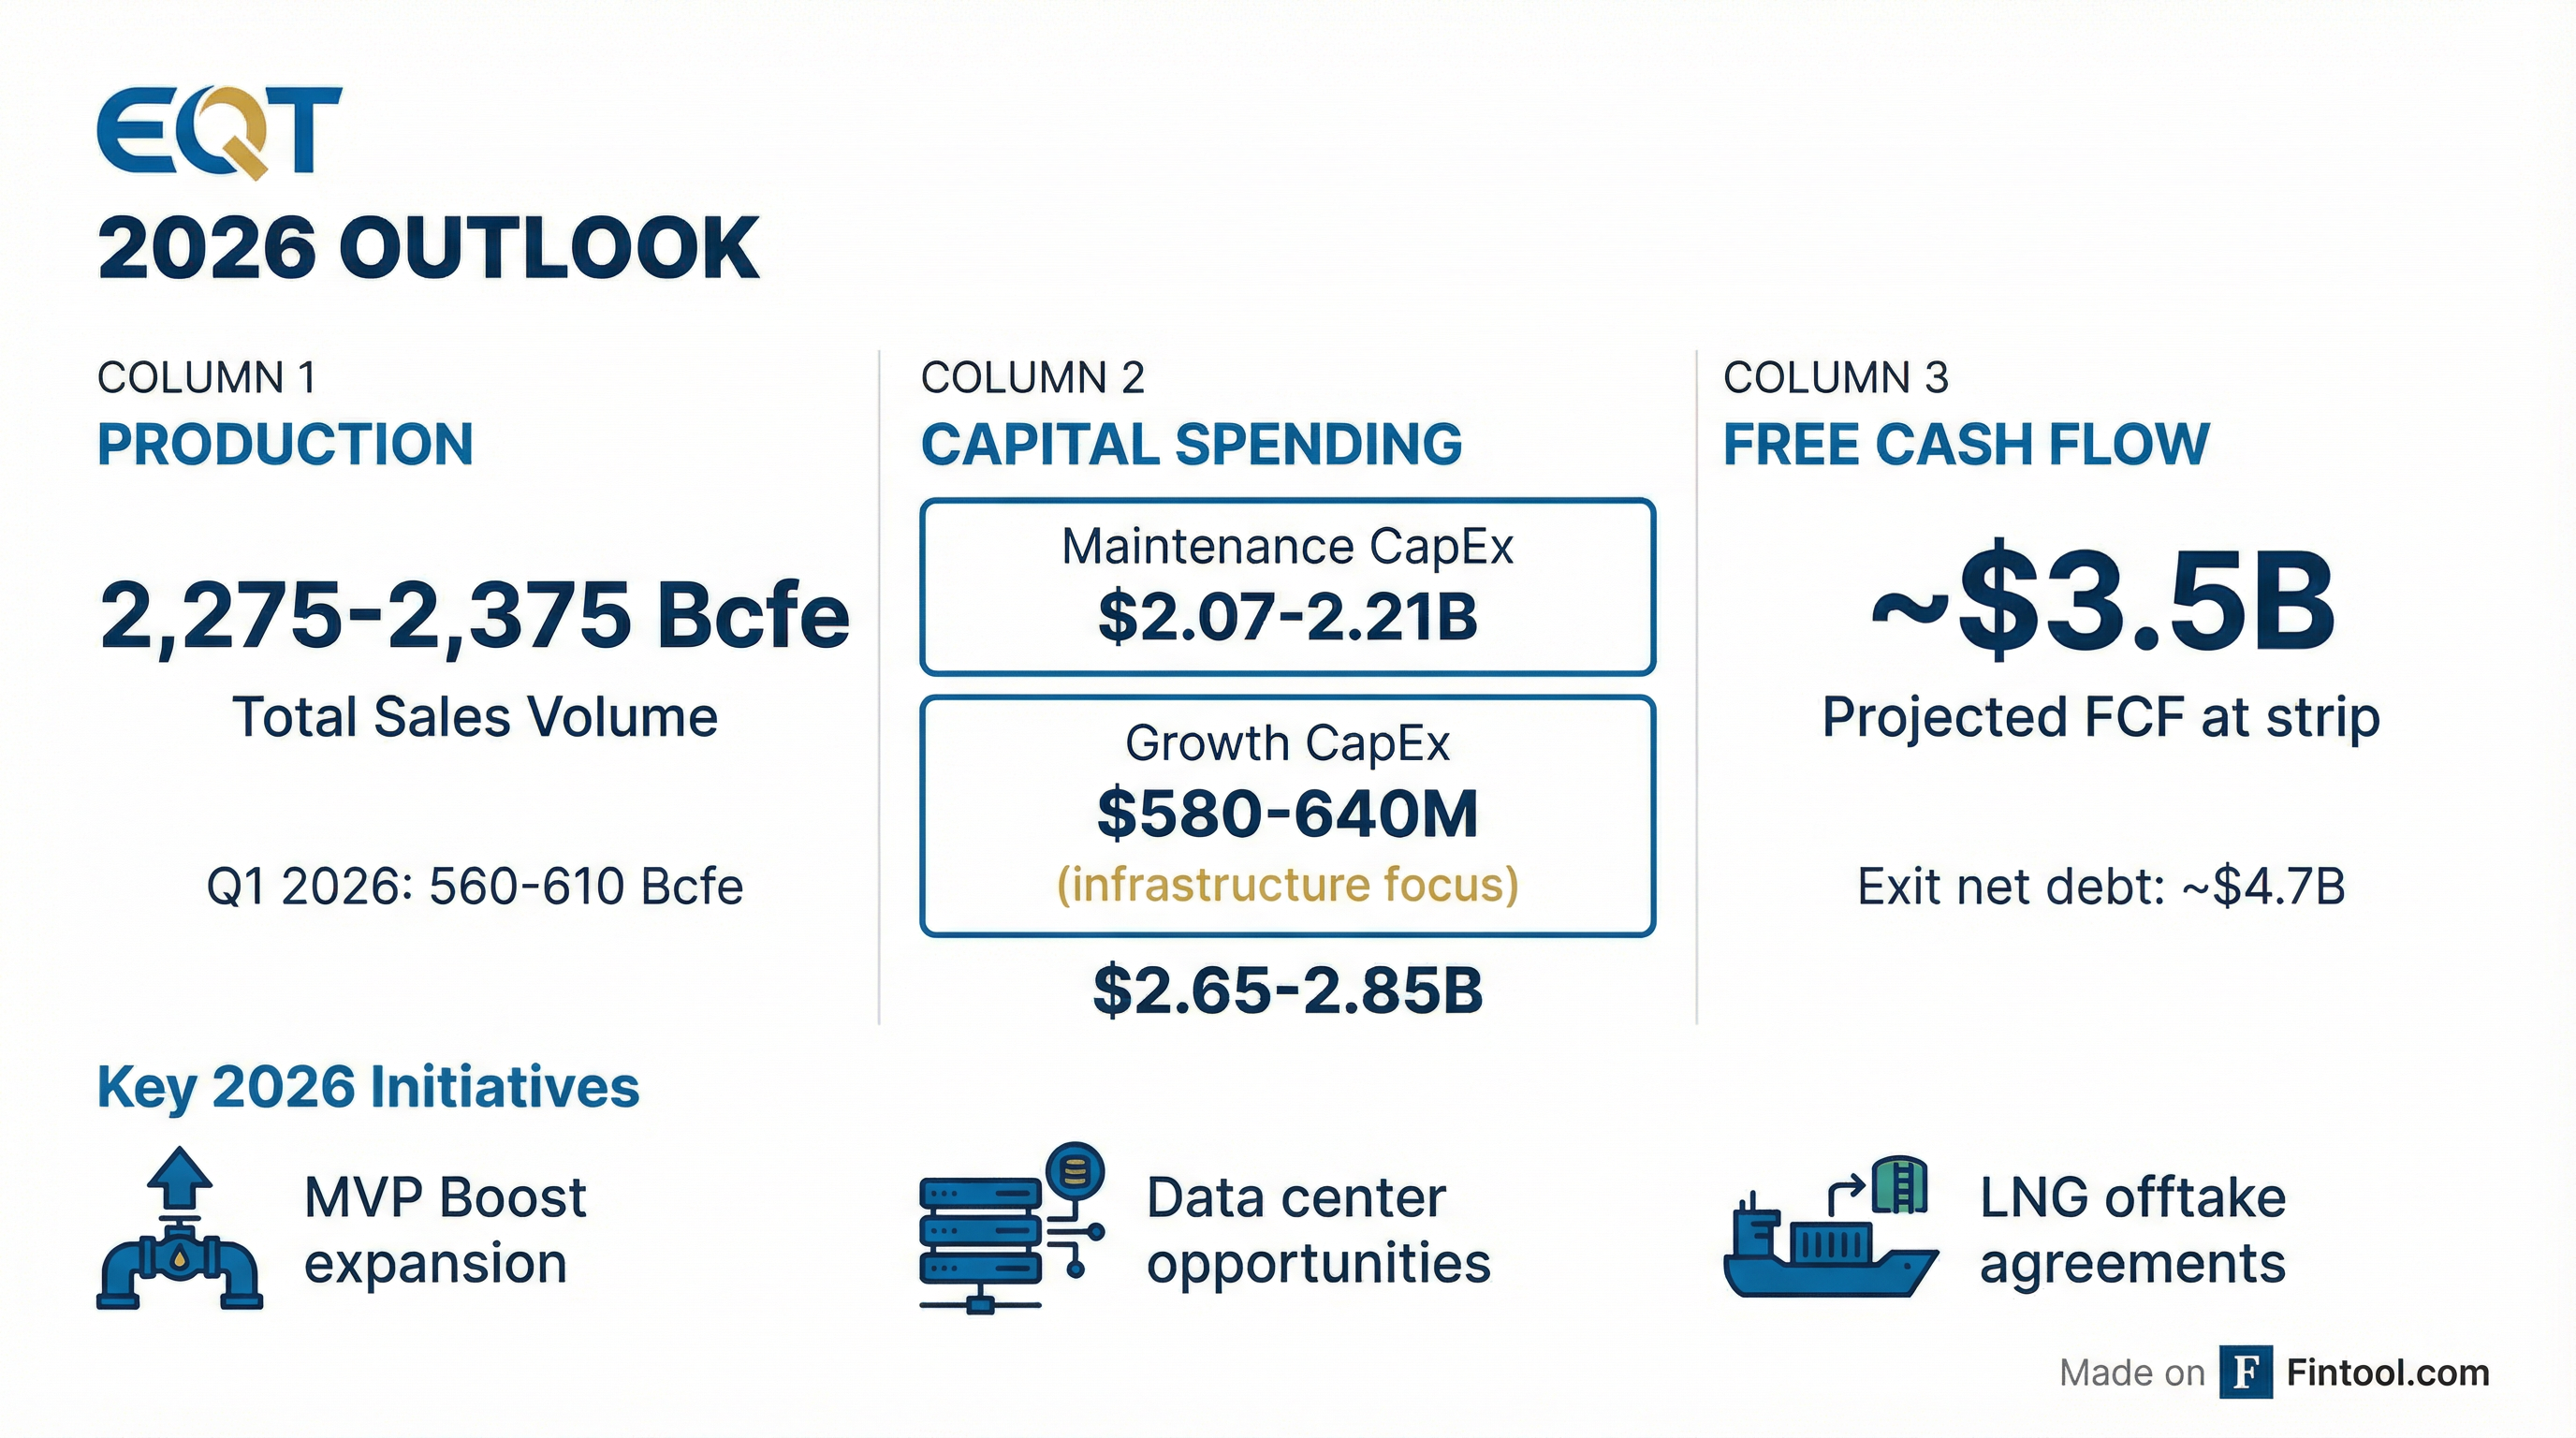
EQT provided comprehensive 2026 guidance:
Key guidance elements:
-
Growth CapEx Allocation: EQT elected to invest $580-640M of post-dividend free cash flow into high-return infrastructure projects including compression, water infrastructure, the Clarington Connector pipeline, and strategic leasing
-
Per Unit Operating Costs: Guidance of $1.07-$1.21/Mcfe reflects continued cost discipline
-
Hedging Strategy: Increased 2026 hedge percentage from 7% to 25% with collars at $3.94 floor / $5.70 ceiling
How Did the Stock React?
EQT shares fell modestly on earnings day despite the massive beat:
The muted reaction despite the blowout quarter likely reflects: (1) some expectation of strong results after Winter Storm Fern dynamics, and (2) natural gas price volatility concerns offsetting operational strength.
What About Winter Storm Fern?
A key highlight of the quarter was EQT's operational resilience during Winter Storm Fern:
"Winter Storm Fern created extremely challenging weather conditions over the past several weeks, but seamless coordination between our midstream, upstream and gas marketing teams resulted in negligible impact to EQT's production. The teams' effort helped keep millions of American homes heated, while allowing us to capture attractive prices during periods of elevated demand." — CEO Toby Rice
Key stats:
- Production uptime was ~2x better than Appalachia peers
- Zero TRIR and DARTS during the storm — achieved without sacrificing safety
- Captured strong in-basin pricing (M2 daily pricing spiked above $45/MMBtu) during elevated demand
- Demonstrated value of integrated midstream/upstream operations
- Gas marketing optimization drove >$200 million of FCF uplift in 2025
What's the Balance Sheet Situation?
EQT made significant progress on deleveraging:
Debt trajectory:
- Q1 2026 net debt projected to be sub-$6 billion
- 2026 exit net debt projected at ~$4.7 billion at strip pricing
- Management's maximum debt target remains $5 billion
What Strategic Moves Were Announced?
MVP Ownership Increase
EQT exercised its option to acquire additional MVP Mainline and MVP Boost interests:
- Ownership increase: 49% → 53% in both MVP A (Mainline) and MVP C (Boost)
- Purchase price: ~$115 million attributable to EQT
- Valuation: 9x adjusted EBITDA, 12% IRR
- Closing: Expected H1 2026
The acquired MVP A interest will be held through the Midstream JV with Blackstone (51%/49% economic split).
MVP Winter Storm Performance: During Winter Storm Fern, MVP set record flows at 6% above nameplate capacity, backstopping 14 GW of power generation — enough energy to heat over 10 million homes.
Clarington Connector Pipeline
EQT is advancing a strategic infrastructure project to expand regional access:
- Capacity: 400 MMcf/d (upsized 100 MMcf/d from prior plan)
- Capital: ~$100 million total spend
- In-Service: Expected year-end 2026
- Returns: 15-20% projected free cash flow yield
- Strategic Value: Connects EQT's SW Appalachia inventory to growing Ohio and Midwest data center demand
Water Infrastructure Program
EQT has built the largest integrated water network in Appalachia:
Proved Reserves Growth
EQT's proved reserves increased significantly:
91% of proved developed reserves and 93% of total proved reserves are located in the Marcellus Shale.
What Did Management Say?
CEO Toby Rice on Q4 Performance:
"EQT delivered outstanding performance across the board in 2025, exceeding production forecasts, achieving record-low operating costs and coming in below budget on capital spending. This resulted in 2025 free cash flow generation significantly above consensus and internal estimates, underscoring how our outperformance is driving tangible shareholder value."
On Operational Excellence:
The company broke multiple EQT records in Q4 2025:
- Fastest quarterly completions pace
- 24-hour drilling record: 13,082 feet — a new EQT and basin record
- 48-hour drilling records: 19,643 feet in late October
- 2025 average well cost per foot was 13% lower YoY and 6% below internal expectations
- Completion efficiency reached ~1,350 completed feet per day in Q4 (vs. 750 in 2023)
Widening Well Productivity Gap
EQT's 2025 wells are significantly outperforming Appalachian peers:
This productivity gap is widening year-over-year, driven by EQT's integrated midstream assets, compression investments, and differentiated reservoir management.
What Are Analysts Expecting for 2026?
*Values retrieved from S&P Global
Implied trajectory: Analysts expect strong Q1 and Q2 2026 (winter heating season and spring demand) followed by typical summer/fall seasonality. The full-year EPS consensus of ~$4.00 would represent a modest increase from the $3.05 adjusted EPS delivered in 2025.
Financial Snapshot: Q4 2025 vs. Q4 2024
Per Unit Cost Trends
The decrease in full-year gathering expense reflects ownership of gathering assets from the Equitrans Midstream merger, while O&M increased from operating those assets.
The Bottom Line
EQT delivered a blowout Q4 2025 with Adjusted EPS of $0.90 crushing the $0.36 consensus by 147%. The company's integrated natural gas platform demonstrated its value during Winter Storm Fern, achieving 2x better uptime than peers while capturing elevated pricing. Full year 2025 free cash flow of $2.5 billion enabled significant debt reduction, with management guiding to ~$3.5 billion FCF in 2026 at strip pricing.
Key catalysts ahead:
- Q4 2025 earnings call (February 18, 2026 at 10:00 AM ET)
- MVP Boost project completion
- Data center and LNG contract announcements
- Progress toward $4.7B net debt target by year-end 2026
Why it matters: EQT is emerging as the dominant low-cost natural gas producer in North America, with unique exposure to AI/data center power demand, LNG export growth, and domestic electricity generation — all while maintaining the strongest balance sheet and lowest cost structure in Appalachia.
What's the Data Center Demand Outlook?
EQT's investor presentation highlighted significant natural gas demand growth from data centers and AI:
Projected incremental natural gas demand by 2030:
- Base case: ~10 Bcf/d from data centers, coal retirements, EVs, and industrial load
- High case: ~18 Bcf/d under more aggressive data center build-out scenario
EQT's Appalachian position and Clarington Connector project directly address growing Ohio and Midwest data center demand, providing structural exposure to this secular growth driver.
Earnings call scheduled for February 18, 2026 at 10:00 AM ET.