Earnings summaries and quarterly performance for Eaton Corp.
Executive leadership at Eaton Corp.
Board of directors at Eaton Corp.
Andre Schulten
Director
Darryl Wilson
Director
Dorothy Thompson
Director
Gerald Johnson
Director
Gerald Smith
Director
Gregory Page
Non-Executive Chair of the Board
Karenann Terrell
Director
Lori Ryerkerk
Director
Robert Pragada
Director
Sandra Pianalto
Director
Silvio Napoli
Director
Research analysts who have asked questions during Eaton Corp earnings calls.
Andrew Obin
Bank of America
8 questions for ETN
Christopher Snyder
Morgan Stanley
8 questions for ETN
Nigel Coe
Wolfe Research, LLC
8 questions for ETN
Deane Dray
RBC Capital Markets
7 questions for ETN
Jeffrey Sprague
Vertical Research Partners
6 questions for ETN
Scott Davis
Melius Research
6 questions for ETN
Joseph Ritchie
Goldman Sachs
5 questions for ETN
Andrew Kaplowitz
Citigroup
4 questions for ETN
Nicole DeBlase
BofA Securities
4 questions for ETN
Julian Mitchell
Barclays Investment Bank
3 questions for ETN
C. Stephen Tusa
JPMorgan Chase & Co.
2 questions for ETN
Joseph O'Dea
Wells Fargo & Company
2 questions for ETN
Nicole DeBlase
Deutsche Bank
2 questions for ETN
Stephen Tusa
J.P. Morgan
2 questions for ETN
Timothy Thein
Raymond James
2 questions for ETN
Amit Mehrotra
UBS
1 question for ETN
Brett Linzey
Mizuho Securities
1 question for ETN
Charles Albert Dillard
Bernstein
1 question for ETN
David Raso
Evercore ISI
1 question for ETN
Jeffrey Hammond
KeyBanc Capital Markets
1 question for ETN
Joe Ritchie
Goldman Sachs
1 question for ETN
Philip Buller
Berenberg
1 question for ETN
Stephen Volkmann
Jefferies
1 question for ETN
Steve Tusa
JPMorgan Chase & Co.
1 question for ETN
Recent press releases and 8-K filings for ETN.
- Dividend increased 6% to $1.10 per share (from $1.04); annualized to $4.40, implying a ~1.2% yield; payable March 27, record date March 10
- Market capitalization of about $143.6 billion, underscoring Eaton’s scale in industrials
- Revenue of $27.45 billion with a three-year growth rate of 8.4%, gross margin ~37.59%, operating margin ~18.98%
- Business mix: electrical (~70% of revenue) and industrial (~30%); Irish domicile with over half revenue generated in the U.S.
- Eaton projects a 100 GW U.S. data center build-out by 2028, with 17 GW planned for 2026 (up from ~11 GW in 2025) and a backlog of 165–200 GW through 2030+.
- The company is driving a shift to 800 V DC rack power—estimating a 5 % efficiency gain by eliminating AC–DC conversions—and is piloting medium-voltage solid-state transformers in APAC, targeting mass adoption in 2–3 years.
- Backed by a decade of power-electronics R&D and the acquisition of Resilient Power, Eaton offers end-to-end DC conversion and advanced circuit protection, addressing higher rack densities and safety in DC environments.
- Emphasizing a systems-level approach, Eaton integrates power and thermal solutions—bolstered by Boyd Thermal’s precision cold-plate modeling and manufacturing—to support evolving liquid-cooling needs in high-density servers.
- Eaton forecasts 100 GW US data center build-out by 2028, with 35–40 GW installed, 17 GW planned in 2026 and a 165–200 GW backlog through 2030.
- A shift to 800 V DC from utility to rack can yield a 5 % efficiency gain, unlocking 5 GW on 100 GW infrastructure and driving DC power adoption.
- The company expects mass adoption of medium-voltage solid-state transformers within 2–3 years, building on a decade of power-electronics R&D and current Asia-Pacific pilots.
- Acquisitions of Resilient Power and Boyd Thermal enhance Eaton’s circuit protection and liquid cooling offerings, leveraging aerospace-grade reliability and advanced modelling capabilities.
- Eaton projects a 100 GW US data center build-out by 2028, with 17 GW planned for 2026 and a backlog of 165–200 GW through 2030
- Strong push toward 800 V DC power distribution promises up to 5% efficiency gains by eliminating AC–DC conversions from utility feed to rack
- A decade of investments in power electronics and medium-voltage solid-state transformers has led to current pilots and targets mass adoption in 2–3 years
- Emphasizes an integrated systems approach—combining power conversion, circuit protection, and cooling—bolstered by the acquisition of Boyd Thermal for advanced cold-plate design and simulation capabilities
- Eaton to acquire the Boyd Thermal business of Boyd Corporation under a merger agreement dated November 2, 2025.
- Entered a $8.0 billion senior unsecured delayed-draw term loan facility via a Term Credit Agreement dated February 6, 2026 to finance the acquisition.
- Increased its revolving credit commitments from $3.0 billion to $4.0 billion through a Commitment Increase Agreement to cover the acquisition consideration and related fees.
- Facility is syndicated and jointly arranged by Citibank, Barclays Bank PLC, BofA Securities, JPMorgan Chase and Morgan Stanley Senior Funding.
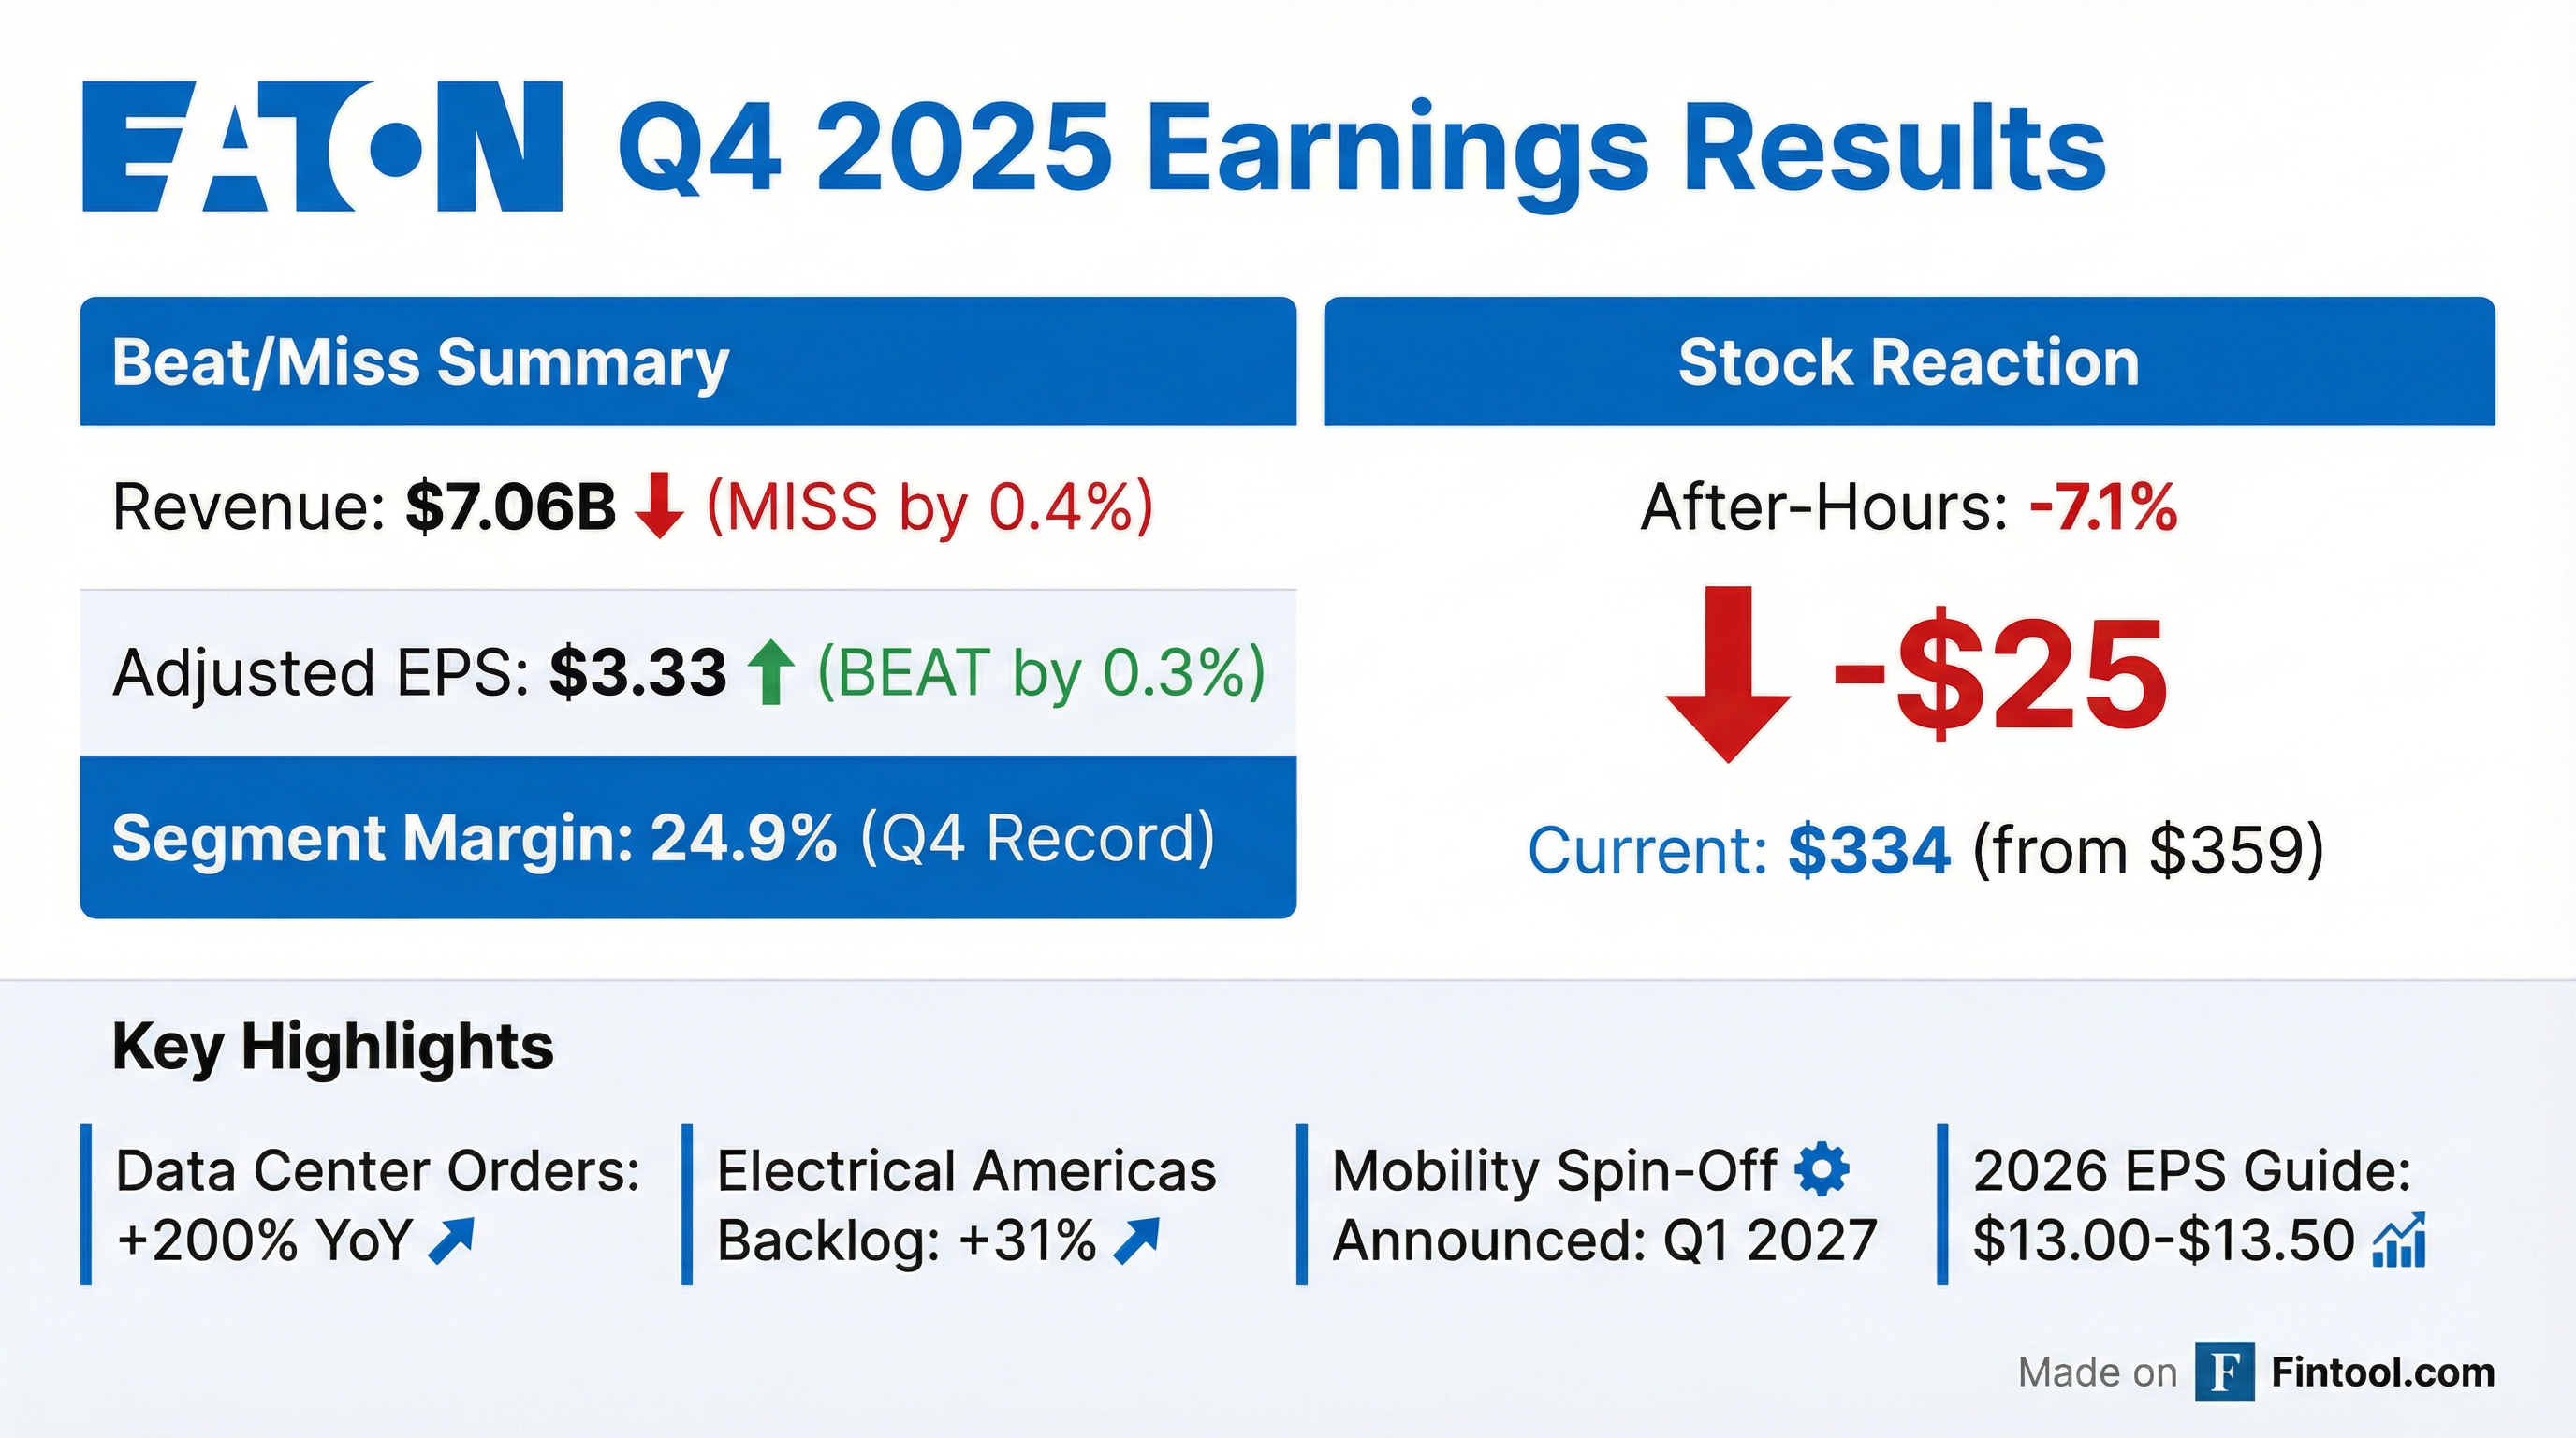
- Record Q4 sales of $7,055 M (up 13% YoY) and adjusted EPS of $3.33 (up 18% YoY) driven by broad-based segment growth.
- Electrical Americas data-center orders surged ~200% and revenue rose ~40% versus Q4 2024; combined book-to-bill was 1.1 and backlog grew 31% in Electrical Americas.
- Completed 2025 acquisitions (Fibrebond, Resilient Power Systems, Ultra PCS) and announced the spin-off of the Mobility business—expected by end of Q1 2027 and tax-free to shareholders—to streamline operations and unlock value.
- 2026 guidance calls for adjusted EPS of $13.00–$13.50, organic growth of 7–9%, and an operating margin of 24.6–25.0%.
- $7.1 billion Q4 revenue; organic growth +9%; adjusted EPS of $3.33, up 18% y/y; segment margin at record 24.9%
- Electrical Americas trailing-12-month orders +16%; backlog +31% to $13.2 billion; data center orders +200% and sales +40% y/y
- 2026 guidance: organic growth 7–9%; segment margins 24.6–25%; adjusted EPS $13–13.50 (+10%); cash flow $3.9–4.3 billion; Q1 organic growth 5–7%, margins 22.2–22.6%
- $13 billion in 2025 strategic investments via Fibrebond, Resilient Power Systems, Ultra PCS and Boyd Thermal; announced spin-off of mobility business (~$3 billion revenue)
- Generated $7.1 billion in Q4 revenue (organic growth of 9%), with adjusted EPS of $3.33 (+18%) and a segment margin of 24.9% (+20 bps).
- Maintained robust demand: Electrical Americas backlog rose 31% yoy to $13.2 billion and total electrical backlog reached $19.6 billion (+29%).
- Provided 2026 guidance for 7%–9% organic revenue growth (Electrical Americas at 10% midpoint), segment margins of 24.6%–25%, adjusted EPS of $13.00–$13.50 (up 10%), and a flat share count.
- Announced $13 billion of 2025 strategic investments, including acquisitions of Fibrebond, Resilient Power Systems, Ultra PCS, Boyd Thermal, and the intent to spin off the mobility business.
- Investing $1.5 billion in Electrical Americas capacity expansion; related ramp-up costs pressured margins in Q4/Q1 but remain on plan for multi-phase project completions and long-term growth.
- Delivered $7.1 B in Q4 revenue with 9% organic growth, $3.33 adjusted EPS (+18%), and a record segment margin of 24.9%.
- Electrical Americas orders up 16% on a trailing-12-month basis with backlog of $13.2 B (+31% y/y) and 29.8% operating margin; Aerospace posted 12% organic sales growth, 24.1% margin, and 16% backlog growth.
- 2026 guidance: 7–9% organic growth, segment margins of 24.6–25.0%, adj. EPS $13.00–13.50, free cash flow $3.9–4.3 B, and no share buybacks.
- Announced $13 B of 2025 investments including Fibrebond, Resilient Power Systems, Ultra PCS, Boyd Thermal, and intent to spin off the Mobility business into a standalone public company.
- Fourth quarter record net sales of $7.1 billion, up 13% year-over-year, and EPS of $2.91, up 19%, with adjusted EPS of $3.33, up 18%.
- Q4 operating cash flow of $2.0 billion (+23% YoY) and free cash flow of $1.6 billion (+17% YoY).
- Orders and backlog growth: twelve-month rolling average order acceleration of +16% in Electrical Americas and +11% in Aerospace; backlog up 29% in Electrical and 16% in Aerospace.
- Corporate actions: agreed to acquire Boyd Thermal for $9.5 billion, acquired Ultra PCS for $1.55 billion, and announced a spin-off of its Mobility business by end of Q1 2027.
- FY2026 guidance: EPS of $11.57–$12.07 (+13% at midpoint) and adjusted EPS of $13.00–$13.50 (+10% at midpoint).
Fintool News
In-depth analysis and coverage of Eaton Corp.


Quarterly earnings call transcripts for Eaton Corp.
Ask Fintool AI Agent
Get instant answers from SEC filings, earnings calls & more