EXPONENT (EXPO)·Q4 2025 Earnings Summary
Exponent Beats Q4 as AI-Driven Demand Fuels Double-Digit Growth
February 5, 2026 · by Fintool AI Agent
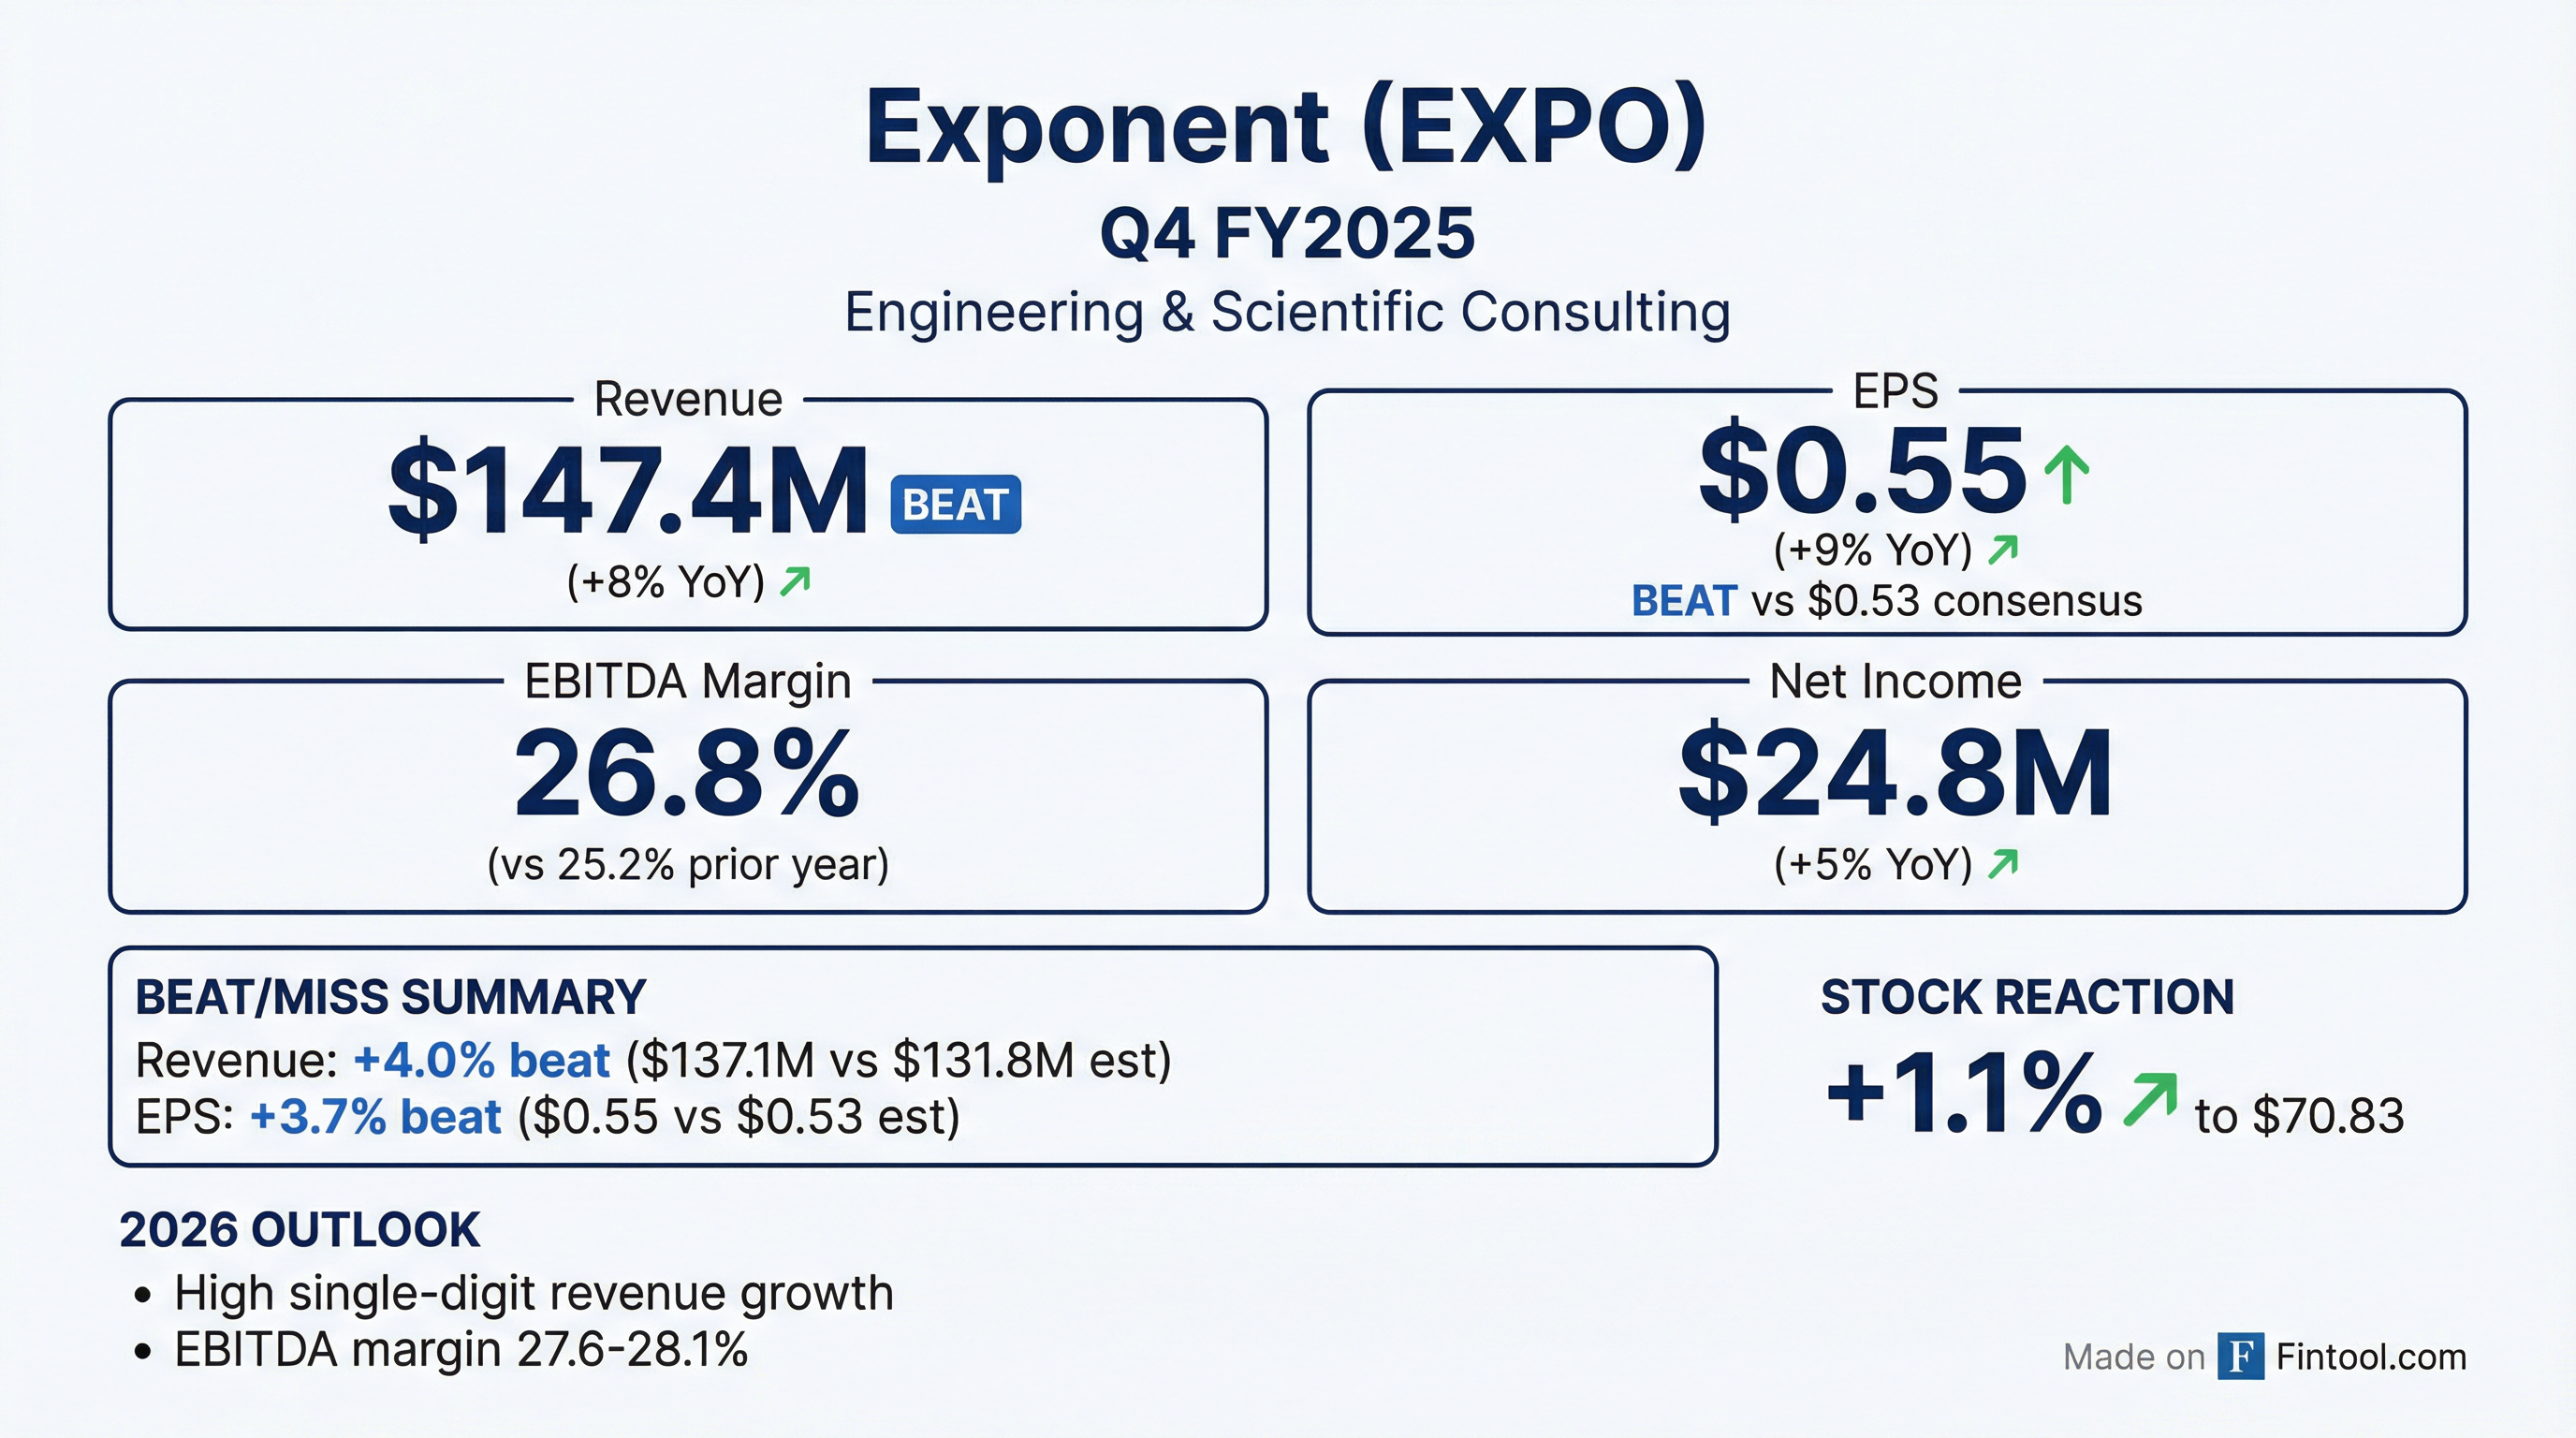
Exponent (NASDAQ: EXPO) delivered a strong finish to fiscal 2025, beating both revenue and EPS estimates on accelerating demand for AI-related engineering services and energy infrastructure consulting. Adjusting for one fewer week versus the prior year, net revenues grew in the low double digits, signaling momentum heading into 2026.
The engineering and scientific consulting firm guided for high single-digit revenue growth and modest margin expansion in FY 2026, citing powerful long-term market drivers including increasing complexity, rapid technological innovation, and rising expectations around safety and reliability.
Did Exponent Beat Earnings?
Yes — Exponent beat on both revenue and EPS:
Total revenues increased 8% year-over-year to $147.4M, while net revenues (before reimbursements) grew 5% to $129.4M. The quarter included one fewer week compared to Q4 2024 — adjusting for this, net revenues would have grown in the low double digits.
Net income rose 5% to $24.8M ($0.49 GAAP EPS), compared to $23.6M ($0.46) in the prior year period. EBITDA expanded to $34.7M with a 26.8% margin, up 160 basis points from 25.2% in Q4 2024.
How Did the Stock React?
Shares of Exponent traded up +1.1% to $70.83 following the earnings release, modestly outperforming the broader market. The stock remains below its 52-week high of $97.57 (-27%) but well above the 52-week low of $63.81 (+11%).
The muted reaction may reflect that the beat was partially expected given the strong demand environment management had signaled in recent quarters. The stock has struggled in recent months despite improving fundamentals.
What Did Management Guide for 2026?
Exponent provided optimistic guidance for FY 2026, projecting continued revenue acceleration and margin improvement:
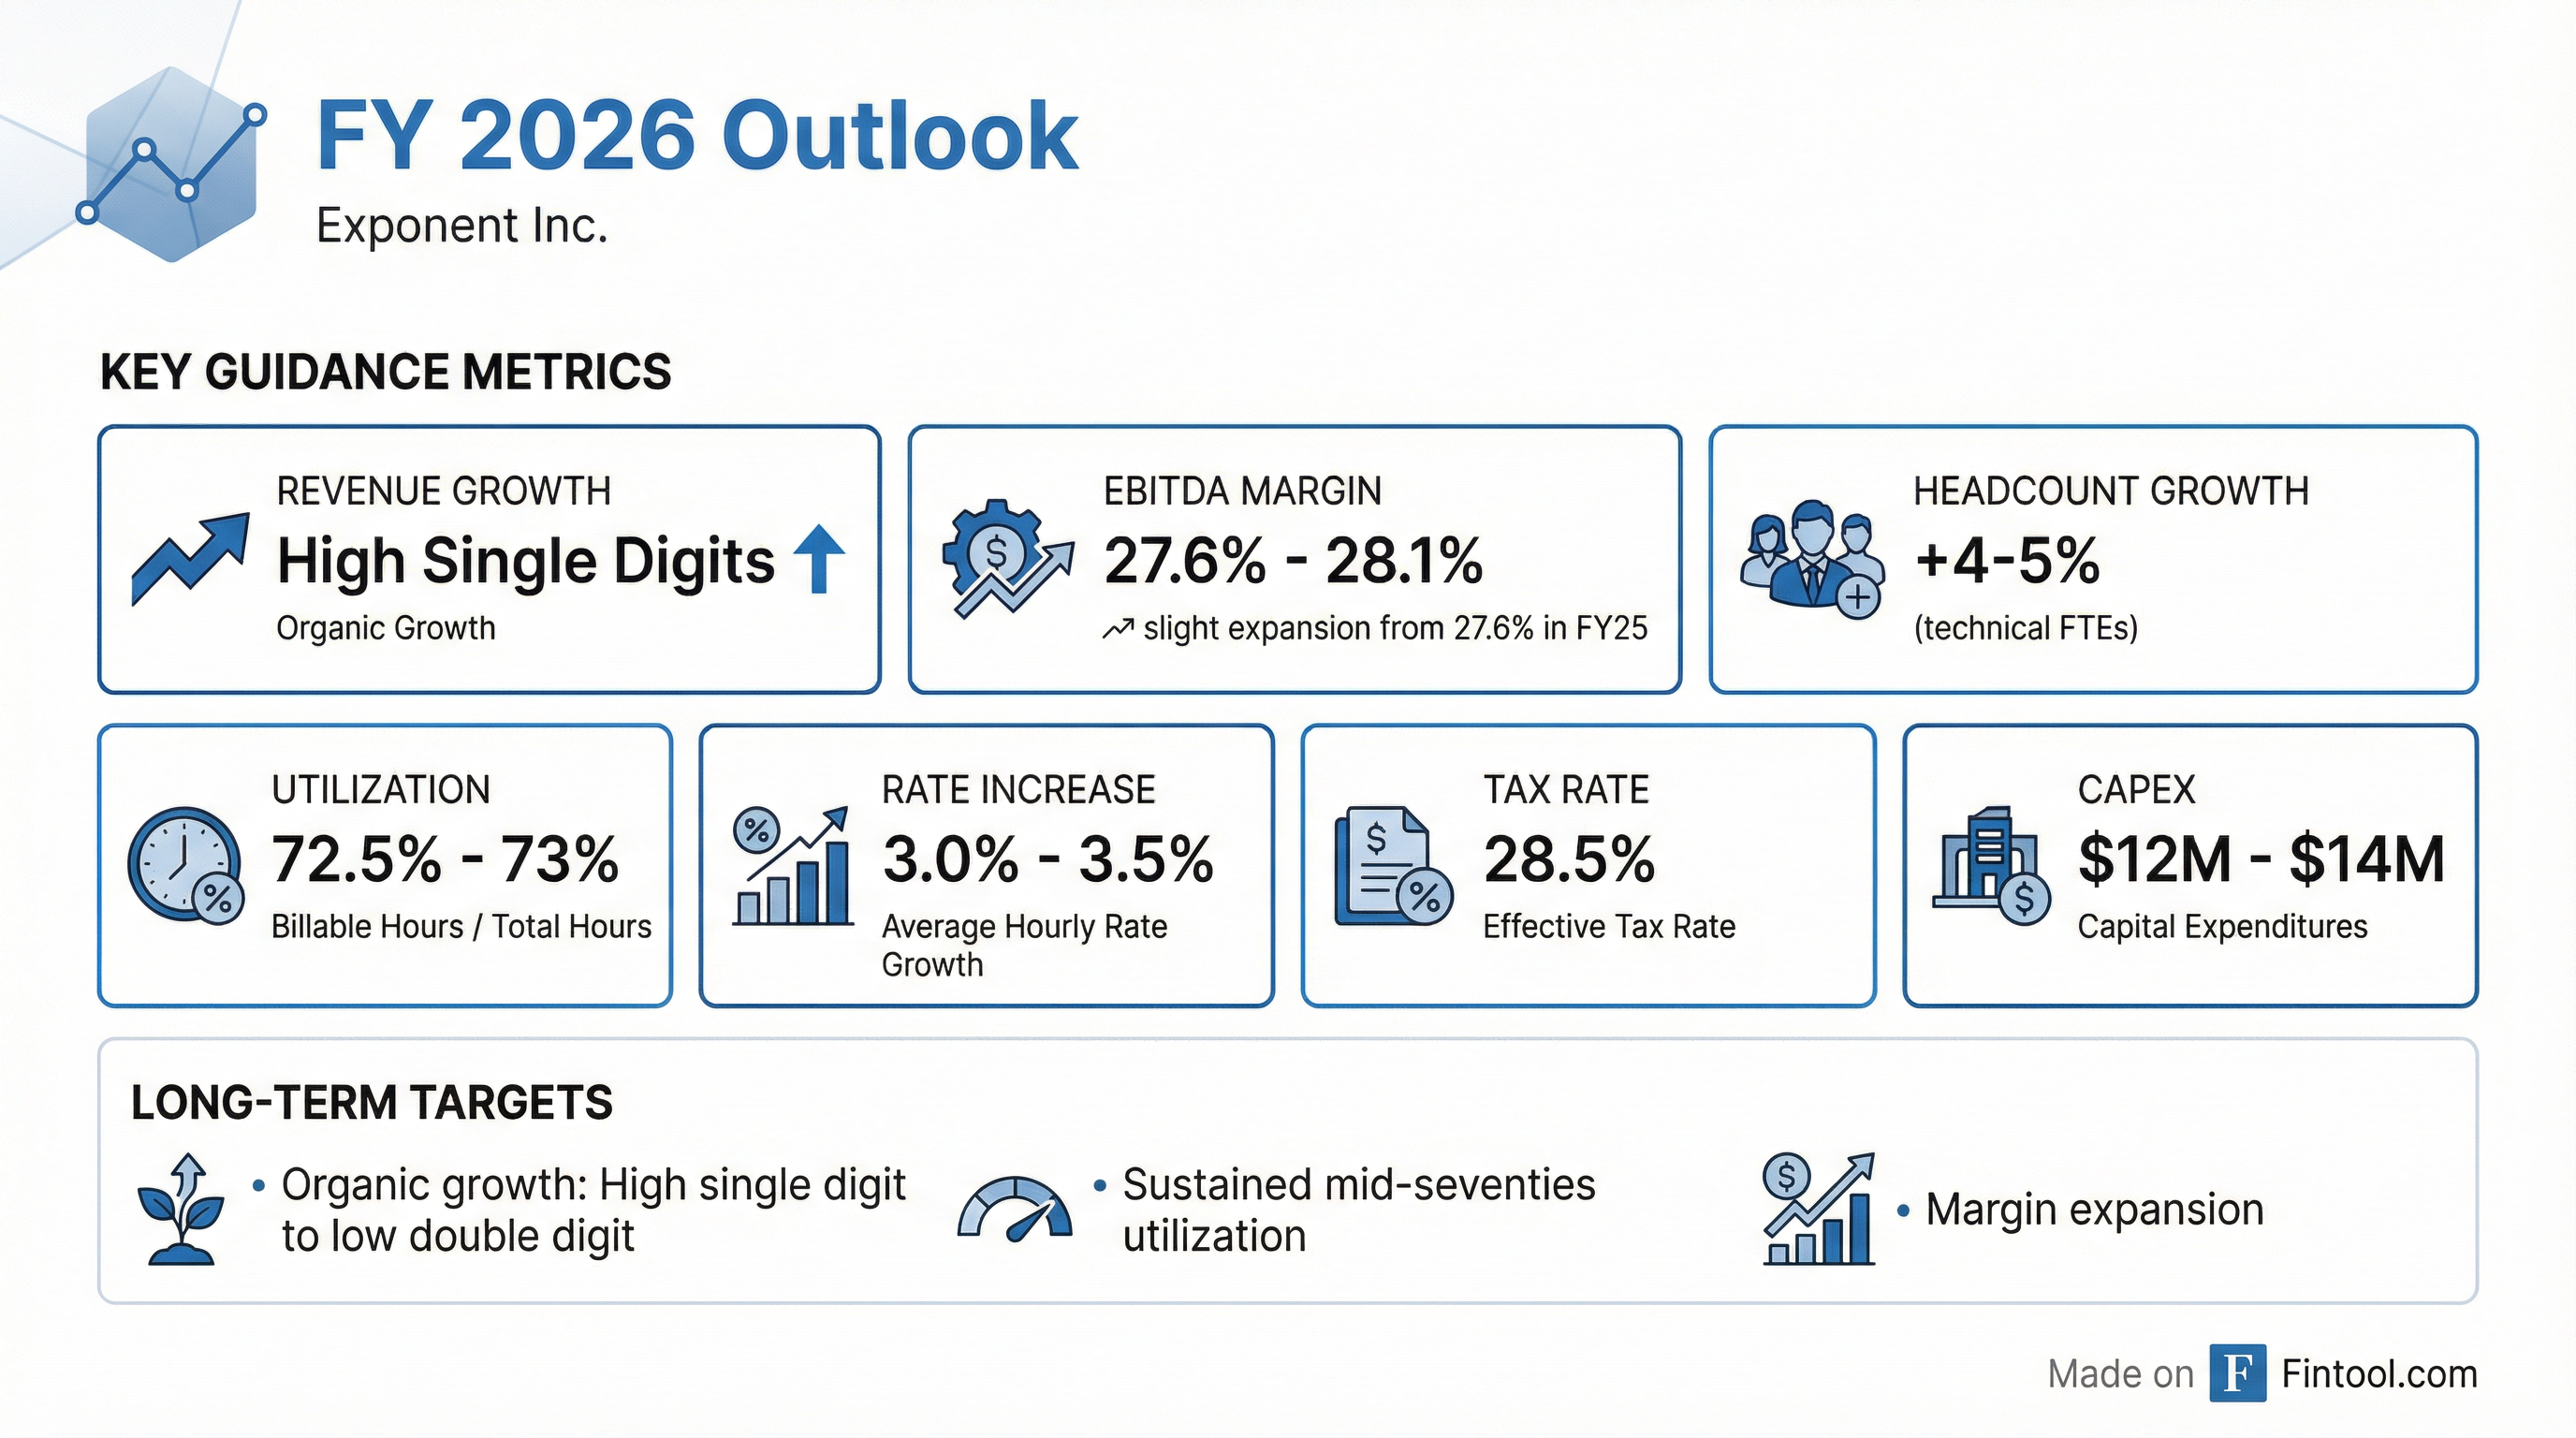
CFO Rich Schlenker noted: "We remain encouraged by the opportunities across our markets and believe we are well positioned to drive improved growth in 2026, while executing against our long-term financial objectives of high single digit to low double-digit organic growth and margin expansion."
For Q1 2026 specifically, Exponent expects:
- Net revenue growth in the high single digits
- EBITDA margin of 27.5% - 28.5%
- Utilization of 75% - 76%
- Technical FTE growth of ~4%
What Changed From Last Quarter?
Several notable shifts emerged compared to Q3 2025:
1. Consumer Electronics Improvement — After years of challenges, user research engagements in consumer electronics showed meaningful recovery. CEO Catherine Corrigan highlighted diversification across AI-enabled devices, health wearables, and novel form factors (glasses, headsets, audio-first devices).
2. Reactive Services Reaccelerating — Failure analysis and dispute-related work drove growth in Q4, spanning energy, construction, transportation, and life sciences. This suggests the reactive side of the business is catching up to proactive growth.
3. Headcount Investment Ramping — Technical FTEs grew 5% YoY to 992 in Q4, with management guiding for 4-5% net adds in 2026 (40-60 new hires). This signals confidence in sustained demand.
4. Rate Realization Normalizing — The realized rate increase was ~5% in Q4 2025 but is expected to moderate to 3-3.5% in 2026 as hiring rates increase.
What's Driving Growth? AI Is a Net Positive
Management provided detailed commentary on AI's impact, with CFO Rich Schlenker estimating that ~15% of revenue is directly or one-step-removed related to AI.
CEO Catherine Corrigan stated definitively: "I think it is a net benefit."
Key AI-driven demand areas:
Corrigan emphasized Exponent's differentiation: "Exponent thrives at the edge, where AI meets the laws of physics, in high-stakes environments where reliability, performance, and security cannot be compromised."
Key Segment Performance
Engineering & Other Scientific (85% of Q4 Revenue)
Net revenues increased 7% YoY in Q4 and 4% for the full year, driven by:
- Proactive services: Risk management for utilities addressing grid resilience and extreme weather; regulatory support for medical device clients; user research for consumer electronics
- Reactive services: Disputes in construction, energy, and transportation; failure analysis in electrification and battery systems
Environmental & Health (15% of Q4 Revenue)
Net revenues declined 5% YoY in Q4 but were flat for the full year. The decline was primarily due to having one fewer week in the quarter.
Management expects PFAS-related work (chemical impact on human health and environment) to increase through 2026.
Capital Allocation and Cash Flow
Exponent maintained its shareholder-friendly capital return strategy:
The company returned $159.3M to shareholders in FY 2025 through dividends and buybacks, exceeding operating cash flow of $131.7M.
Q&A Highlights
On consumer electronics recovery:
"There's diversification in the product base, and there's also diversification across the client base. There are more and more entrants into this arena of trying to deliver artificial intelligence via these novel hardware platforms." — Catherine Corrigan
On 2026 visibility:
"Our people have good visibility out over six to eight weeks, a little bit lighter after that. But the trends of what we're seeing are positive... The demand environment is strong out there." — Rich Schlenker
On AI commoditization risk:
"With our population of PhD entry-level talent, this is different than all of our competitors... That's why we hire PhDs as our entry-level folks, people who know how to solve that unstructured problem, that edge case." — Catherine Corrigan
On headcount plans:
"Our expectation is that the headcount growth would be somewhere in the net 40-50 growth... The areas that we'll see the growth are in that transportation area, the energy area, battery storage, automation, cybersecurity, and actually into that chemicals area around PFAS." — Rich Schlenker
Forward Catalysts to Watch
-
Consumer Electronics Durability — Q1 visibility is strong, but management acknowledged it "gets a little less clear after that." Watch for continued diversification across AI-enabled devices.
-
Energy Sector Expansion — Utility risk management, regulatory work, and dispute services tied to data center buildout and grid infrastructure represent a multi-year opportunity.
-
Hiring Execution — 40-60 net FTE additions planned; execution will determine whether utilization targets are achievable while meeting demand.
-
PFAS Litigation Wave — Chemical impact work expected to accelerate as regulatory scrutiny intensifies.
Full Year 2025 Summary
The full-year margin decline was expected due to costs associated with the managers' meeting and the Phoenix land lease renewal in June 2024.