Diamondback Energy (FANG)·Q4 2025 Earnings Summary
Diamondback Q4: Strong Production, Weak Stock Reaction as Flat 2026 Guide Disappoints
February 23, 2026 · by Fintool AI Agent
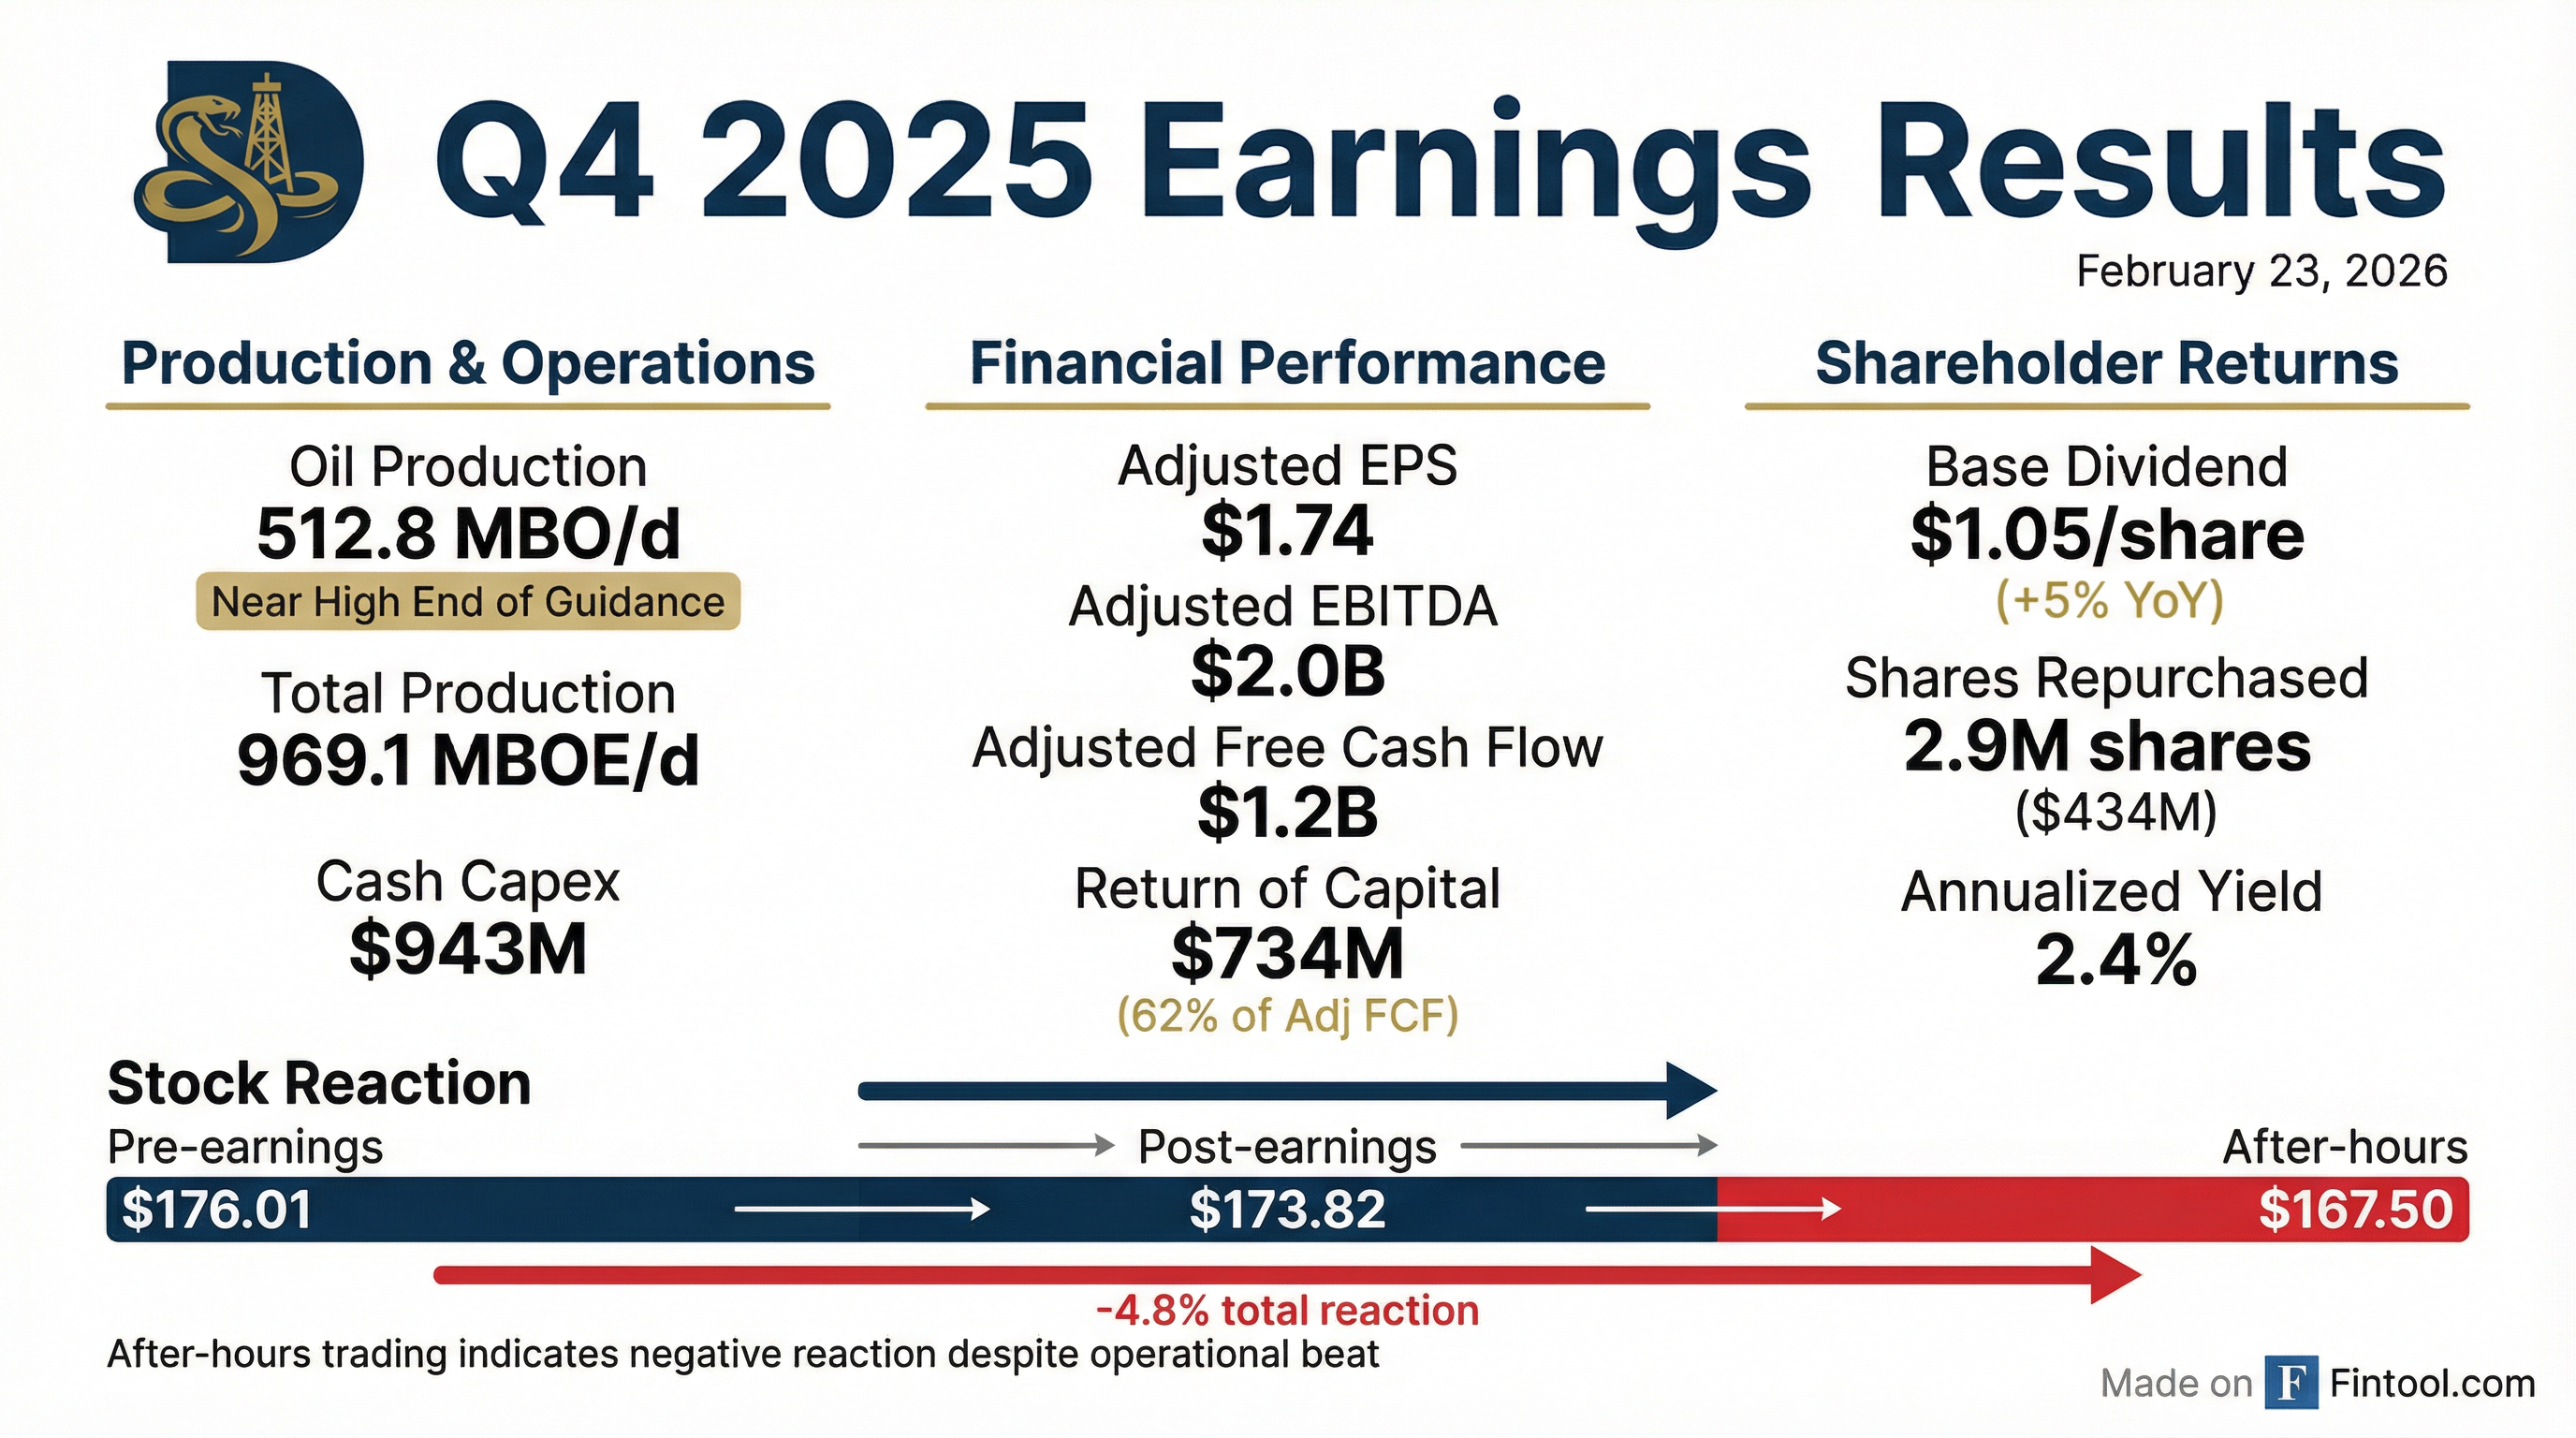
Diamondback Energy (NASDAQ: FANG) delivered solid Q4 2025 operational results with oil production near the high end of guidance, but shares fell nearly 5% in after-hours trading as investors digested flat 2026 production guidance and a $3.7 billion non-cash impairment charge.
The Permian pure-play reported Q4 adjusted EPS of $1.74 and Adjusted Free Cash Flow of $1.2 billion, returning $734 million to shareholders (62% of Adjusted FCF) through dividends and buybacks. Management struck a cautious tone, describing the macro environment as a "yellow light" scenario while positioning the company for flexibility.
Did Diamondback Beat Earnings?
Diamondback's Q4 2025 results came in at the upper end of guidance ranges:
The company generated $2.3 billion in operating cash flow despite oil prices down ~15% year-over-year. Full year 2025 production averaged 497.2 MBO/d with Adjusted Free Cash Flow of $5.9 billion—a 39% reinvestment rate (down from 44% in 2024).
Year-Over-Year Execution (2024 → 2025):
How Did the Stock React?
Despite operational strength, FANG shares dropped sharply after the release:
The negative reaction likely reflects several factors:
- Flat 2026 guidance: Production of 500-510 MBO/d essentially maintains Q4 levels rather than growing
- $3.7B impairment: Non-cash charge due to lower oil prices affecting proved property values
- Cautious macro tone: CEO Van't Hof described a "yellow light" environment with supply concerns
What Did Management Guide for 2026?
Diamondback's 2026 plan prioritizes discipline over growth:
Q1 2026 Guidance: Oil production of 502-512 MBO/d with capital expenditures of $900-975 million.
2026 Free Cash Flow Sensitivity to Oil Prices:
The capital budget includes approximately $150 million for exploratory development in the Barnett/Woodford formations and enhanced oil recovery tests. Management emphasized they can "accelerate activity quickly if the market tightens" or "moderate activity if conditions significantly soften."
What Changed From Last Quarter?
Several key developments shifted in Q4:
Positive Changes:
- Dividend raised 5%: Base quarterly dividend increased to $1.05/share ($4.20 annual) from $1.00
- Debt reduction accelerated: Consolidated net debt down $1.3B QoQ to $14.6B
- SGF overhang addressed: Agreement with largest shareholder for orderly stock sales (up to 3M shares/quarter)
- Asset sales executed: $1.2B from EDS and EPIC pipeline sales
Negative Changes:
- $3.7B impairment: Lower oil prices triggered ceiling test impairment on proved properties
- LOE increased: Lease operating expenses rose ~$0.30/BOE to $5.91 after EDS divestiture
- Reserves revised down: 304 MMBOE downward revisions, primarily from lower commodity prices
Capital Allocation: Aggressive Buybacks Continue
Diamondback returned $3.2 billion to shareholders in 2025 (54% of Adjusted FCF):
Management repurchased more shares in 2025 than in 2024 and 2023 combined, buying at a weighted average price of $145.26/share. The share repurchase authorization has $2.3 billion remaining with no time limit.
CEO Van't Hof signaled continued aggression: "We expect to continue to be aggressive buyers of our stock until commodity prices recover."
Key Management Quotes
On operational excellence:
"We drilled longer wells faster and cheaper than ever before. Average spud to total depth time was reduced to close to eight days... These efficiency gains should be seen as permanent, translating directly to higher stockholder value."
Operational Track Record (2023-2025):
On the macro environment:
"We continue to view the current macro backdrop as a 'yellow light' scenario, but the 'red light' scenario seems less apparent than it did over the last three quarters of 2025."
On the impairment:
"This impairment is non-cash... and does not change the fact that we have a significant inventory of high-quality undeveloped locations that are not reflected in SEC reserve values today."
Q&A Highlights From the Earnings Call
The Q4 2025 earnings call focused heavily on resource expansion and operational execution. Key themes:
Barnett Economics & Returns:
- Returns become competitive vs. core Midland at $800/ft well cost
- PV impact is "significantly larger" than core wells despite similar IRRs
- Oil EUR of ~75 BO/ft (50% above core zones)
- Productivity differential speaks to rock quality, not just early-time rates
Operational Efficiency Gains:
- Continuous pumping averaging 4,500 ft/day, with peaks above 5,500 ft/day
- Some wells achieving sub-6 day spud-to-TD (average still ~8 days)
- Average lateral length up 600 ft YoY—"a big number on a big company"
- Testing shorter stages enabled by continuous pumping efficiency
Tariff Exposure:
- Casing repriced quarterly based on index with supplier
- Inflation primarily on casing side (Section 232 tariffs)
- Tubular goods procured at longer lead times when pricing favorable
- Management not expecting tariff relief near-term
International Opportunities:
- "Certainly low from a strategic perspective"
- Studied global opportunities to understand cost curve positioning
- Conclusion: "We have a very, very good long-duration inventory in the Permian Basin"
- Focus remains on "staying home" where Diamondback has basin expertise
Reserve Revisions:
- Majority of revisions price-related (FY25 averaged $64.73 WTI)
- "Pod downgrades"—acquired wells moved to front of development plan
- PDP well performance unchanged—revisions not from underperformance
- Currently 70% PDP, 30% pods (3-year avg development horizon vs. SEC's 5 years)
Macro & Growth Outlook:
- Red light scenario "seems less apparent" than past 3 quarters
- Could eventually "hold CapEx flat and see what growth comes out"
- Organic growth will come "at some point"—"that day is not today"
- Oversupply concerns haven't materialized as aggressively as expected
Inventory Depth and Reserves
Diamondback boasts nearly two decades of high-quality inventory at its 2026 drilling pace:
Year-End 2025 Proved Reserves:
- Total proved: 3,618 MMBoe (+2% YoY)
- PDP reserves: 2,521 MMBoe (70% of total)
- PDP oil: 1,174 MMBo
- Oil as % of total (3-stream): 49%
- PD F&D costs: $8.52/Boe (vs. $10.51/Boe in 2024)
- Reserve replacement: 118%
Resource Expansion: Barnett and Woodford
Diamondback revealed substantial details on its Barnett/Woodford program, which received significant attention on the Q4 2025 earnings call:
Position & Inventory:
- Gross locations: 900 in the Barnett (up from prior disclosures)
- Working interest: 64% (lowest in Diamondback's stack)
- Current well cost: ~$1,000/lateral foot
- Cost reduction target: 20% to ~$800/ft would make returns competitive
- 2026 capital allocation: ~$150 million budgeted
2026-2027 Drilling Plan:
- 2026: Drilling ~30 wells, completing ~10 (ramping in H2)
- 2027: Ramping to ~100 wells for full development mode
Well Productivity vs. Core Midland:
CEO Van't Hof on the Barnett reveal:
"It's a pretty exciting reveal of our position in the Barnett... We were able to grow that position without cap raises or press releases or buying the next private equity-backed entity. We're not having to pay $3-6 million a stick to build this position."
Development Approach: The Barnett wells use oil-based mud and require an extra casing string. Management plans to apply simul-frac, continuous pumping, and multi-well pad development to drive costs down. Target lateral lengths of 15,000+ feet will also help reduce per-foot costs.
Barnett vs. Woodford Geology: The two are distinct reservoirs. In some areas, a thin Mississippian lime section allows a single wellbore to drain both formations. Diamondback is targeting the lower Barnett and fracking through to the Woodford where geology permits.
Surfactant Testing: The Next Frontier
Diamondback revealed a 60-well surfactant pilot program executed in H2 2025:
CEO Van't Hof framed the opportunity:
"This is all gravy, right? This is all added production, added reserves to something that we didn't think was possible a few years ago. I'd say this is V1.0—this is what Wolfcamp B fracs looked like in 2014. Look how far we've come in 10 years."
Management expects surfactants to eventually become part of the standard well lifecycle as the technology matures. Testing will continue on both production enhancement and new completions.
Data Center & Hyperscaler Opportunity
Diamondback highlighted progress on its data center strategy:
- Full package offering: Surface acreage, water supply (Deep Blue), and gas/power from upstream
- Value proposition: Power purchase agreements with material uplift to natural gas pricing
- Status: "Making progress... conversations have improved"
- Disclosure timing: "We're not gonna announce anything until it's completely binding"
CFO Jere Thompson noted this represents "another creative tool in the toolbox" for improving natural gas realizations beyond pipeline egress solutions.
Hedge Position and Risk Management
Diamondback's hedge strategy maximizes upside while protecting the downside:
Oil Hedges (Q1-Q4 2026):
Natural Gas Hedges:
- 840,000 MMBtu/d in Henry Hub costless collars ($2.87 floor / $6.35 ceiling)
- 680,000 MMBtu/d hedged for FY 2027 at similar levels
- ~65% of estimated 2026 gas production protected
Natural Gas Positioning
Diamondback is diversifying its gas pricing exposure away from WAHA:
New pipeline capacity expected online later in 2026 will provide "optionality and upside to realized pricing that should translate to an improved bottom line."
Viper Energy: Key Subsidiary
Viper Energy (NASDAQ: VNOM) is Diamondback's publicly-traded mineral and royalty subsidiary:
Viper provides perpetual ownership exposure to high-margin, largely undeveloped assets while lowering Diamondback's consolidated breakevens.
What to Watch Going Forward
Key Catalysts:
- Q1 2026 production execution vs. 502-512 MBO/d guidance
- Barnett/Woodford delineation results and cost improvements
- Pace of share repurchases from remaining $2.3B authorization
- WAHA basis improvement as new pipelines come online H2 2026
- Viper Energy post-divestiture integration
Risks:
- Oil price weakness below breakeven assumptions
- Continued reserve impairments if commodity prices stay depressed
- Execution risk on exploratory Barnett/Woodford program
- Permian Basin induced seismicity regulations
Financial Summary
Market Snapshot (as of Feb 20, 2026):
- Market Cap: $49.6B
- Enterprise Value: $70.2B
- Share Count: 282M
- Annual Base Dividend: $4.20 (2.4% yield)
Updated February 24, 2026 with Q&A highlights from the earnings call.
Related: Diamondback Company Overview | Q4 2025 Transcript | Q3 2025 Earnings