FIDELITY D & D BANCORP (FDBC)·Q4 2025 Earnings Summary
Fidelity D&D Bancorp Posts Record Quarter: EPS Up 36% to $1.37
January 28, 2026 · by Fintool AI Agent
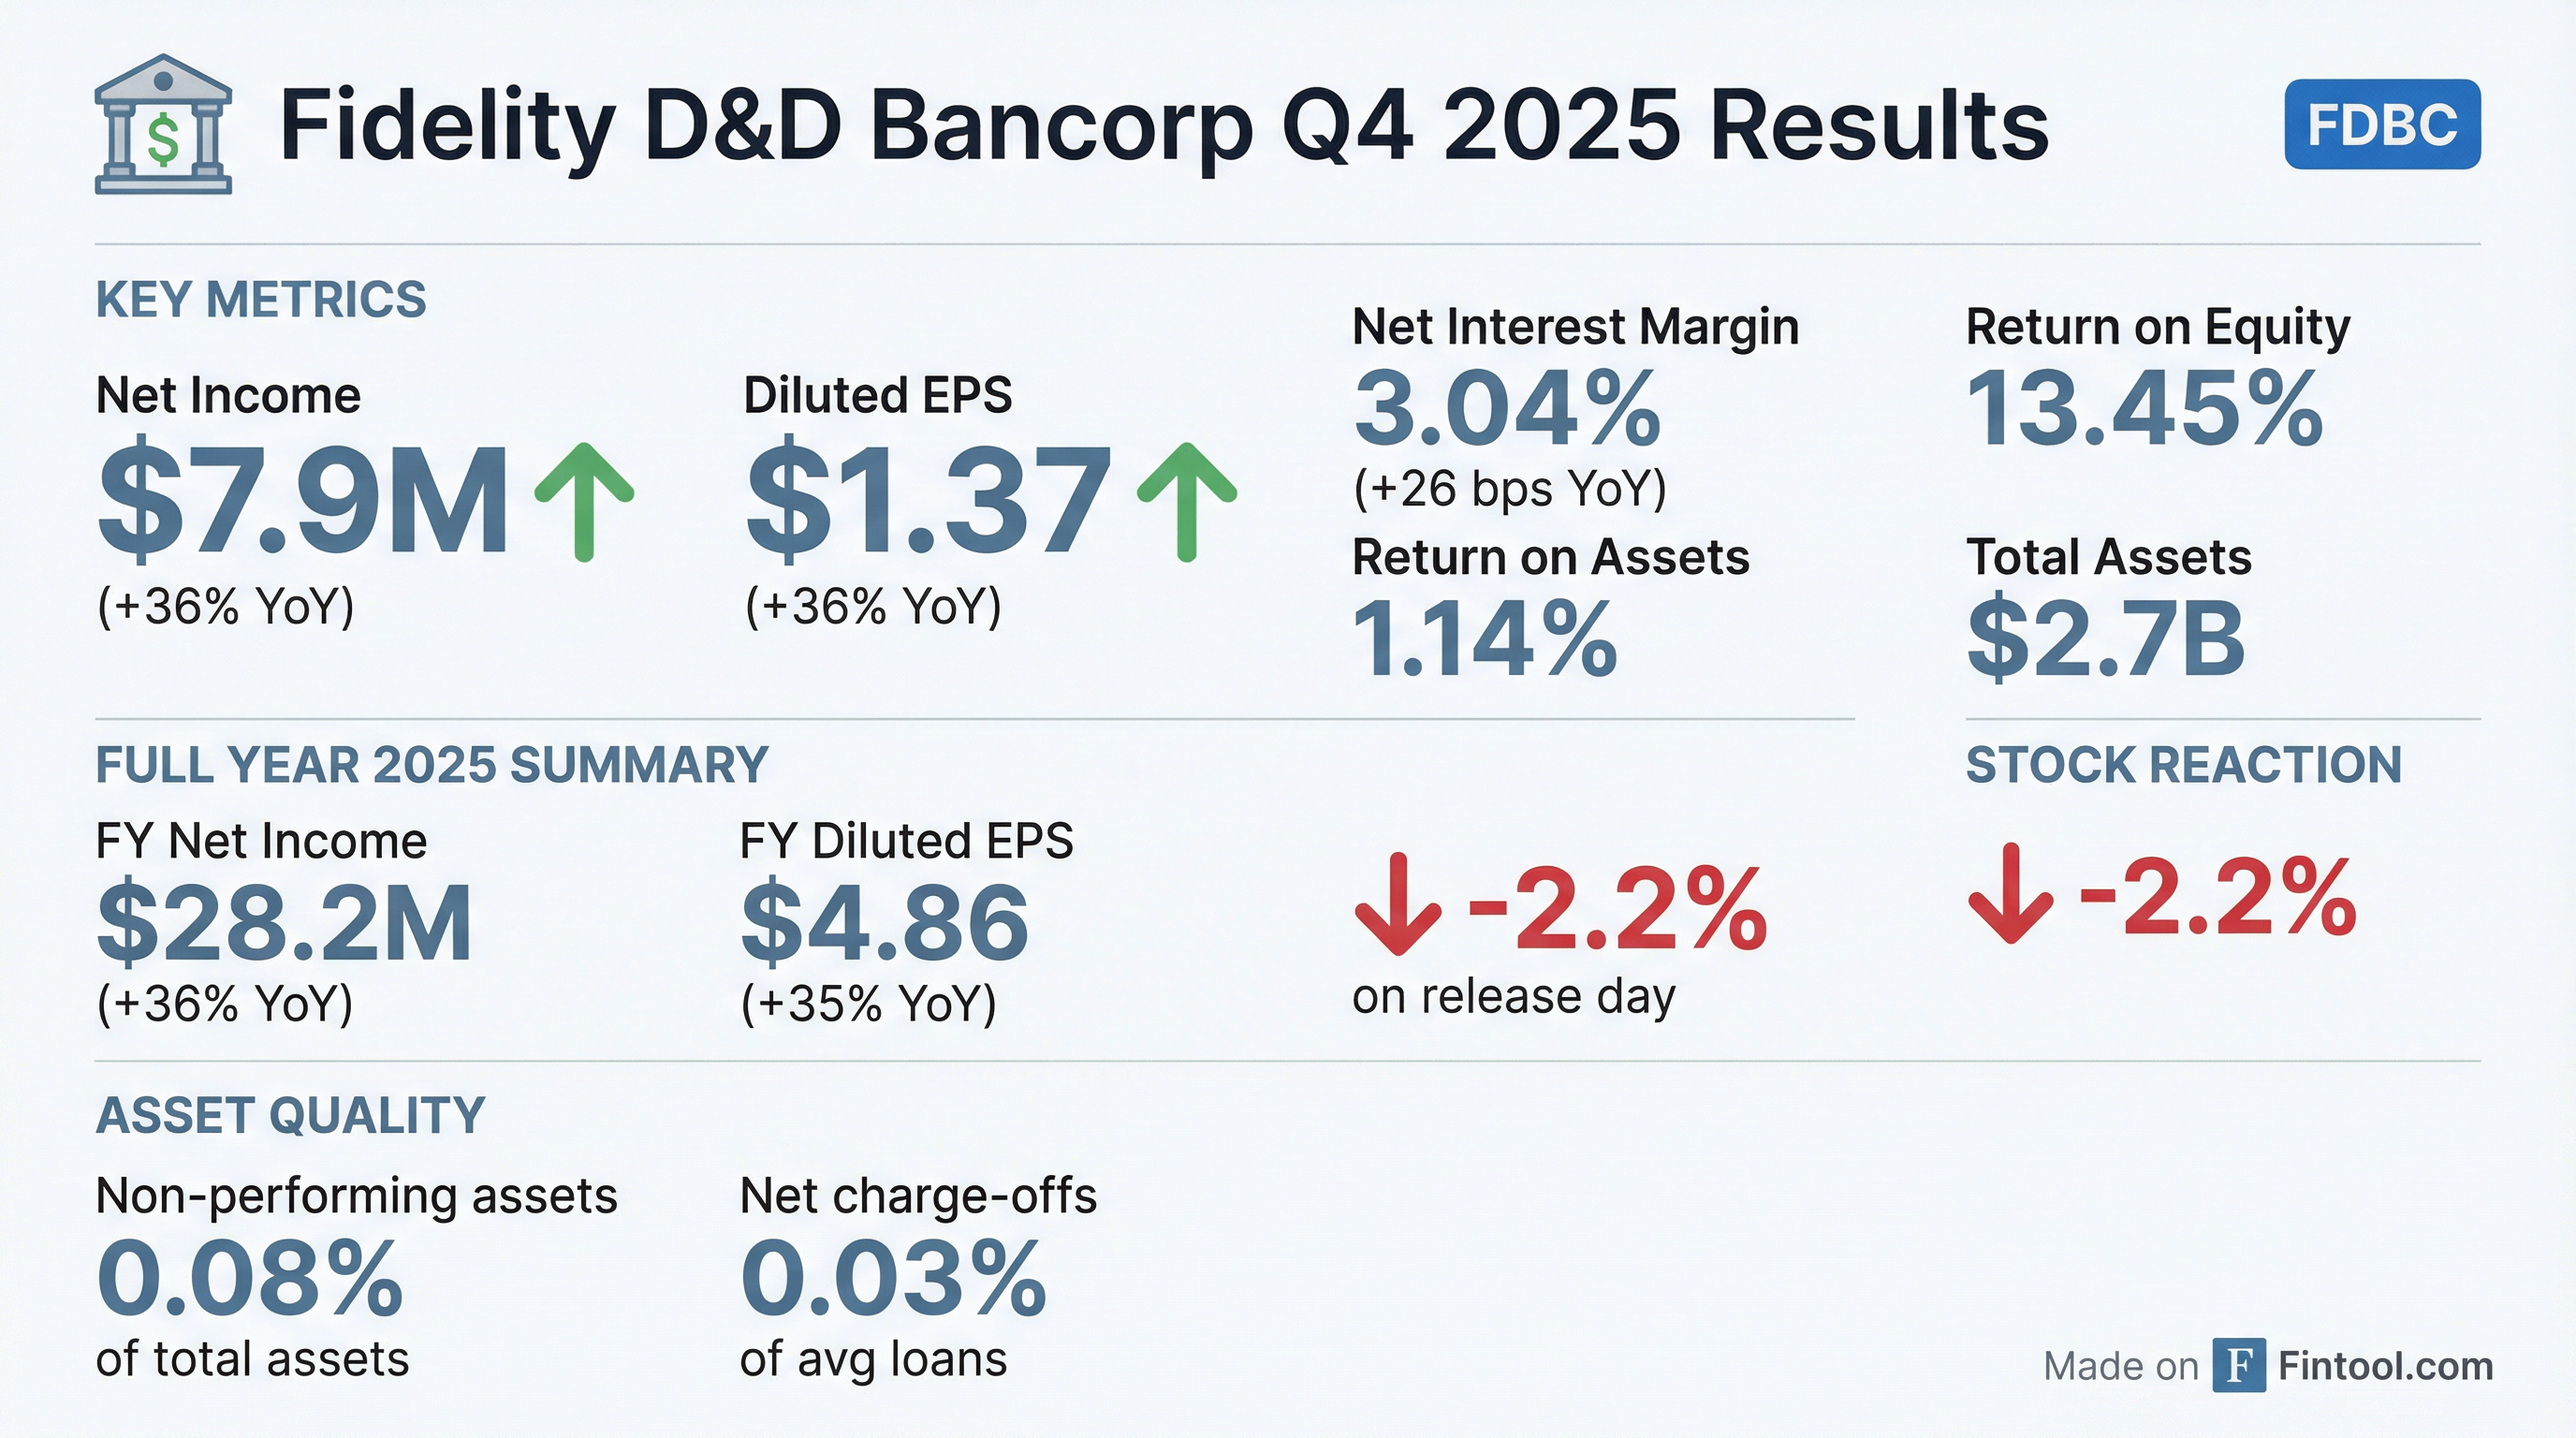
Fidelity D&D Bancorp (NASDAQ: FDBC) delivered its strongest quarter in company history, with Q4 2025 net income of $7.9 million and diluted EPS of $1.37—both up 36% year-over-year. The Pennsylvania-based regional bank's performance was driven by margin expansion, disciplined balance sheet management, and continued improvement in asset quality.
Did Fidelity D&D Bancorp Beat Estimates?
FDBC is a small-cap regional bank ($250M market cap) with limited analyst coverage, so no consensus estimates are available for comparison. However, the YoY results speak for themselves:
For the full year 2025, FDBC posted net income of $28.2 million and EPS of $4.86, representing 36% and 35% growth respectively over 2024.
What Did Management Say?
CEO Daniel Santaniello called this "the strongest financial quarter in our history" and attributed the results to strategic execution:
"The Bank hit year end assets of $2.7 billion, delivering a 36% year over year increase in net income of $28.2 million and a 35% increase in diluted earnings per share. The full year results reflect the execution of our strategic initiatives, disciplined balance sheet management, and continued improvement in our net interest margin."
Management highlighted positioning for a "strong 2026" and credited bankers for their dedication to serving clients and communities.
What Changed From Last Quarter?
The key driver of FDBC's performance continues to be net interest margin expansion:
The margin improvement came from two sources:
- Higher asset yields: Loan portfolio FTE yield increased 17 bps to drive $2.7M more in quarterly interest income
- Lower funding costs: Cost of interest-bearing liabilities fell 18 bps YoY to 2.42%
How Did the Stock React?
Despite record results, FDBC shares fell 2.2% on the release date, closing at $42.73. The stock is down from its 52-week high of $50.00 and currently trades below both its 50-day moving average ($44.50) and 200-day average ($43.23).
The muted stock reaction likely reflects the broader community bank environment and the stock's significant multiple compression over the past year—FDBC traded near $59 in early 2024 despite delivering much lower earnings.
Balance Sheet & Capital Position
FDBC continues to build capital while growing assets:
Capital ratios remain well above regulatory minimums:
- Tier 1 leverage: 9.34%
- Total risk-based capital: 14.78%
- CET1: 13.65%
Asset Quality Continues to Improve
Credit quality metrics reached their best levels in recent memory:
The provision for credit losses on loans was just $100K in Q4 2025, down from $250K in Q4 2024, reflecting the improved asset quality.
Profitability Trends
FDBC's efficiency and return metrics have improved meaningfully:
*Values retrieved from S&P Global
The efficiency ratio improvement of over 700 bps YoY demonstrates strong operating leverage as revenue growth outpaced expense increases.
Full Year 2025 Summary
What to Watch Going Forward
Catalysts:
- Continued NIM expansion if rate environment remains favorable
- Loan growth momentum (6% growth in 2025)
- Wealth management revenue growth (+$0.6M YoY)
- Deposit growth supporting further asset expansion
Risks:
- Rate sensitivity if Fed cuts accelerate
- Commercial real estate concentration risk
- Limited analyst coverage reduces visibility
- Stock trading at significant discount to tangible book ($42.73 vs $37.88 TBV)
Key Takeaways
- Record quarter: Q4 2025 was the strongest in company history with EPS of $1.37 (+36% YoY)
- Margin expansion: NIM improved 26 bps YoY to 3.04% on higher yields and lower funding costs
- Asset quality pristine: NPAs at just 0.08% of assets, down from 0.30%
- Capital building: Tangible book value grew 18% to $37.88, yet stock trades at only 1.13x TBV
- Operating leverage: Efficiency ratio improved to 58.35% from 65.48% a year ago