FIRST HAWAIIAN (FHB)·Q4 2025 Earnings Summary
First Hawaiian Beats on EPS and Revenue as NIM Expands
January 30, 2026 · by Fintool AI Agent
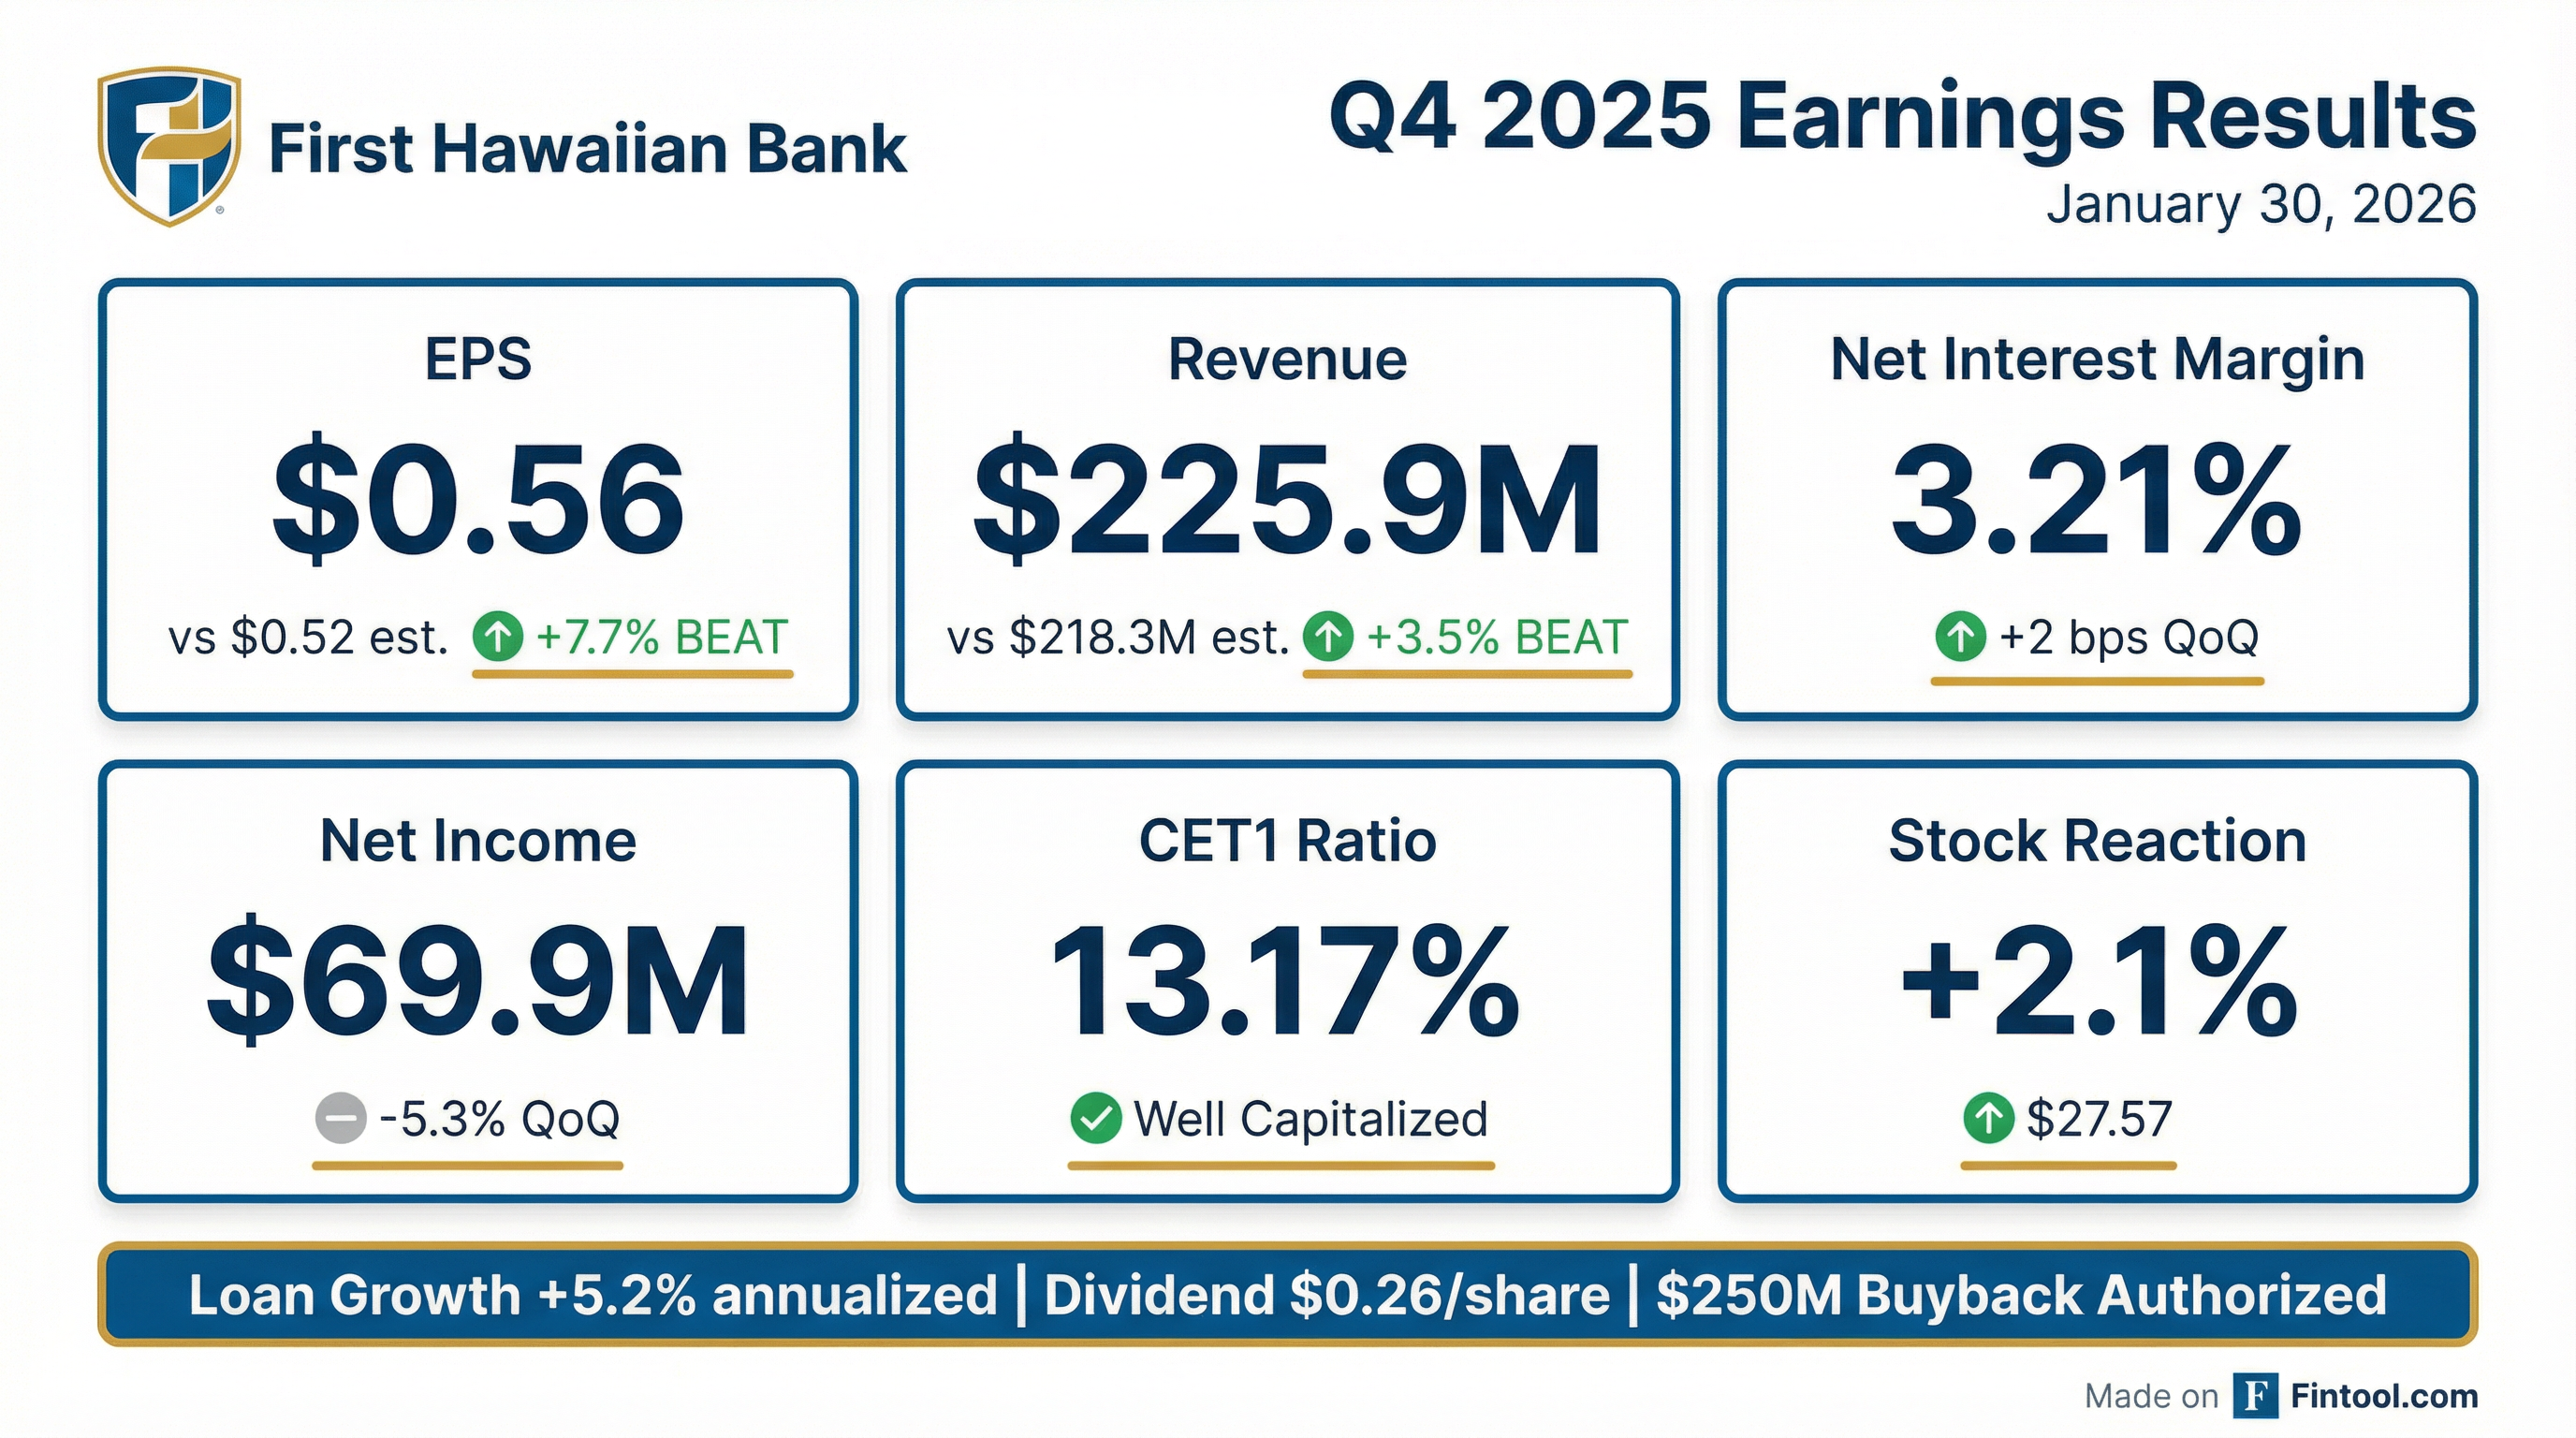
First Hawaiian (FHB) reported Q4 2025 results this morning that beat analyst expectations on both the top and bottom lines. EPS of $0.56 topped the $0.52 consensus by 7.7%, while revenue of $225.9 million exceeded the $218.3 million estimate by 3.5% . The Hawaii-focused regional bank benefited from expanding net interest margin and solid loan growth, though net income declined sequentially due to higher provision expense.
Did First Hawaiian Beat Earnings?
Yes — First Hawaiian delivered a double beat in Q4 2025.
The EPS beat was driven by net interest income expansion, with NIM increasing 2 basis points sequentially to 3.21% . Cost of deposits declined 9 basis points to 1.29%, helping offset the impact of Fed rate cuts on asset yields .
Sequential net income declined 5.3% from $73.8 million in Q3 to $69.9 million, primarily due to a higher provision for credit losses of $7.7 million vs $4.5 million in the prior quarter .
What's Happening in Hawaii?
The local economy remains healthy, supporting FHB's core franchise.
CEO Bob Harrison provided context on Hawaii's economic backdrop :
- Unemployment: Hawaii at 2.2% vs national rate of 4.5%
- Tourism: Visitor arrivals down 0.2% YTD (Canada weakness), but spending up 6% to $19.6B through November
- Japan visitors: Up 2.8% YTD, a bright spot for the tourism mix
- Housing: Oahu median single-family home at $1.1M (+4.3% YoY); condos at $512K (-5.2% YoY)
The strong employment picture and resilient tourism spending support FHB's consumer and commercial loan books.
What Changed From Last Quarter?
Net interest margin inflected higher while credit costs increased.
The NIM improvement was driven by deposit repricing and the full quarter benefit from FHLB borrowings that matured in September . Total cost of funds declined 12 basis points to 1.29%.
Loan and Deposit Dynamics:
- Loans increased $183.1 million (+5.2% annualized), driven primarily by C&I growth
- Total deposits declined $213.9 million, but retail and commercial deposits increased $233 million
- Public deposits decreased $447 million due to operating account balance declines
How Is Credit Quality Holding Up?
Asset quality remains strong but watch lists are building.
Net charge-offs increased to $5.0 million (0.14% annualized) from $4.2 million in Q3 . Special mention loans increased to 1.32% of total loans, up from 1.16%, suggesting some migration in the watch list .
CRE Portfolio Health:
- CRE portfolio weighted average LTV: 58.4%
- Office exposure: 5.2% of total loans with 27 bps criticized
- Multi-family CRE criticized rate: 10.4% (notable elevated level)
- Multi-family construction criticized rate: 0.0%
- Retail CRE criticized: 2.0%; Hotel CRE criticized: 6.8%
What Did Management Guide?
FHB provided a constructive outlook for 2026 with modest growth expectations.
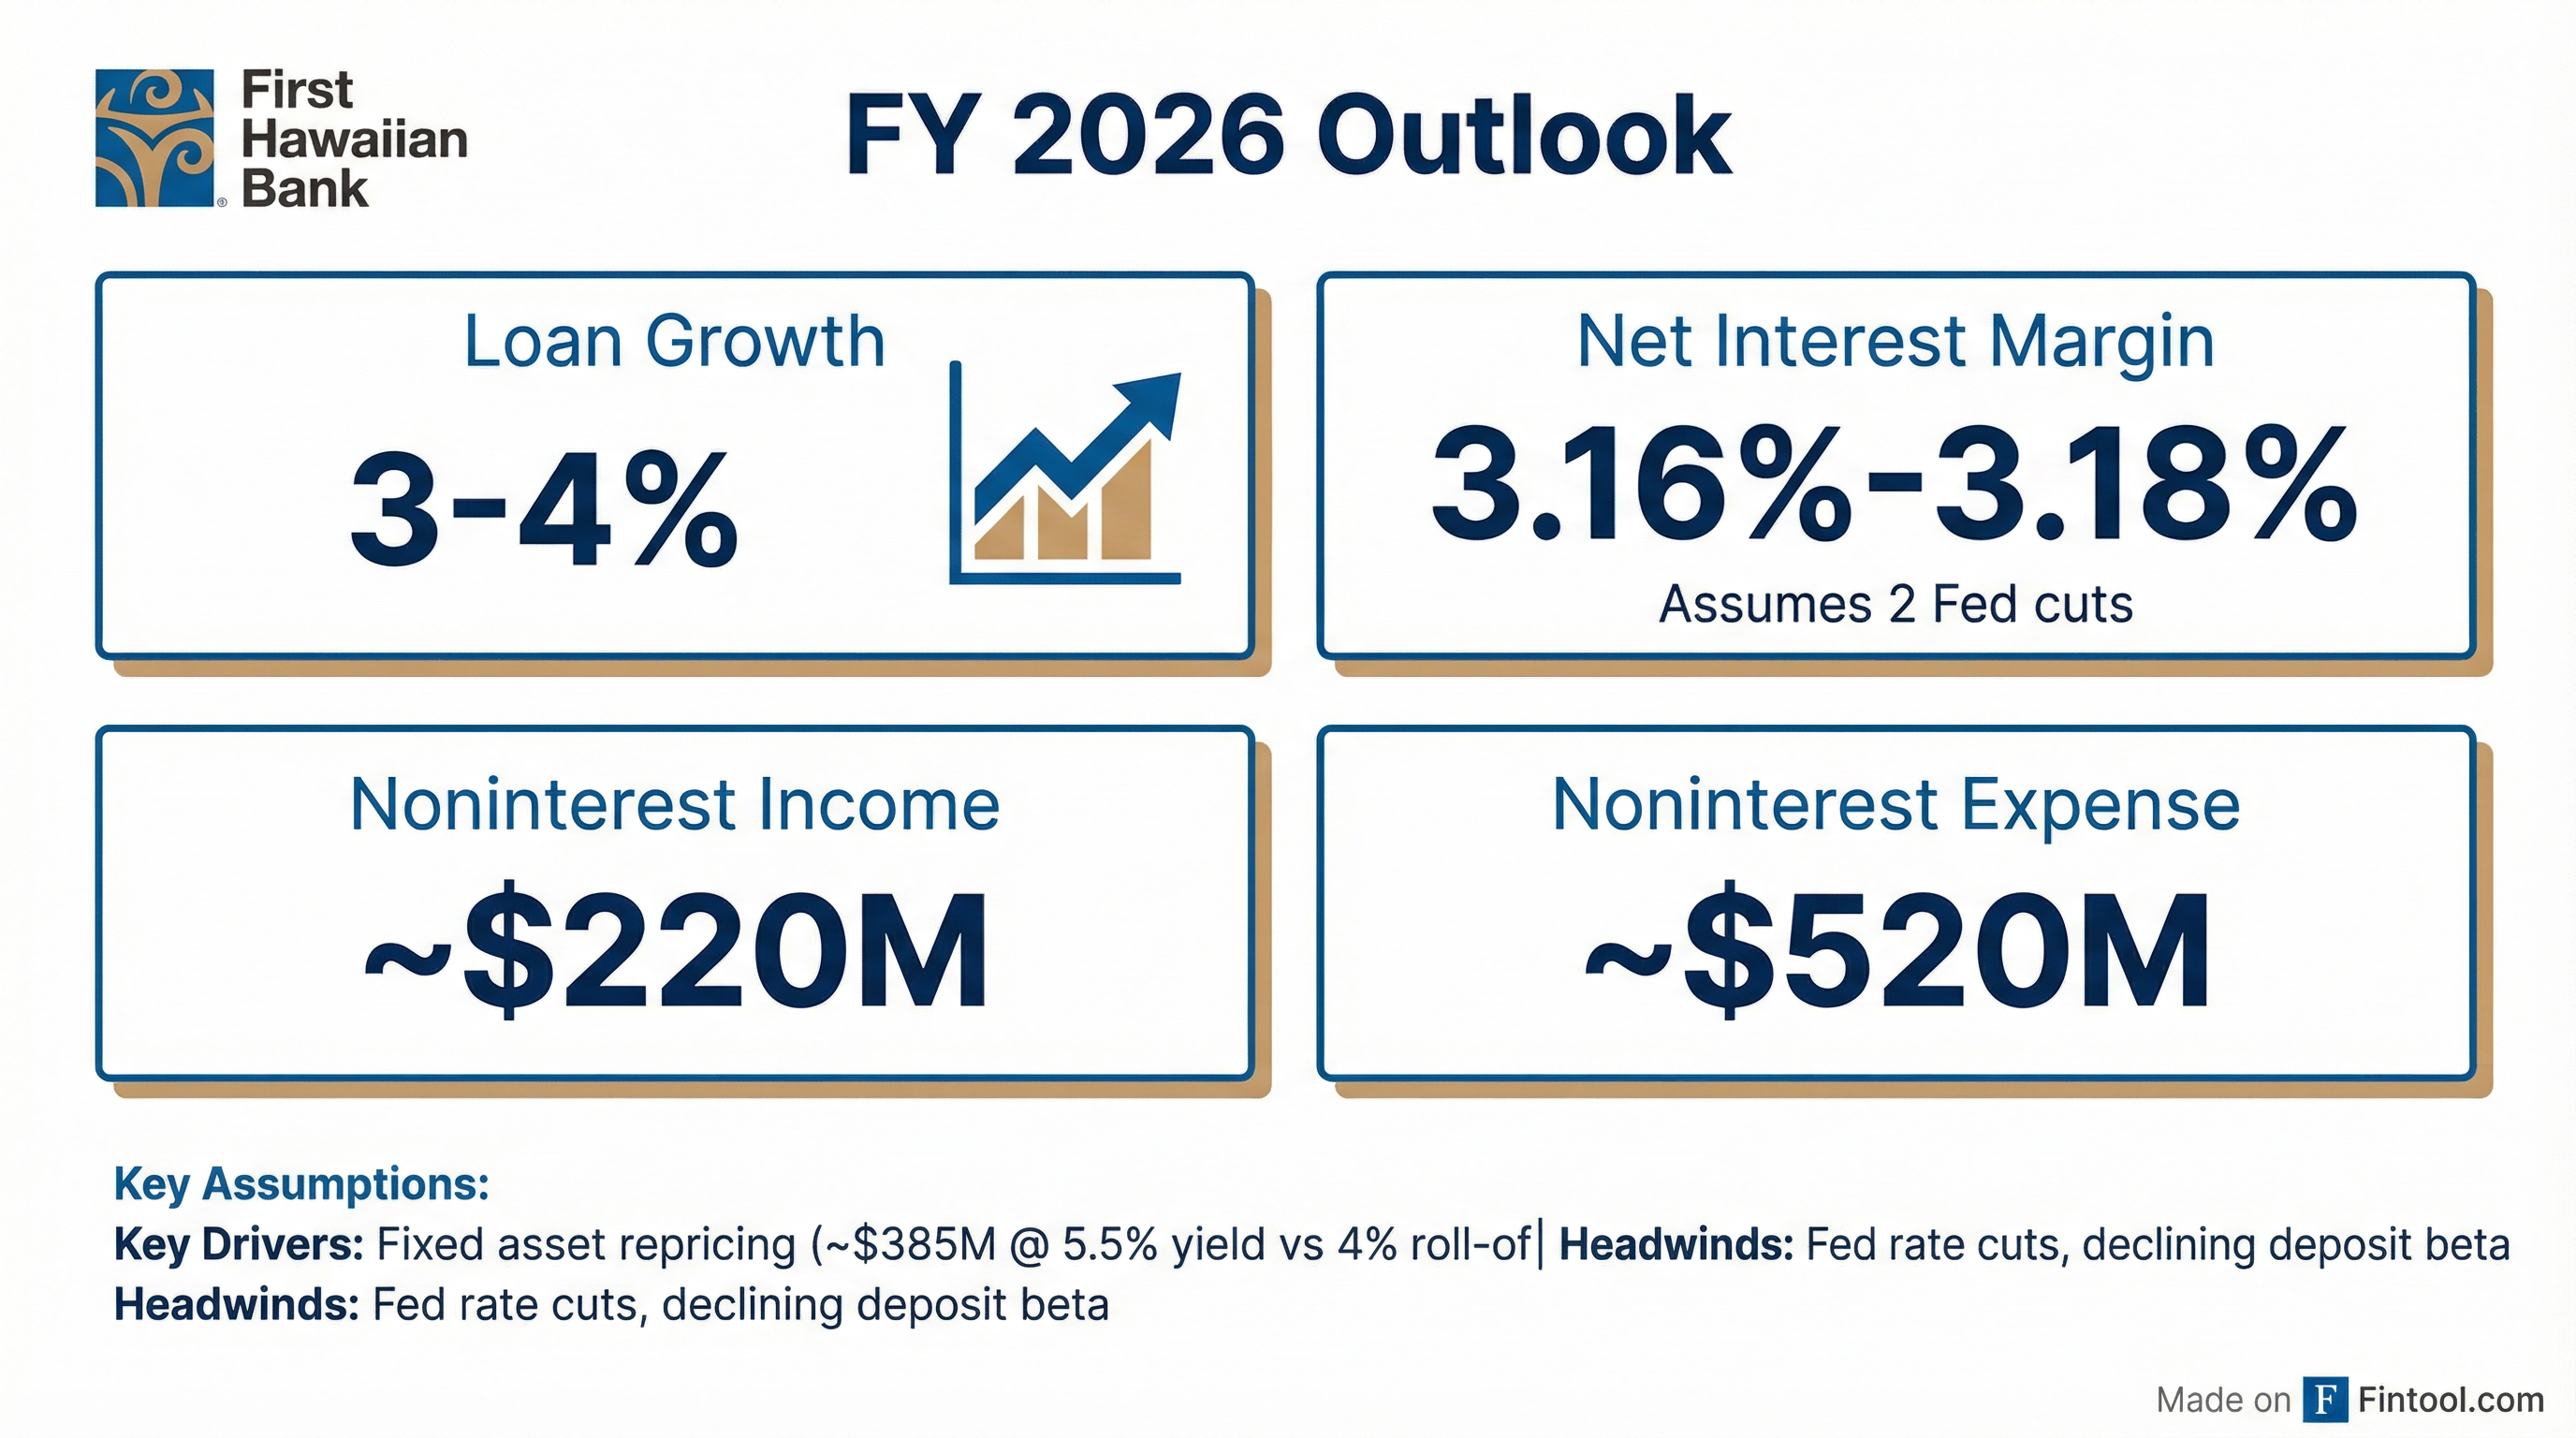
Key Assumptions:
- Two 25 basis point Fed rate cuts in May and September
- ~$385 million of fixed rate cash flows repricing at ~5.5% new yield vs ~4% roll-off yield
- Headwinds from Fed rate cuts and declining deposit beta
The NIM guidance of 3.16-3.18% represents a slight contraction from the Q4 2025 exit rate of 3.21%, reflecting the impact of expected Fed cuts.
Fixed Asset Repricing Tailwinds: Management detailed the repricing opportunity in Q&A :
- ~$600M of securities repricing at 180-200 bps pickup
- ~$1B of loan portfolio cash flows repricing at 80-100 bps pickup
- Q1 NIM expected to decline a few basis points from the 3.21% December exit rate
Deposit Beta Expectations: Interest-bearing deposit beta expected to step down from 35% in Q4 to 30-35% going forward as deposit rates approach a floor . December spot rate on deposits was 1.24% .
What Did Management Say About Loan Growth?
Loan growth expected to be back-half weighted in 2026.
CEO Bob Harrison provided color on the loan pipeline and growth dynamics :
- C&I growth drivers: Draws on existing lines plus a new auto dealer relationship
- Payoff headwinds: Permanent lenders are "just as hungry for assets as the banks" and taking out loans earlier than normal
- Pipeline: Multifamily still busy, but bookings take time to fund
- First half vs. second half: Lower growth expected in H1 as payoffs from the SVB-era slowdown work through; H2 should see "more normalized growth"
"We're still a little bit outrunning the payoffs that happened in that gap period we talked about... of SVB slowing down production for a while, a couple of years ago. That's behind us, mostly in the first half of the year." — Bob Harrison, CEO
Is FHB Looking at M&A?
Management confirmed appetite for mainland acquisitions west of the Rockies.
Harrison outlined FHB's M&A criteria :
With CET1 at 13%+ versus a 12% target, FHB has capital flexibility for either M&A or continued buybacks.
How Did the Stock React?
FHB shares rose 2.07% on earnings day, extending YTD gains to 7.4%.
The stock is trading near its 52-week high, with the beat-and-raise helping offset concerns about credit migration and the margin outlook for 2026.
Capital Return Update:
- Quarterly dividend: $0.26 per share (payable Feb 27, 2026)
- Share repurchases: ~1.0 million shares at $26 million in Q4
- New buyback authorization: $250 million
- CET1 ratio: 13.17% (well capitalized)
What Are the Key Takeaways?
The quarter validated FHB's positioning in the rate cycle.
Positives:
- NIM expansion despite Fed cuts, showing deposit repricing benefits
- Healthy loan growth of 5.2% annualized with C&I leading
- Strong capital position supporting $250M buyback authorization
- Efficiency ratio improved to 55.1%
Concerns to Monitor:
- Credit migration with special mention loans at 1.32%
- Multi-family CRE criticized rate elevated at 10.4%
- NIM guidance implies some margin compression in 2026
- Public deposit volatility continues
- C&I concentration: Auto dealers represent 34.5% of C&I book
Why Have Expenses Been So Well Controlled?
Technology investments enabled FHB to exit expensive vendor relationships.
Management explained the expense discipline :
"One of the primary reasons why we've been able to hold costs down in the last year or two has been... some of the investments we made in the past in technology enabled us to exit higher-cost delivery... We've terminated expensive vendor relationships and been able to take that in-house." — Bob Harrison, CEO
The 2026 expense guide of ~$520M represents a return to "more normalized expense growth" as most of the vendor savings have been captured . Seasonally, Q1 expenses typically run slightly higher before flattening through the year .
Data sourced from First Hawaiian Q4 2025 earnings presentation and S&P Global.