FARMERS NATIONAL BANC CORP /OH/ (FMNB)·Q4 2025 Earnings Summary
Farmers National Banc Corp. Posts 172nd Consecutive Profitable Quarter, Stock Dips 3% on Merger Costs
January 28, 2026 · by Fintool AI Agent
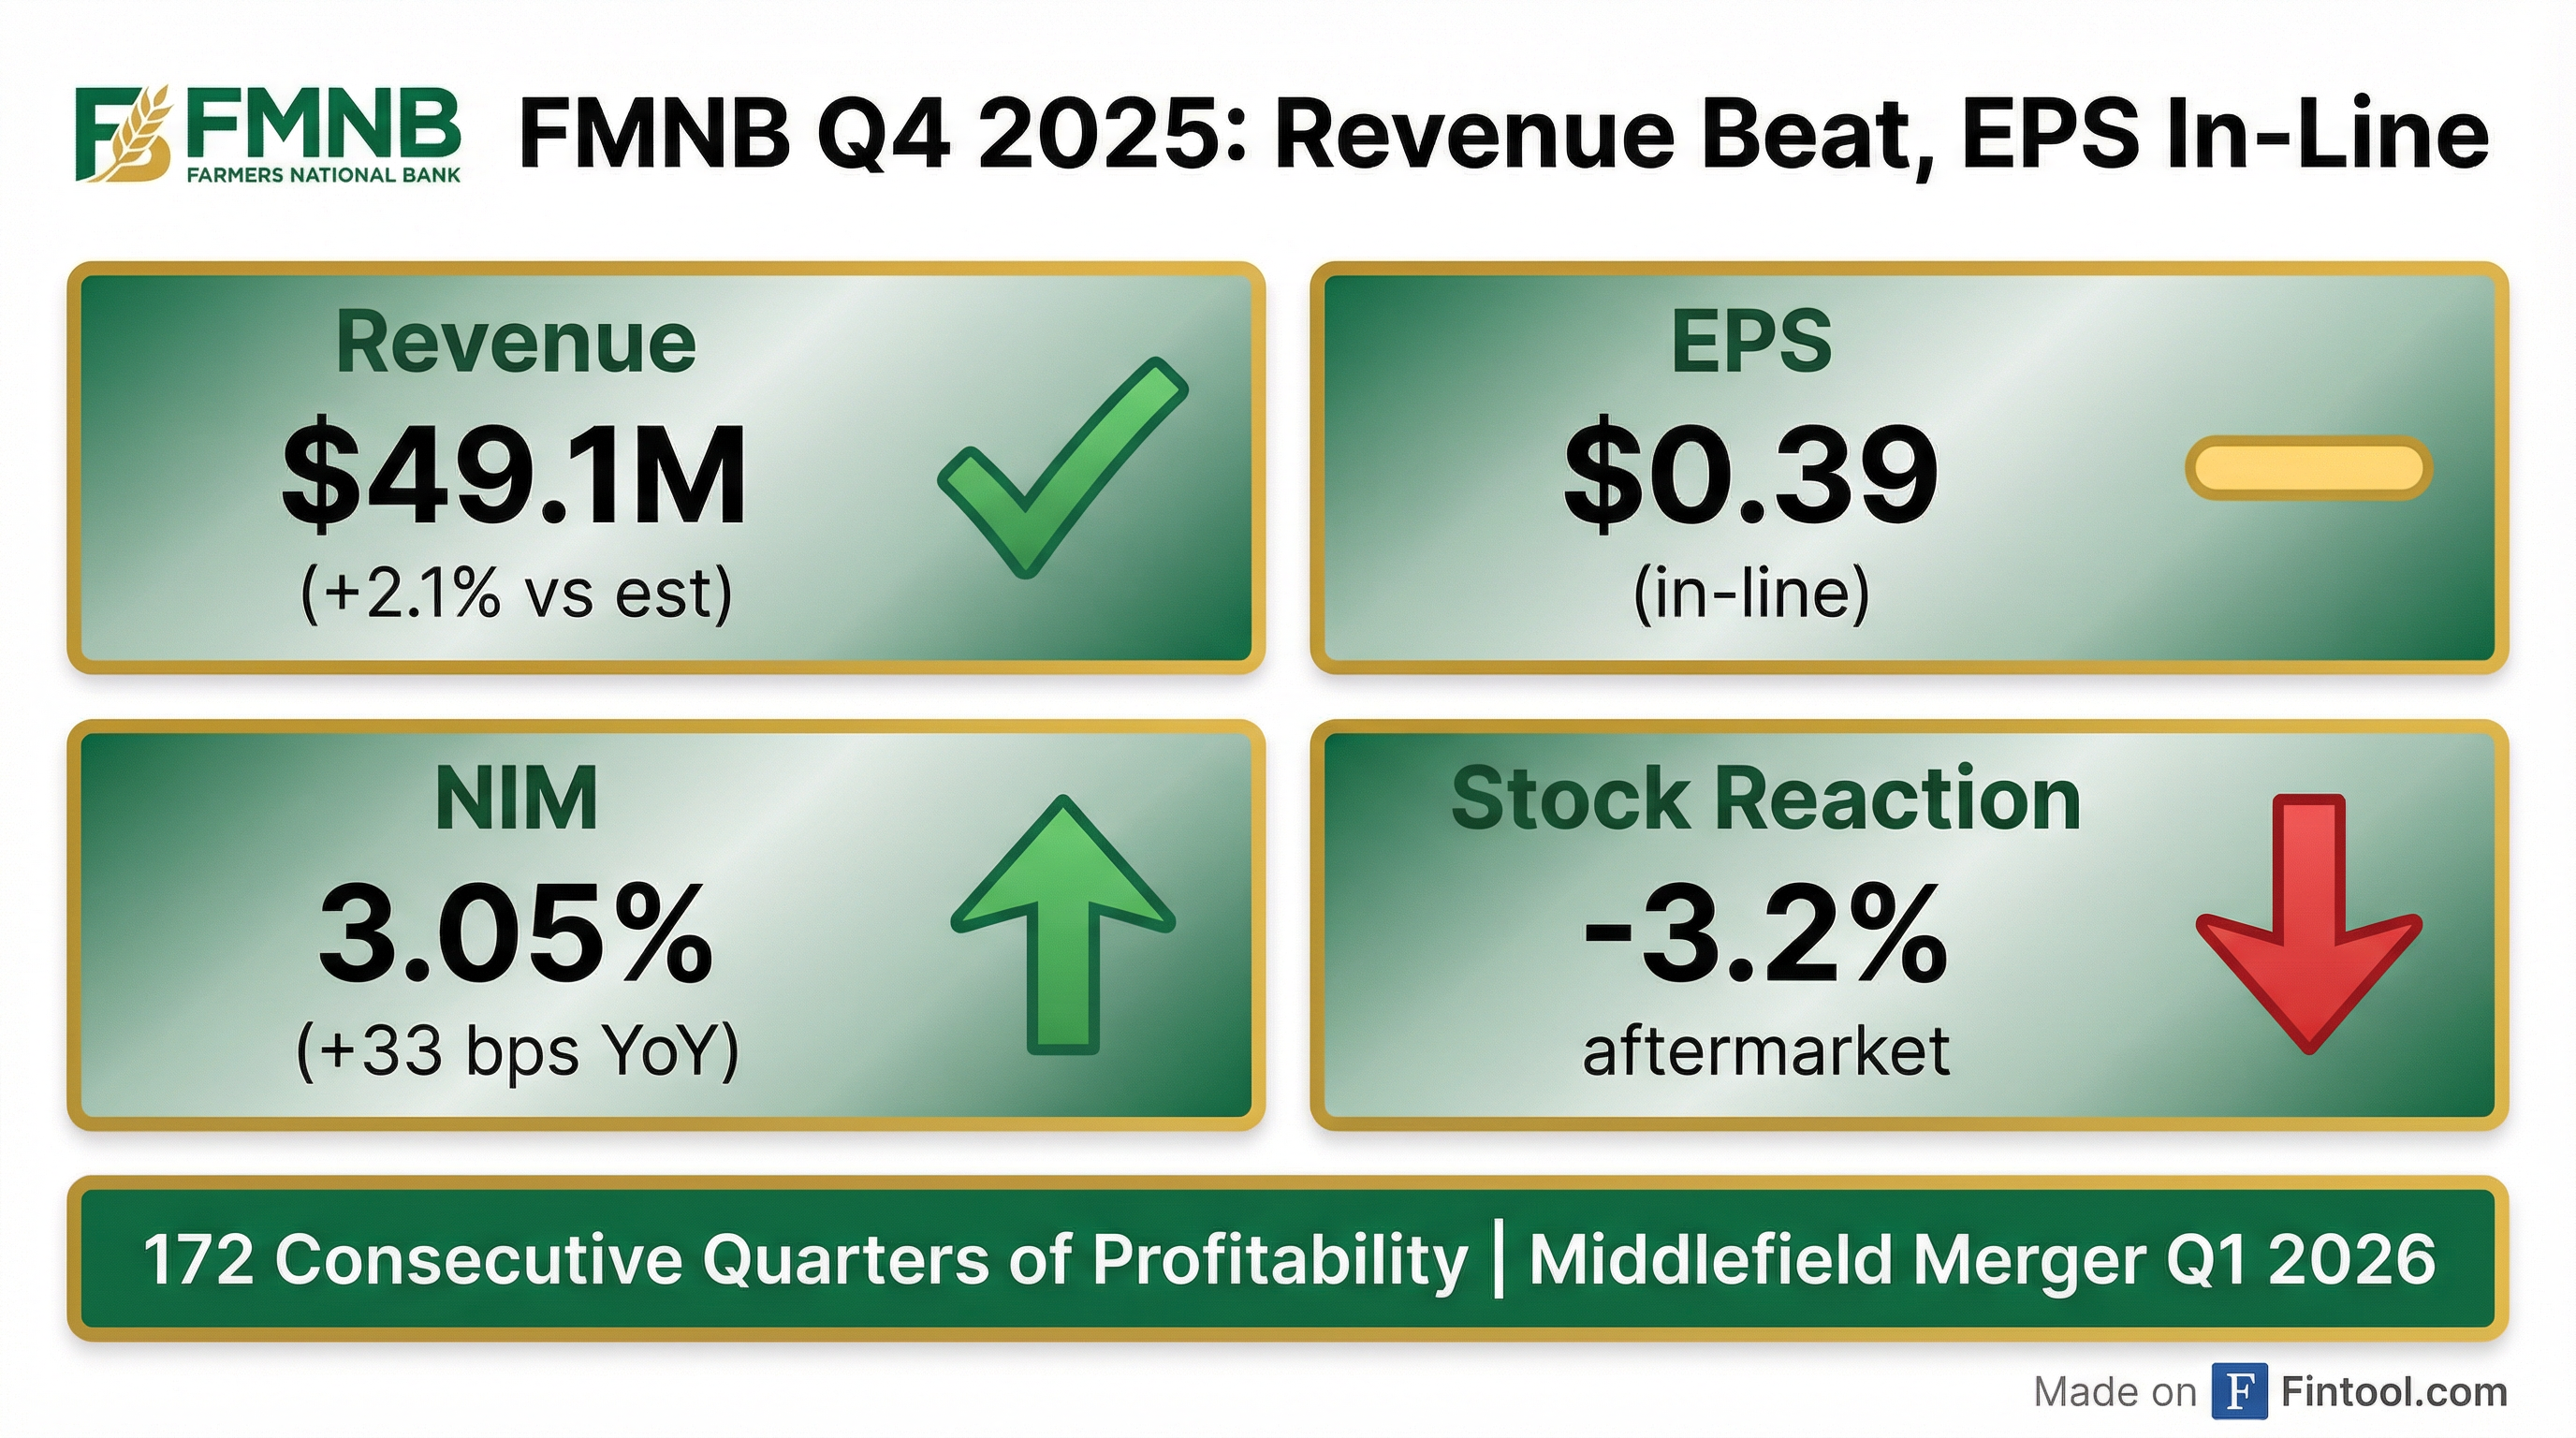
Farmers National Banc Corp. (NASDAQ: FMNB) reported Q4 2025 earnings of $0.39 per diluted share, marking 172 consecutive quarters of profitability for the Ohio-based community bank . Revenue beat consensus by 2.1%, driven by a 33 basis point expansion in net interest margin year-over-year. However, shares fell 3.2% in aftermarket trading as investors digested elevated merger costs and a notable credit charge-off.
Did Farmers National Beat Earnings?
*Values from S&P Global and company filings *
FMNB delivered another solid quarter with net income of $14.6 million, up 1.7% from $14.4 million in Q4 2024 . Excluding $925,000 in merger and core conversion costs and $143,000 in pretax losses from asset sales, adjusted net income was $15.1 million, or $0.40 per diluted share .
The revenue beat was driven by strong net interest income performance, with net interest margin expanding to 3.05% from 3.00% in Q3 2025 and 2.72% in Q4 2024 .
What's Driving the Margin Expansion?

The 33 basis point year-over-year improvement in net interest margin reflects the Fed's rate-cutting cycle benefiting FMNB's liability-sensitive balance sheet :
*Data from Q4 2025 8-K *
Management noted that Federal Reserve rate cuts in late 2024 and 2025 have compressed funding costs while asset yields continue to reprice higher due to lag effects . CEO Kevin Helmick stated:
"With additional cuts to the federal funds rate expected in 2026, the Company expects its net interest margin will continue to expand into 2026 as the Company remains liability sensitive and will benefit from falling interest rates."
What Did Management Guide?
Management did not provide explicit quantitative guidance but offered positive commentary on several fronts:
NIM Outlook: Expects continued margin expansion in 2026 given liability sensitivity and anticipated Fed rate cuts
Merger Timeline: Middlefield Banc Corp. acquisition expected to close in Q1 2026, with the Registration Statement declared effective on December 15, 2025
Core System Conversion: Announced intention to migrate to Jack Henry core banking platform alongside the Middlefield integration
What Changed From Last Quarter?
Credit Quality Improvement: A troubled loan relationship totaling $7.3 million that moved to nonaccrual in Q3 2025 paid off during Q4, with a $2.5 million charge-off recognized prior to payoff . Non-performing loans declined to $26.2 million from $35.3 million sequentially.
Deposit Trends: Total deposits declined $58 million sequentially to $4.34 billion due to $93.4 million in seasonal public fund runoff, partially offset by core deposit growth of $35.6 million . For full year 2025, customer deposits (excluding brokered CDs) grew $151 million, or 3.6% .
How Did the Stock React?
Despite the revenue beat and margin expansion, FMNB shares declined 3.2% in aftermarket trading. The negative reaction likely reflects:
-
Elevated Credit Costs: Provision for credit losses was $2.3 million vs. $295,000 in Q4 2024, impacted by a $2.5 million charge-off and an additional $2.0 million charge-off from a troubled relationship workout
-
Merger Uncertainty: Investors may be pricing in integration risk as the Middlefield deal approaches closing
-
Loan Declines: Total loans decreased $35 million sequentially as commercial portfolio payoffs outpaced originations
Capital Position
Capital ratios from Q4 2025 8-K
Total stockholders' equity increased to $485.7 million from $465.9 million in Q3 2025, driven by improved accumulated other comprehensive income (AOCI) as the mark-to-market adjustment on the securities portfolio improved by $62.4 million since the beginning of 2025 .
Segment Performance
Fee Income Breakdown:
*Fee income data from 8-K *
Trust fees benefited from deeper market penetration in acquired markets, while retirement plan consulting grew significantly following the December 2024 acquisition of Crest Retirement Advisors LLC .
Forward Catalysts
-
Middlefield Merger Closing (Q1 2026): Combined entity will create larger regional footprint across Ohio and Pennsylvania
-
Core System Conversion: Jack Henry platform migration expected to improve operational efficiency
-
Continued NIM Expansion: Liability-sensitive balance sheet positioned to benefit from further Fed rate cuts
-
Fee Business Growth: Wealth management and insurance businesses showing strong momentum
Key Risks
- Integration Execution: Middlefield merger and core conversion carry execution risk and elevated near-term expenses
- Credit Quality: While NPLs improved, the $4.5M in total charge-offs this quarter signals potential pockets of stress
- Interest Rate Sensitivity: If Fed pauses or reverses course, NIM expansion thesis may be challenged
- Loan Growth: Sequential loan declines need to reverse to support revenue growth
Full Year 2025 Summary
Full year data from 8-K
Farmers National delivered a strong 2025 with nearly 19% EPS growth, driven by margin expansion and disciplined expense management. The company enters 2026 well-positioned for the Middlefield integration while maintaining capital levels well above regulatory minimums.
Related Links: