FIRST INDUSTRIAL REALTY TRUST (FR)·Q4 2025 Earnings Summary
First Industrial Posts 11.7% FFO Growth, Hikes Dividend 12.4%
February 5, 2026 · by Fintool AI Agent
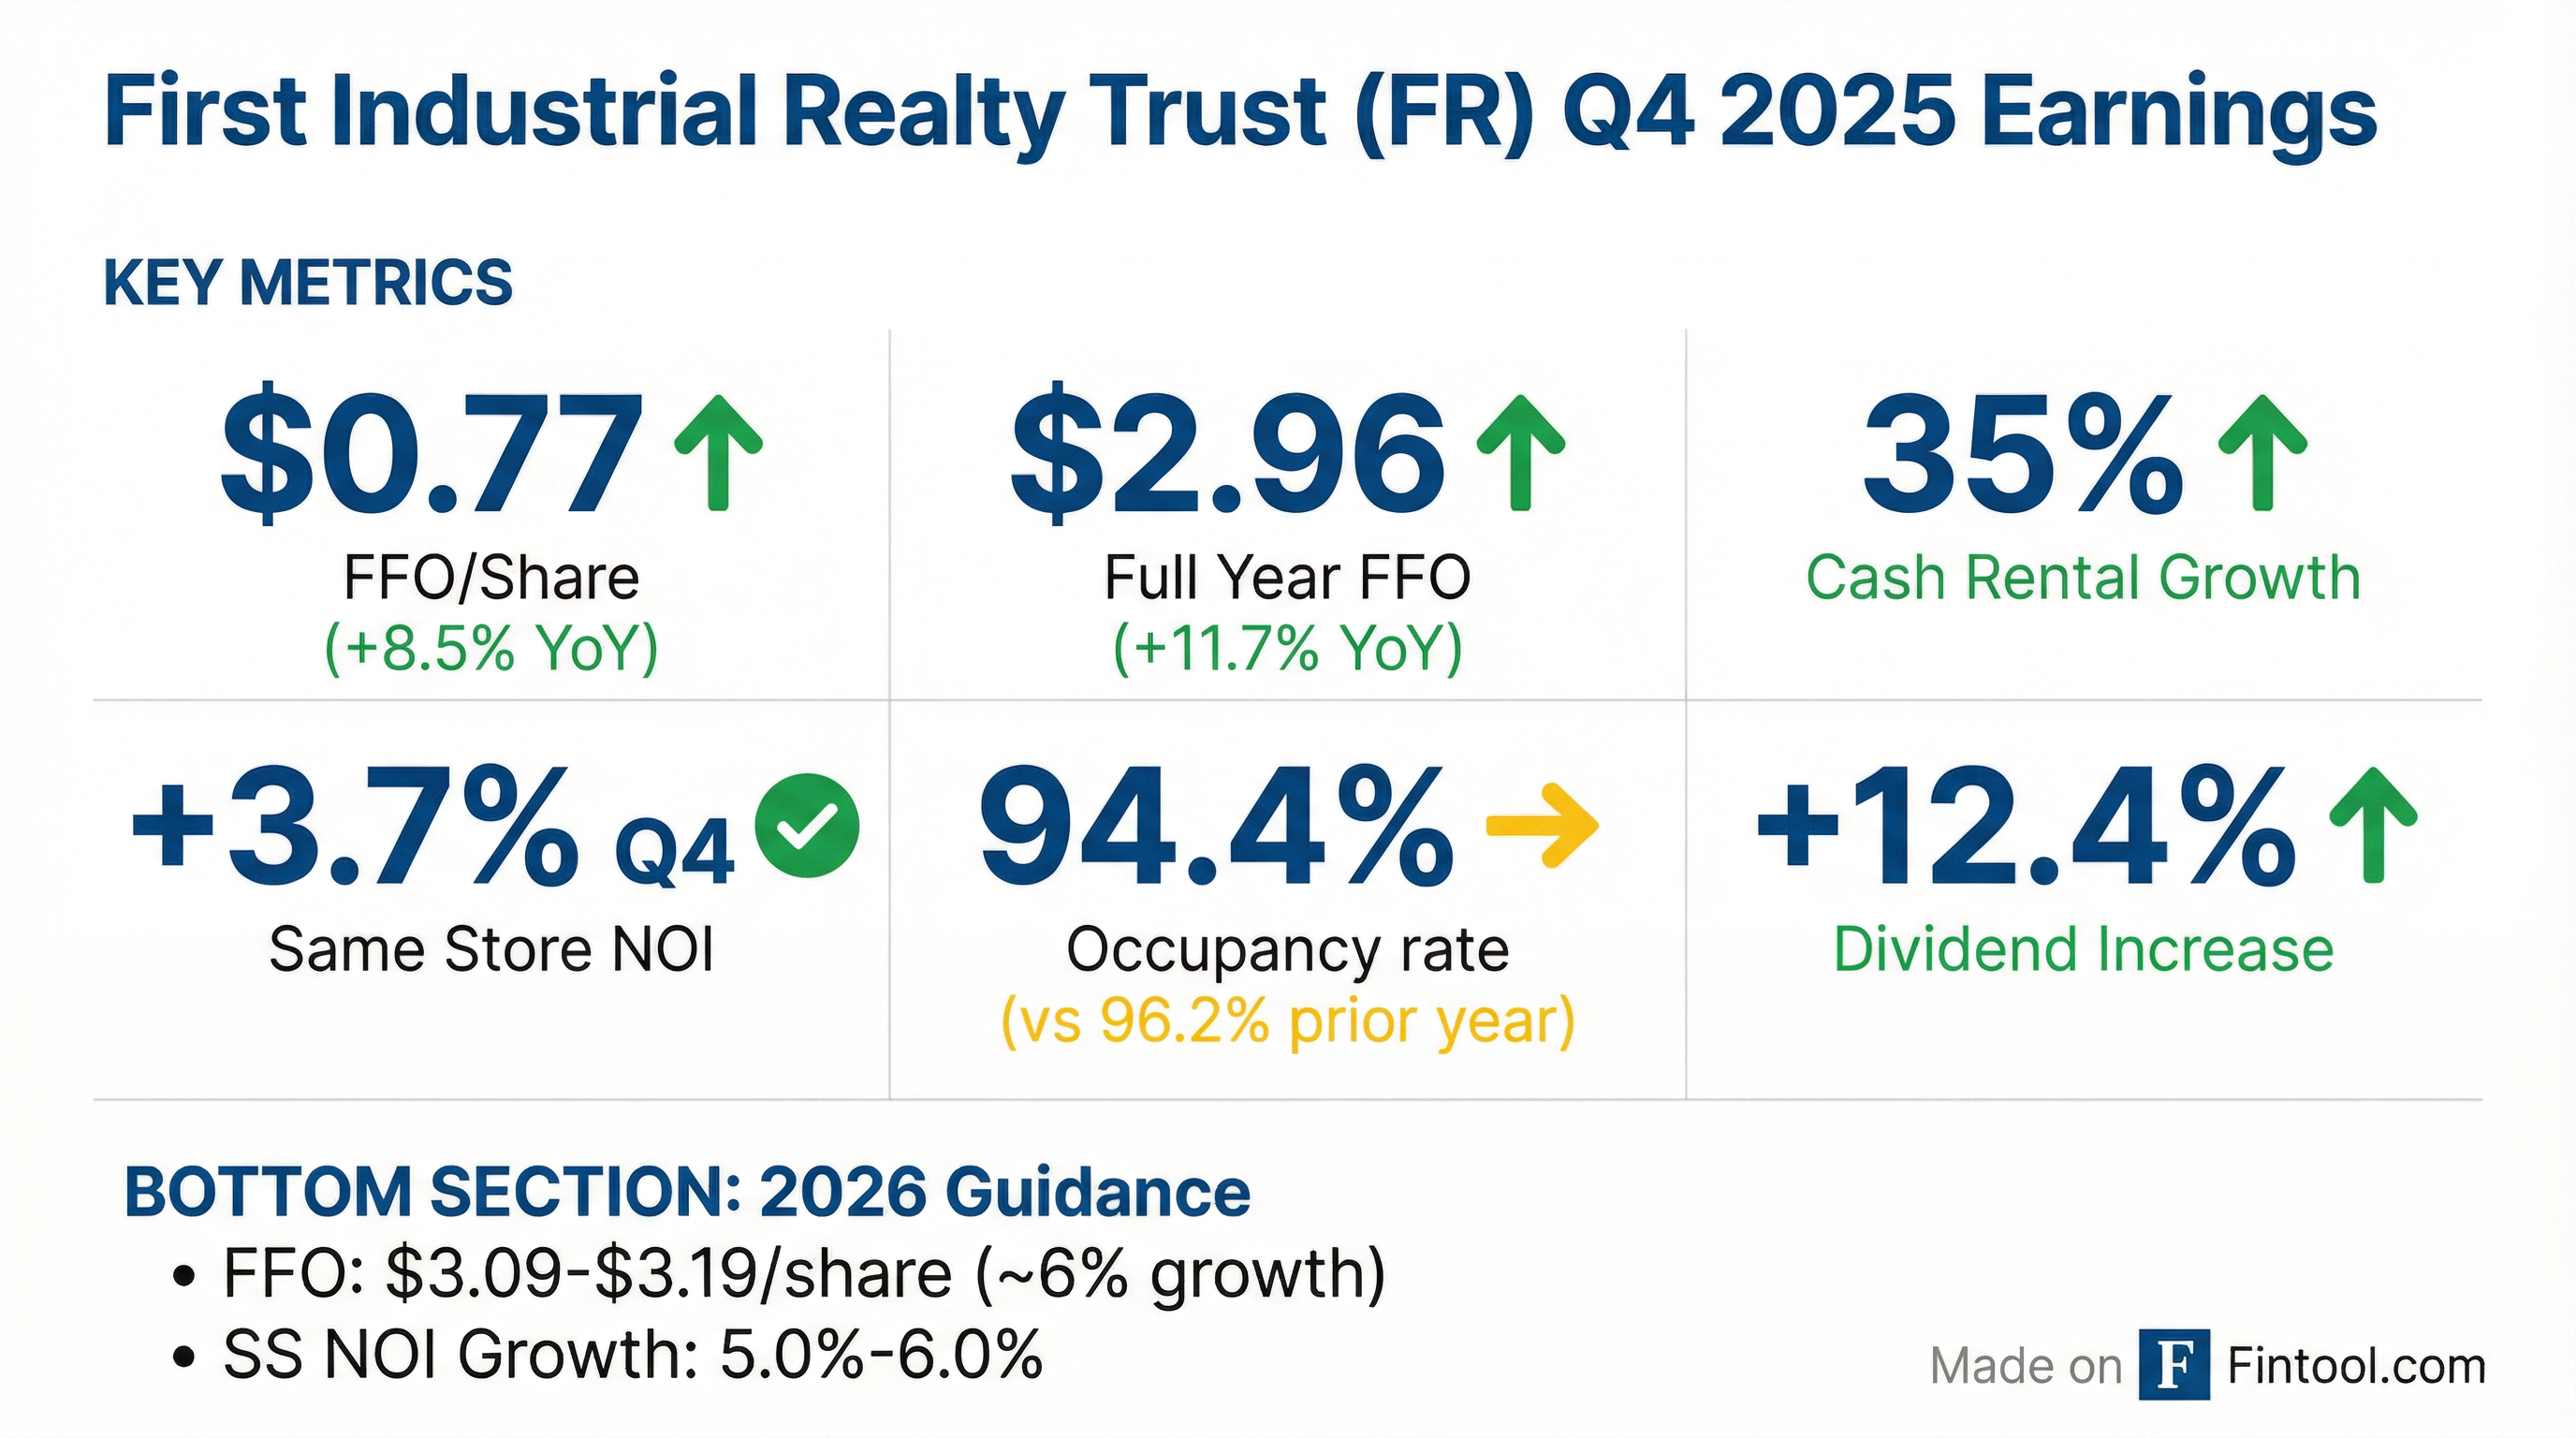
First Industrial Realty Trust (NYSE: FR) delivered strong Q4 2025 results with FFO of $0.77 per share, up 8.5% year-over-year. For full year 2025, FFO grew 11.7% to $2.96 per share. The industrial REIT also announced a 12.4% dividend increase and initiated 2026 guidance of $3.09-$3.19 FFO per share.
Did First Industrial Beat Earnings?
For the full year 2025:
- FFO: $2.96/share (+11.7% vs $2.65 in 2024)
- Same Store NOI: +7.1% (cash basis, excluding termination fees)
- Cash rental rate growth: 32% (37% excluding one fixed-rate renewal)
The quarter benefited from 35% cash rental rate growth on new and renewal leasing and contractual rent escalations, though partially offset by the 180 basis point decline in occupancy to 94.4%.
What Did Management Guide for 2026?
At the midpoint of $3.14, 2026 FFO guidance represents approximately 6% growth from 2025's $2.96. The guidance assumes:
- Bad debt expense of $1.0 million
- Includes costs for developments under construction plus two Q1 2026 starts (First Park Miami Building 4 and First Arlington Commerce Center III)
- Does not include future investments, dispositions, or capital markets activity
CEO Peter Baccile noted: "Leasing traffic at our key availabilities remains good and the overall fundamental picture continues to improve, with completions and new starts measured."
What Changed From Last Quarter?
Dividend Increase
The board declared a 12.4% dividend increase to $0.50 per share (from $0.445), payable April 20, 2026. This represents a 3.4% dividend yield at current prices.
Development Leasing Progress
Q4 saw notable development lease-up activity:
- First Liberty Logistics Center (Houston): Leased remaining 212,000 SF of 425,000 SF building
- First Harley Knox Logistics Center (Inland Empire): 100% leased (159,000 SF)
- First Park Miami Building 12: 57,000 SF leased (now 76% occupied)
Capital Allocation
In Q1 2026 to date, the company:
- Started two developments totaling 305,000 SF in Miami and Dallas ($70M investment)
- Closed $425M and $375M unsecured term loans, extending maturities to 2029-2030
- Eliminated 10 bps SOFR adjustment on term loans, reducing borrowing costs
Portfolio Performance Deep Dive
Geographic Revenue Concentration
The portfolio is heavily weighted to coastal and major logistics markets:
Coastal markets represent 57% of revenue, with target markets comprising 97% of the portfolio.
Occupancy by Market
Several markets show occupancy pressure, particularly developments placed in service:
Excluding recent developments placed in service, company-wide occupancy would be 96.2% vs reported 94.4%.
How Did the Stock React?
Earnings were released after market close on February 4, 2026. The stock closed at $58.44 prior to the announcement.
The stock has rallied 45% from its 52-week low of $40.31, reflecting improved sentiment around industrial REITs as new supply has moderated.
Development Pipeline & Investment Outlook
Under Construction
Six developments totaling 1.07 million square feet with $187 million estimated investment:
Target stabilized cap rate: 7.2% with expected profit margin of 40-50%.
Developable Land Bank
The company holds 973 acres of developable land with estimated buildout potential of 15.6 million square feet, including significant positions in:
- Orlando (First Park 417): 194 acres, 2.7M SF potential
- Chicago (First Park 94): 137 acres, 2.6M SF potential
- Inland Empire (multiple sites): 351 acres, 6.5M SF potential
Balance Sheet & Liquidity
Credit Ratings: BBB+ (Fitch), Baa2 (Moody's), BBB (S&P) — all Stable outlook
Debt Covenant Compliance:
- Leverage Ratio: 24.6% (limit: 60%)
- Fixed Charge Coverage: 5.0x (minimum: 1.50x)
- Unencumbered Asset Ratio: 253.9% (minimum: 150%)
Weighted average debt maturity is 4.7 years with no significant maturities until 2027 (after extension options).
Leasing Trends
For leases signed to date commencing in 2026, cash rental rate growth is running at 35%, reflecting 45% of 2026 expirations addressed.
2026 Lease Expirations
The below-market in-place rents provide embedded upside as leases roll to market rates.
Key Risks & Considerations
-
Occupancy Pressure: At 94.4%, occupancy is 180 bps below prior year, driven by developments entering the in-service pool and slower lease-up
-
Tariff Uncertainty: Management noted tariff policy evolution created a "volatile leasing market" in 2025, though decision-making appears to be normalizing
-
Development Lease-Up: 575,000 SF of completed developments remain unleased, including First Rockdale VI (317K SF, 0% leased)
-
Concentration Risk: Amazon represents 5.7% of annualized net rent and 6.0% of occupied space as the largest tenant
The Bottom Line
First Industrial delivered another strong quarter with 8.5% FFO growth, 35% cash rental rate increases, and a 12.4% dividend hike. The company navigated a challenging 2025 leasing environment impacted by tariff uncertainty while still achieving 11.7% full-year FFO growth.
Looking ahead, 2026 guidance of approximately 6% FFO growth reflects:
- Conservative occupancy assumptions (94-95%)
- Continued embedded rent growth from below-market leases rolling
- Disciplined development pipeline with 7%+ target yields
- Strong balance sheet with no near-term maturities
The industrial sector fundamentals continue to normalize with supply declining meaningfully, positioning FR for sustained cash flow growth as lease-up progress accelerates.
Q&A Highlights From the Call
Development Lease-Up Cushion
CFO Scott Musil provided important context on guidance: even if the company fails to lease up the 1.7M SF of developments or the 708K SF Central PA vacancy, they would still be within the FFO guidance range of $3.09-$3.19. This suggests meaningful upside if lease-up accelerates.
Amazon Activity Surges
Amazon was "particularly active in Q4 2025," leasing approximately 10 million square feet industry-wide. They continue looking for space in Pennsylvania, including large-format buildings — a potential fit for FR's 708K SF Central PA vacancy.
Tariffs: "Far Less Acute"
CEO Peter Baccile addressed the tariff overhang directly: "A year ago, when we had this call, we were feeling pretty good about 2025. And then April 2nd came... They have had the whole year to think through, digest, remodel, replan, and source. And now that topic is far less acute than it was." He expects muted market reaction even if the Supreme Court strikes down tariff policy, noting "many, many prospects have moved on."
Markets Pushing Rent 3%+
When asked which markets can push rents above 3%, management highlighted: South Florida, Nashville, Texas (Dallas/Houston), and Central Pennsylvania.
Data Center Opportunity
The company is evaluating both land holdings and existing buildings for data center conversion. CEO Baccile noted this is a "narrowly defined set of potential opportunities" requiring extensive studies and discussions — still early innings but actively being pursued.
Denver Building Status
The 590K SF Denver asset is being dual-tracked for lease or sale. Management has "a couple of active prospects" for full-building leases and inquiries on portions, plus potential sale interest. If sold, it would eliminate ~$2.4M in annual property taxes.
Concessions Trending
Concessions are "flat to drifting up" with free rent running 0.5-1 month per year of term. TIs are tenant-specific. Notably, renewal concessions remain tight with minimal free rent and very low TIs — tenants are also renewing earlier than in 2024 to lock in certainty.
Flight to Quality Benefits FR
Class B and C assets are "struggling" on rent, with management noting that "lowering the rent is not going to necessarily create incremental demand" for functionally obsolete buildings. FR's portfolio — mostly built in the last 15 years — is benefiting from tenants trading up to Class A space.
Central PA Vacancy Detail
The 708K SF PA vacancy is more likely a single-tenant deal but can be split for two. Importantly, Pennsylvania saw 8M+ SF of deals signed in late Q3/Q4 2025 that haven't yet hit occupancy statistics — suggesting the market is tighter than headline vacancy implies.
The Bottom Line
First Industrial delivered another strong quarter with 8.5% FFO growth, 35% cash rental rate increases, and a 12.4% dividend hike. The company navigated a challenging 2025 leasing environment impacted by tariff uncertainty while still achieving 11.7% full-year FFO growth.
Looking ahead, 2026 guidance of approximately 6% FFO growth reflects:
- Conservative occupancy assumptions (94-95%) with meaningful upside if lease-up accelerates
- Continued embedded rent growth from below-market leases rolling
- Disciplined development pipeline with 7%+ target yields
- Strong balance sheet with no near-term maturities
The industrial sector fundamentals continue to normalize with supply declining meaningfully, positioning FR for sustained cash flow growth as lease-up progress accelerates. Management's confidence was evident in the 12.4% dividend increase and the tariff commentary — the uncertainty that clouded 2025 appears to be behind them.
Related Links: