Primis Financial (FRST)·Q4 2025 Earnings Summary
Primis Financial Swings to $30M Profit as Turnaround Takes Hold
January 30, 2026 · by Fintool AI Agent
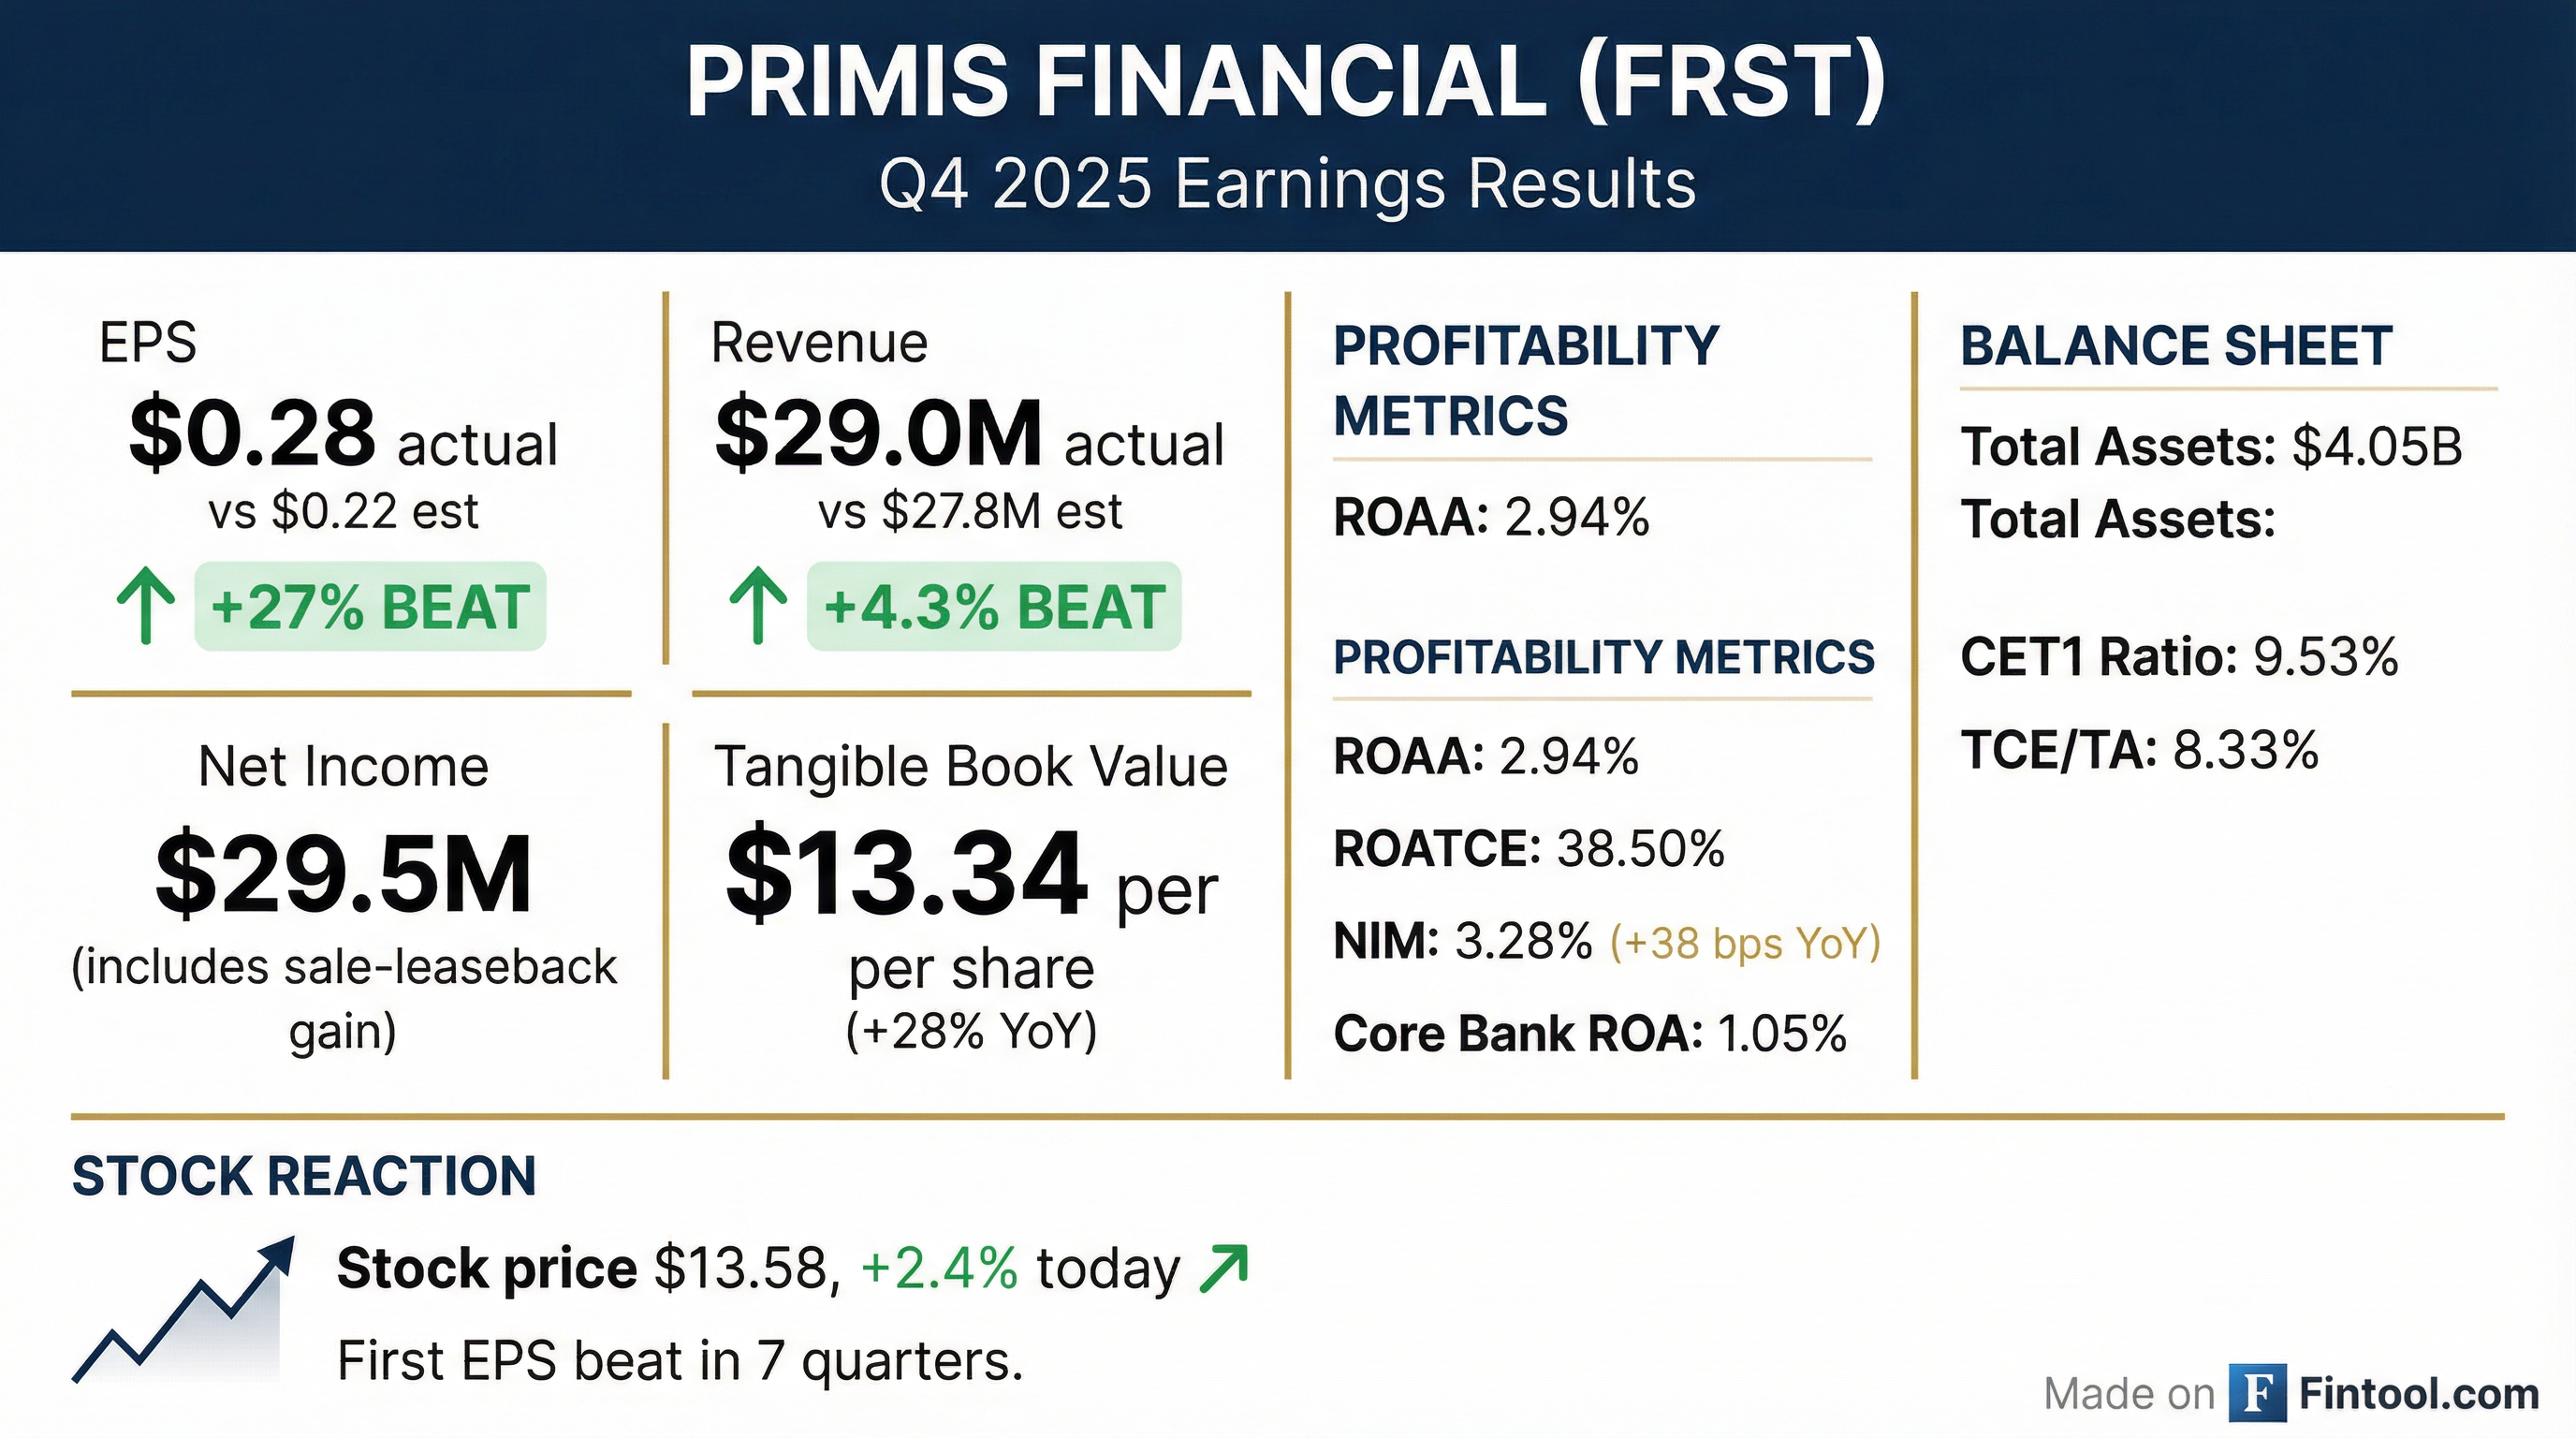
Primis Financial Corp. (NASDAQ: FRST) delivered a dramatic turnaround in Q4 2025, reporting net income of $29.5 million compared to a $23.3 million loss in Q4 2024 . The stock rose 2.4% to $13.58 in regular trading and added another 3% after hours to $14.00 following the release.
GAAP EPS of $1.20 included significant one-time items: a $51 million gain from a sale-leaseback transaction offset by a $15 million loss on investment portfolio restructuring . Stripping out these items, operating EPS was $0.10 .
Did Primis Financial Beat Earnings?
Yes — on both GAAP and operational metrics. The quarter marked a complete reversal from the challenging Q4 2024.
CEO Dennis Zember stated: "We spent 2025 harvesting some of the embedded gains on our balance sheet and used those gains to reposition the Company for 2026 and beyond. We rebuilt capital levels and tangible book value and eliminated the noise and excess exposure to the consumer loan portfolio."
For full year 2025, Primis reported net income of $61 million ($2.49 per diluted share) compared to a net loss of $16 million ($0.66 loss per share) in 2024 .
How Did Each Business Division Perform?
All five of Primis's business divisions contributed to the turnaround. The diversified model is delivering results across traditional banking and specialty verticals.
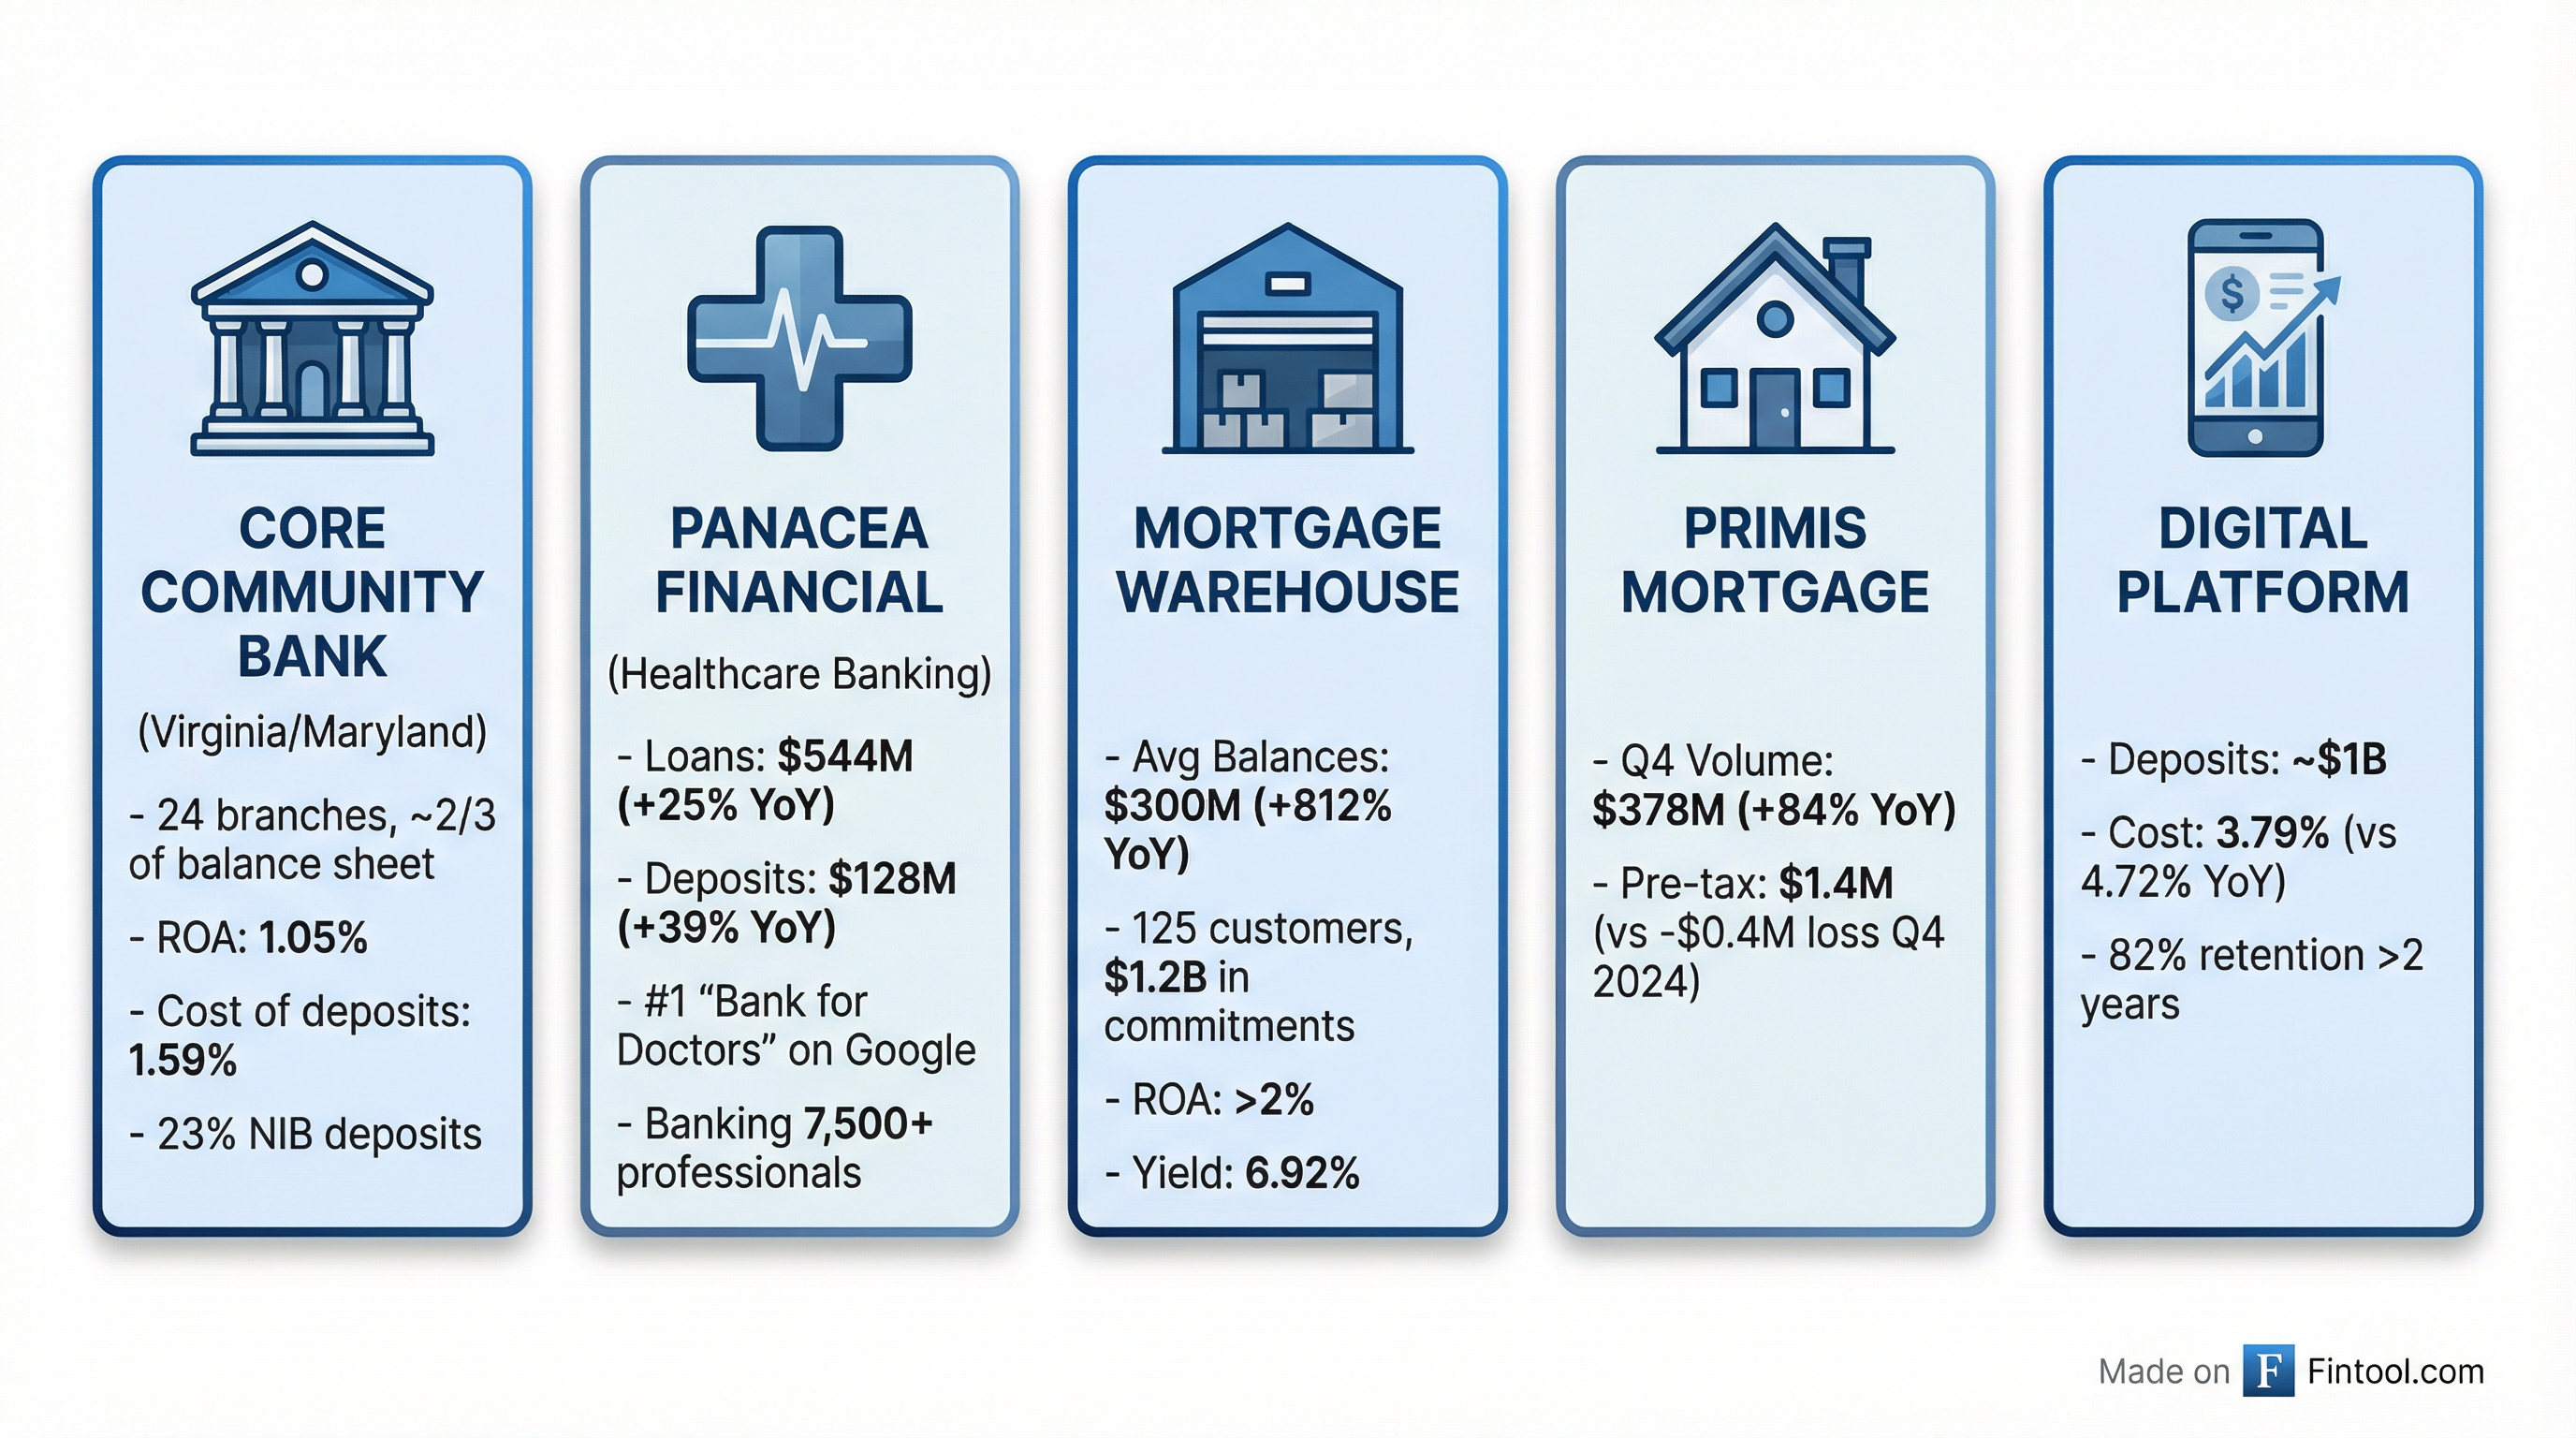
Core Community Bank
The 24-branch Virginia/Maryland network generated 1.05% ROA with cost of deposits at just 1.59% . Key strengths:
- Zero brokered deposits and minimal FHLB borrowings
- 23% of deposits are noninterest-bearing
- V1BE proprietary banking app supports $200M+ of commercial deposits
- Investor CRE concentration at only 200% of regulatory capital
Mortgage Warehouse
The standout performer with 812% YoY growth in average balances to $300 million . Approved lines reached $1.2 billion across 125 customers . The division generated:
- ROA >2%
- Yield of 6.92%
- 14.5% of balances funded with NIB deposits
Panacea Financial (Healthcare Banking)
Loans grew 25% YoY to $544 million (net of a $54 million loan sale) while deposits rose 39% YoY to $128 million . Panacea is the #1 ranked "Bank for doctors" on Google, serving over 7,500 healthcare professionals . Flow loan sales begin Q1 2026, enabling continued high growth without balance sheet strain.
Primis Mortgage
Closed volume of $378 million in Q4, up 84% YoY . Pre-tax earnings swung to $1.4 million profit from a $0.4 million loss in Q4 2024 . Construction-to-permanent volume reached $32 million .
Digital Platform
Deposits of approximately $1 billion with cost of deposits at 3.79% in December, down from 4.72% a year ago . Small business balances grew from $2 million to $16 million YoY . Notably, 82% of consumer accounts have been with the bank for over two years .
Management highlighted the retention success despite rate cuts: "Through the year and the changes in rates, we've maintained 90% of the balances, which is unquestionably a testament to our style of surprising the customer with a personal banker, twenty-four-seven access to the bank, rapid turnaround on any question or concern, and near zero fraud."
How Did the Stock React?
FRST shares responded positively to the turnaround:
The stock has rallied sharply from its 52-week low of $7.59, now trading at 1.01x tangible book value based on TBV of $13.34 . Management noted this represents significant upside to the peer group average of 1.31x .
What Changed From Last Quarter?
Several strategic moves repositioned the balance sheet:
Completed in Q4 2025:
- Sale-leaseback transaction: Generated $51 million gain, completed early December
- Investment portfolio restructuring: $15 million loss, but improved run-rate yields by 33 bps
- Panacea loan sale: $54 million of commercial loans sold, demonstrating secondary market demand
Coming in Q1 2026:
- $27 million subordinated debt redemption on January 31, 2026
- Flow loan sales for Panacea beginning Q1
- BOLI restructuring expected to add ~$1.2 million annually to noninterest income
If both the portfolio restructuring and debt redemption had been in place for all of Q4, NIM would have been 11 basis points higher .
What Did Management Guide?
Management provided detailed forward-looking targets for 2026:
Run-Rate Earnings Baseline
CEO Zember provided the most critical disclosure for understanding the starting point:
"In the fourth quarter of 2025, Matt and I are showing our run rate earnings at about $8 million, which works out to about an 80 basis points ROA on about $4 billion of average assets. That reflects virtually no improvement from the restructure that we announced, and it includes a seasonally slow quarter of mortgage."
This establishes a clear baseline from which management expects to build to 1% ROA through:
- Restructuring benefits (+11 bps NIM when fully in)
- Warehouse scaling ($175M → $500M average at >2% ROA)
- Mortgage production growth (multiples of 2025's ~$2M pre-tax contribution)
- Operating leverage on expense base
Capital Position
Tangible book value per share increased 28% YoY to $13.34 :
What Are the Key Risks?
Consumer Loan Portfolio Winding Down
The third-party consumer loan program has been a source of volatility but is now largely resolved :
- Gross loans down to $97 million from $173 million YoY
- Full deferral promotional loans only $1.6 million (vs $39 million in Q4 2024)
- Allowance + discount coverage at 453% of 2+ period delinquent loans
Management expects full deferral balances to reach immaterial levels after H1 2026 .
Asset Quality
Nonperforming assets (excluding SBA guarantees) were 2.03% of total assets . However, core net charge-offs remain minimal at just 5 basis points annualized .
The provision for credit losses was $2.4 million, broken down as :
- $0.6 million related to loan growth
- $0.6 million related to consumer program
- $1.0 million for individually impaired loans
Q&A Highlights
The earnings call on January 30, 2026 provided additional color on 2026 expectations:
Mortgage Warehouse Outlook
Analyst question on where warehouse balances could end in 2026 given $1.23 billion in existing commitments:
"We're anticipating mortgage warehouse to average $500 million across the year. It's seasonal, so that might be an average of $400 million or so in the first quarter, but we'll probably peak well over $600 million over the summer."
Management highlighted the profitability: "That business for us is doing comfortably over 2% ROA."
Loan Growth Expectations
NIM Trajectory
Asked about the path to 1% ROA, CFO Matt Switzer provided margin guidance:
"We should be healthily in the mid-3.4s in the first quarter, if not a little bit better than that, and call it pushing 3.5 as we get through the year."
Key tailwinds: subordinated debt payoff (2 quarters in run rate by Q1), full quarter of securities restructuring, and $331 million of loans repricing in H2 2026 with a weighted average yield just under 5% .
Special Mention Loans Detail
On the $40 million increase in special mention loans:
- Office CRE deal: Strong cash flows, investor adding capital, downgraded due to modification. "We've not had a payment problem"
- Guarantor-supported loan: "Extraordinarily strong guarantor with a lot of liquidity, a piece of collateral that we're not very delighted with"
- Assisted living: Tenant issue being worked through, guarantor supporting. "Probably be in a position to upgrade that back in the next couple of quarters"
- Being recapped: Would result in payoff once complete
Management was emphatic: "We don't see substandard on these, and we definitely don't see big impairments or losses."
Deposit Strategy Deep Dive
On customer acquisition vs. balance growth:
"We measure new customers, not new accounts. Last year, it was almost 6,000 new customers to the bank. The first year I got here, we barely cracked 1,000... The balances three years after you acquire the customer are almost double what they were in the first year."
Investment Thesis Summary
Bulls Will Point To:
- Complete turnaround from loss to profitability
- Diversified business model with all five divisions contributing
- Strong NIM expansion (+38 bps YoY) with room to grow
- Trading at just 1.01x tangible book vs peer average of 1.31x
- Specialty verticals (Panacea, mortgage warehouse) with differentiated growth profiles
Bears Will Point To:
- Elevated nonperforming assets at 2% of total assets
- One-time gains drove headline results; operating EPS was modest at $0.10
- Consumer loan portfolio wind-down still in progress
- Small market cap (~$335M) with limited liquidity
- Regional bank sector facing ongoing pressure from rates and deposits
Key Financial Tables
Income Statement Summary
Balance Sheet Highlights
Related Documents
Conference call: Friday, January 30, 2026 at 10:00 AM ET. Webcast: https://events.q4inc.com/attendee/704458155. Replay available for 7 days at 1-800-770-2030 (access code: 4440924).