Earnings summaries and quarterly performance for FIRST SOLAR.
Executive leadership at FIRST SOLAR.
Board of directors at FIRST SOLAR.
Research analysts who have asked questions during FIRST SOLAR earnings calls.
BL
Brian Lee
Goldman Sachs Group, Inc.
6 questions for FSLR
Also covers: ARRY, AYI, CCJ +22 more
PS
Philip Shen
ROTH MKM
6 questions for FSLR
Also covers: ARRY, CSIQ, DQ +13 more
Julien Dumoulin-Smith
Jefferies
5 questions for FSLR
Also covers: AEE, AEP, AES +60 more
Mark W. Strouse
J.P. Morgan Chase & Co.
4 questions for FSLR
Also covers: ARRY, BE, BEP +17 more
AP
Andrew Percoco
Morgan Stanley
2 questions for FSLR
Also covers: ADNT, BE, CAR +12 more
BK
Ben Kallo
Robert W. Baird & Co.
2 questions for FSLR
Also covers: ALB, AMRC, ARRY +17 more
KH
Kashy Harrison
Piper Sandler
2 questions for FSLR
Also covers: AMRC, ARRY, BE +13 more
Vikram Bagri
Citigroup Inc.
2 questions for FSLR
Also covers: AMPS, ARRY, CSIQ +8 more
Moses Sutton
BNP Paribas
1 question for FSLR
Also covers: ENPH, GEV, HASI +4 more
PS
Praneeth Satish
Wells Fargo
1 question for FSLR
Also covers: ARIS, CSIQ, ENB +13 more
Recent press releases and 8-K filings for FSLR.
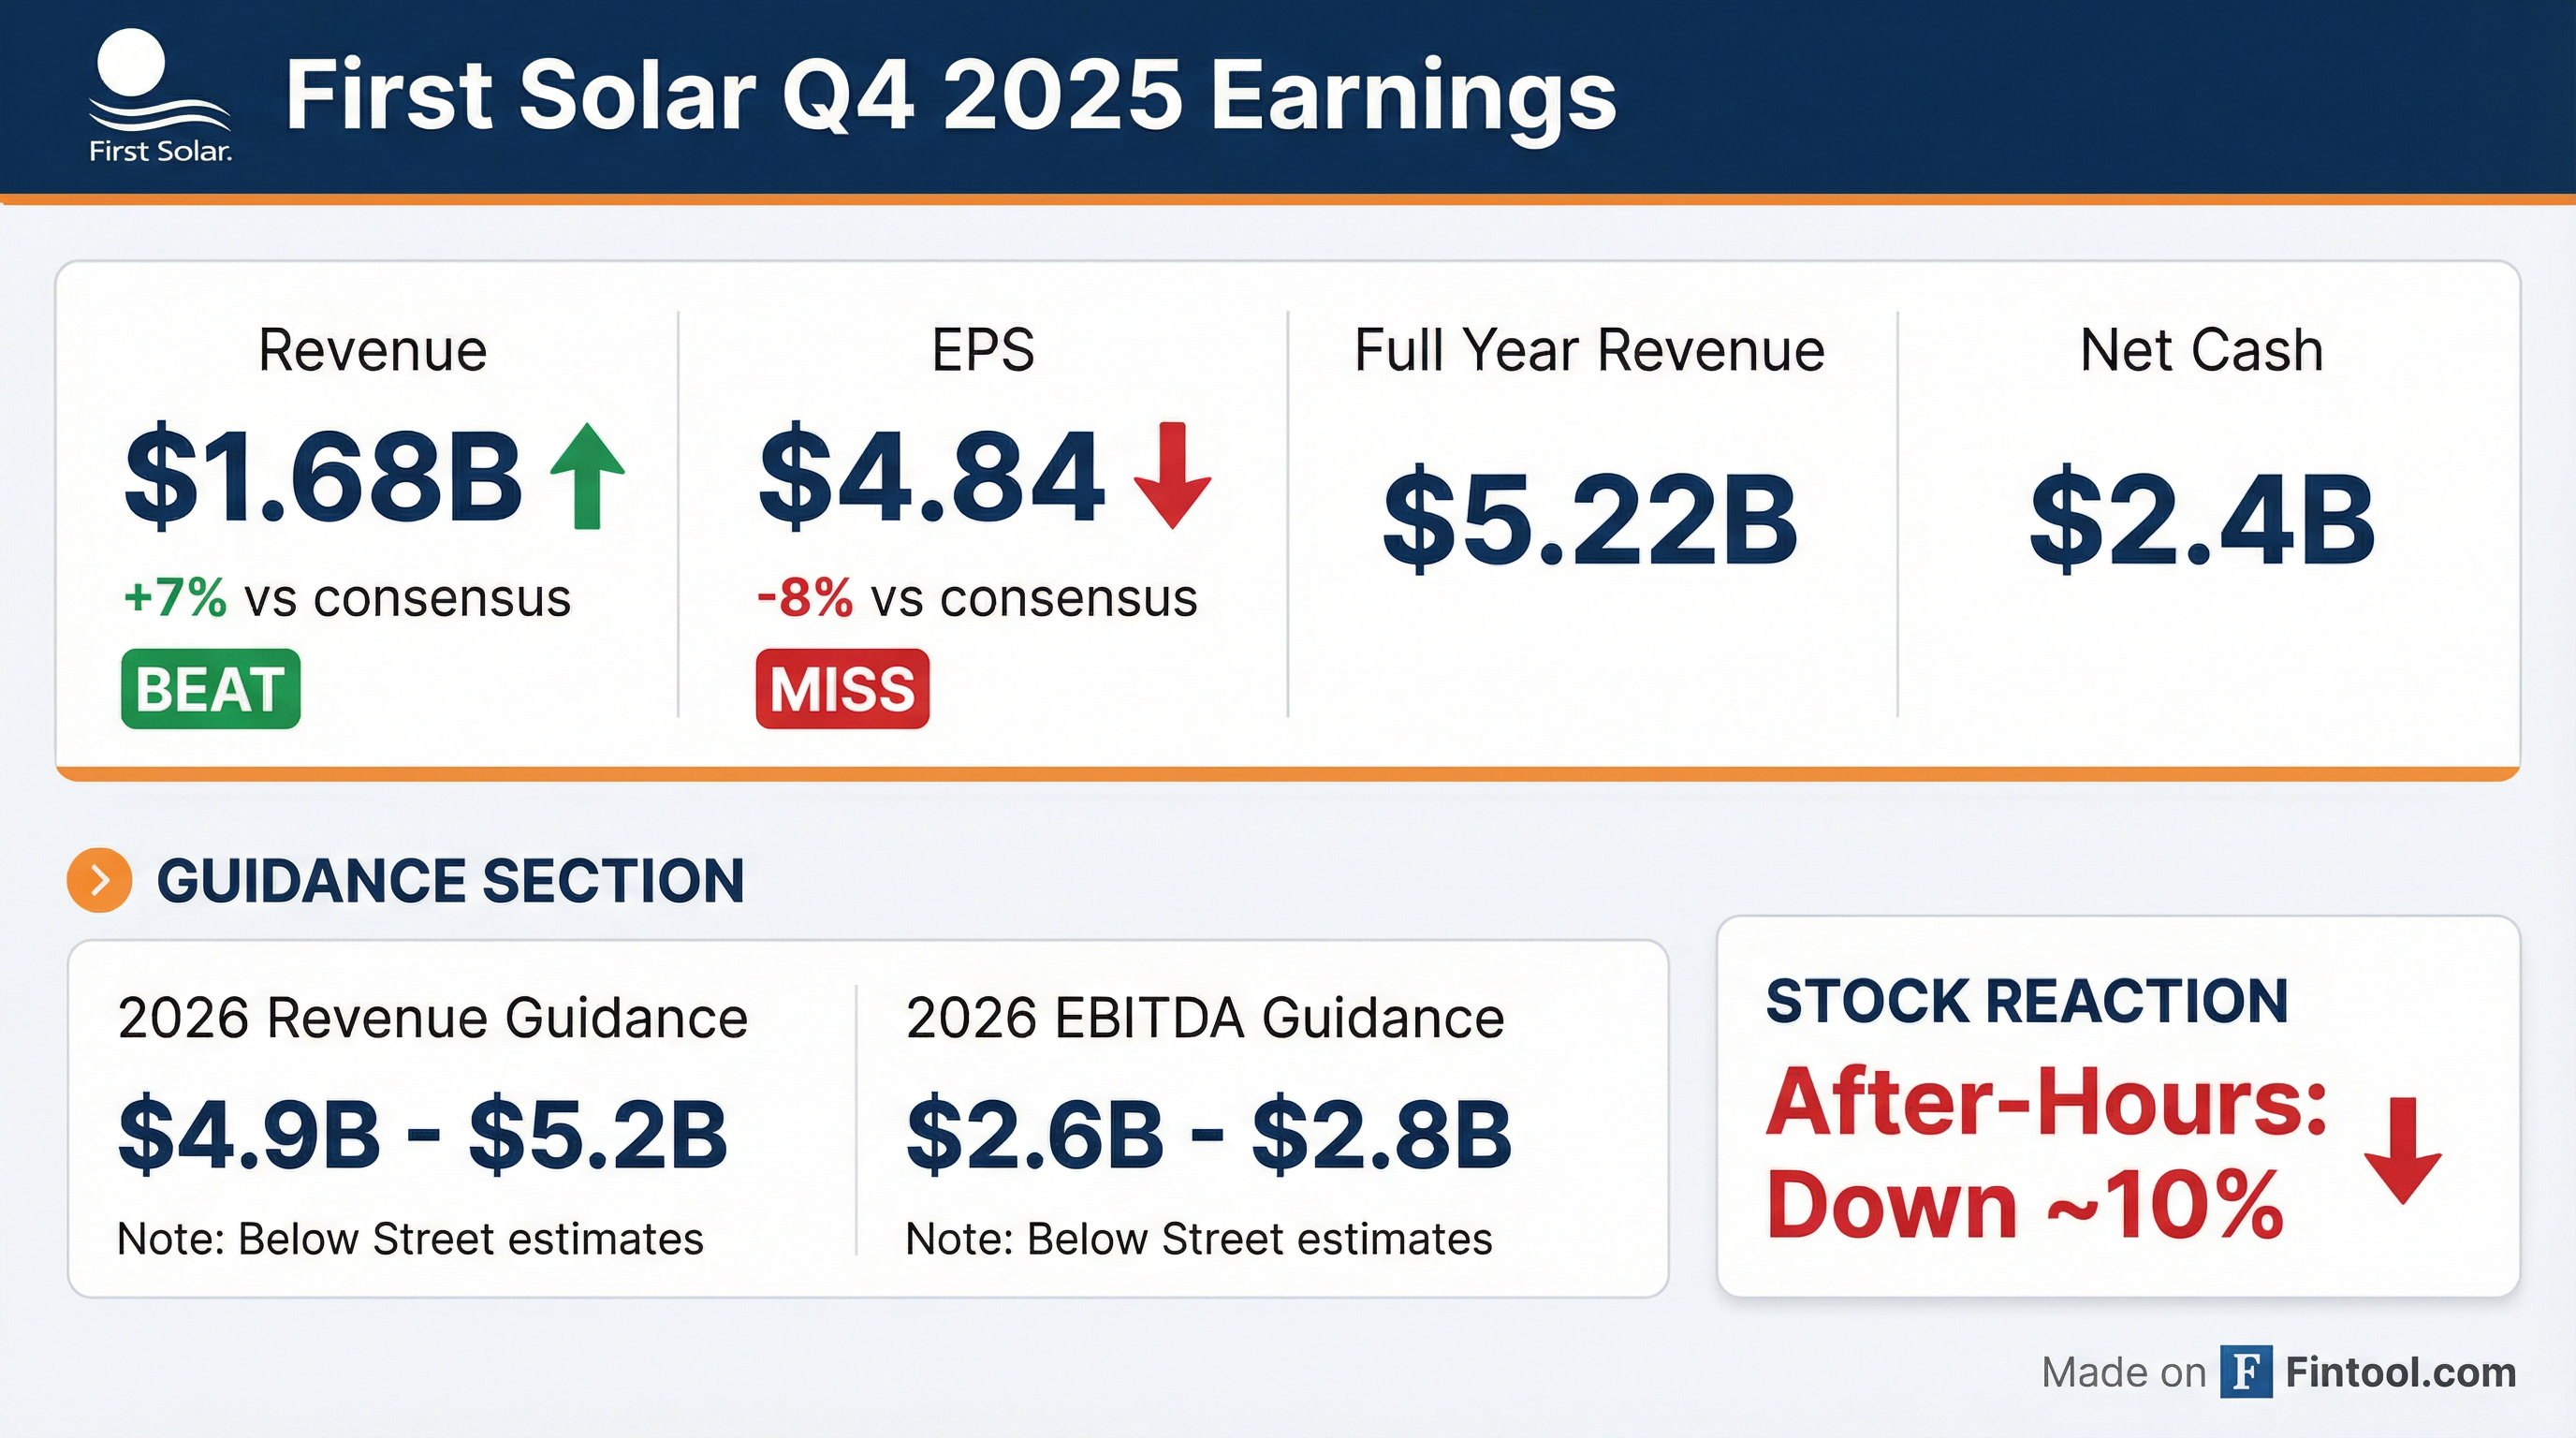
First Solar reports Q4 and full-year 2025 results
FSLR
Earnings
Guidance Update
New Projects/Investments
- 17.5 GW of module sales in 2025 (+24% YoY) driving net sales of $5.2 billion at the top end of guidance, with full-year gross margin of 41% and diluted EPS of $14.21 per share; Q4 net sales were $1.7 billion with 40% gross margin.
- End-2025 contracted backlog stood at 50.1 GW valued at $15 billion, following 7.4 GW of gross bookings and net debookings of 0.9 GW in 2025.
- 2026 guidance: volume sold of 17–18.2 GW, net sales of $4.9 billion–$5.2 billion, gross margin ~49.5% (including $2.1 billion of Section 45X credits), adjusted EBITDA of $2.6 billion–$2.8 billion, and CapEx of $0.8 billion–$1 billion.
- U.S. capacity expansion progresses with nameplate production rising to 14.9 GW in 2026 (17.1 GW in 2027), including a South Carolina finishing line starting Q4 2026; CuRe rollout at Ohio and perovskite pilot line targeted operational in early 2027.
- Trade and policy environment remains net favorable for U.S. manufacturing; recent Solar IV preliminary CVD rates of ~81%–126%–104% and ongoing IP enforcement underpin strategic positioning.
3 days ago
First Solar reports Q4 2025 results
FSLR
Earnings
Guidance Update
- Sold 17.5 GW of modules in 2025, with year-end contracted backlog of 50.1 GW valued at $15 B (net debookings of 0.9 GW).
- Q4 net sales of $1.7 B and full-year net sales of $5.2 B (up $1.0 B yoy); Q4 gross margin 40% and FY gross margin 41% (down from 44% prior year).
- Year-end cash and equivalents of $2.9 B (up $0.8 B seq, $1.1 B yoy) and net cash of $2.4 B; monetized $1.4 B of Section 45X credits in 2025; secured a $1.5 B revolving credit facility and will prepay India credit facilities by June 30, 2026.
- 2026 guidance: net sales $4.9–5.2 B, gross margin $2.5–2.6 B (~49.5%, incl. $2.1–2.19 B Section 45X credits), adjusted EBITDA $2.6–2.8 B; forecast module sales 17–18.2 GW and production 16.5–17.5 GW.
3 days ago
First Solar reports Q4 2025 earnings
FSLR
Earnings
Guidance Update
- First Solar reported Q4 2025 net sales of $1.683 B, up $88 M QoQ and $169 M YoY, with net income of $521 M and $4.84 diluted EPS.
- Achieved a record full-year 2025 volume sold of 17.5 GW and a year-end backlog of 50.1 GW.
- Closed 2025 with gross cash of $2.9 B and net cash of $2.4 B.
- Issued 2026 guidance for volume sold of 17.0–18.2 GW, net sales of $4.9–5.2 B, and capital expenditures of $0.8–1.0 B.
3 days ago
First Solar reports Q4 2025 earnings
FSLR
Earnings
Guidance Update
New Projects/Investments
- Delivered record 17.5 GW of module sales in 2025 with net sales of $5.2 B (+24% YoY) and full-year diluted EPS of $14.21, while Q4 net sales were $1.7 B with a 40% gross margin.
- Ended 2025 with a contracted backlog of 50.1 GW valued at $15 B; 23.2 GW of this includes pricing adjusters estimated to add $0.6 B in future ASP increases.
- Monetized $1.4 B of Section 45X tax credits in 2025 (generated $1.6 B), finishing the year with $2.9 B gross cash and $2.4 B net cash.
- Advanced U.S. capacity: commenced Louisiana production (5th U.S. factory), announced South Carolina Series 6 finishing line to start in Q4 2026, initiated CuRe conversion at Ohio in Q1 2026, and plans perovskite pilot line operational by early 2027.
- 2026 guidance: net sales $4.9–5.2 B, adjusted EBITDA $2.6–2.8 B, production 16.5–17.5 GW, global ASP $0.287/W, CapEx $0.8–1.0 B, and year-end gross/net cash $1.7–2.3 B.
3 days ago
First Solar announces Q4 and full year 2025 results and 2026 guidance
FSLR
Earnings
Guidance Update
New Projects/Investments
- Net sales of $1.7 billion in Q4 and $5.2 billion for FY 2025; Diluted EPS of $4.84 in Q4 and $14.21 for the year.
- End-of-year gross cash balance of $2.9 billion and net cash balance of $2.4 billion as of December 31, 2025.
- 2026 guidance: Net sales of $4.9 billion to $5.2 billion, Adjusted EBITDA of $2.6 billion to $2.8 billion, year-end net cash of $1.7 billion to $2.3 billion, and volume sold of 17.0 GW to 18.2 GW.
- Commissioned a new Louisiana factory and plans a new South Carolina facility to expand manufacturing capacity.
3 days ago
First Solar announces fourth quarter and full year 2025 results and 2026 guidance
FSLR
Earnings
Guidance Update
New Projects/Investments
- For Q4 2025, net sales were $1.7 billion (up $0.1 billion QoQ) and net income per diluted share was $4.84, while full-year net sales reached $5.2 billion and net income per diluted share was $14.21, driven by a 24% increase in third-party module volume.
- At year-end 2025, the company held $2.9 billion in gross cash and $2.4 billion in net cash, up from $1.5 billion in Q3, supported by proceeds from Section 45X tax credits and operating cash flows.
- For 2026, First Solar guides to net sales of $4.9 billion–$5.2 billion, Adjusted EBITDA of $2.6 billion–$2.8 billion, and a year-end net cash balance of $1.7 billion–$2.3 billion.
- Operationally, the company commissioned its new Louisiana manufacturing facility and announced plans to establish a factory in South Carolina, advancing its U.S. expansion strategy.
3 days ago
First Solar enters patent licensing agreement with Oxford PV
FSLR
New Projects/Investments
- First Solar entered into a non-exclusive patent license with Oxford PV, granting access to issued and pending patents for thin film-perovskite PV devices in US utility-scale, commercial, industrial and residential markets.
- The agreement supports First Solar’s advanced perovskite device R&D at its Perrysburg, Ohio, campus to meet internal milestones on efficiency, stability and manufacturability.
- Since 2019, First Solar has invested $2 billion in thin film R&D and will invest a total of $4.5 billion in US manufacturing and R&D infrastructure by 2026.
- First Solar operates five manufacturing facilities in Alabama, Louisiana and Ohio, with a sixth under construction in South Carolina (adding 3.7 GW in H2 2026 to reach ~18 GW annual capacity by 2027).
3 days ago
First Solar enters into $1.5 billion unsecured revolving credit facility
FSLR
Debt Issuance
- On February 13, 2026, First Solar secured a senior unsecured five-year revolver of $1.5 billion with a $450 million sub-limit for letters of credit, available for working capital and general corporate purposes.
- The facility includes an accordion feature to increase commitments by up to $1 billion and permits up to two one-year extension options, subject to lender commitments and conditions.
- Pricing before an Investment Grade Ratings trigger is Term SOFR + 1.00%–1.50% or Alternate Base Rate + 0.00%–0.50% (based on net leverage), shifting post-trigger to Term SOFR + 1.00%–1.75% or Alternate Base Rate + 0.00%–0.75%, with commitment fees ranging from 0.10%–0.20% (pre-trigger) and up to 0.225% thereafter.
- Concurrently, First Solar terminated its prior senior secured revolving credit agreement dated June 30, 2023, releasing all related collateral security.
Feb 19, 2026, 9:03 PM
First Solar secures USPTO denial of TOPCon patent challenges
FSLR
Legal Proceedings
- USPTO denied three Inter Partes Review petitions from JinkoSolar (Nov 20, 2025), Mundra Solar (Dec 11, 2025), and Canadian Solar (Dec 18, 2025), upholding First Solar’s TOPCon patent validity.
- The contested patents (US 9,130,074 and 9,666,732), issued in 2015 and 2017, cover methods for manufacturing TOPCon crystalline silicon PV cells.
- First Solar’s TOPCon patent portfolio includes issued patents in multiple jurisdictions valid through 2030 and beyond; the company remains committed to actively defending and licensing its IP and pursuing infringement litigation.
Jan 20, 2026, 1:00 PM
First Solar-backed Electric Hydrogen expands into Latin America with new regional CEO
FSLR
Management Change
New Projects/Investments
- Electric Hydrogen names María Gabriela da Rocha Oliveira as General Manager for Latin America to lead commercial strategy and partnerships across the region.
- The company aims to accelerate industrial decarbonization and boost the use of sustainable fertilizers by deploying its HYPRPlant PEM electrolyzer technology powered by renewable electricity.
- Da Rocha Oliveira brings over 15 years’ experience in renewable energy and industrial decarbonization, having led green fertilizer strategy in Brazil and overseen renewable generation for Shell in Latin America.
- The 100 MW HYPRPlant, currently part of Infinium’s Roadrunner Project in Texas, is shipped in prefabricated skids for rapid assembly and will be rolled out across Latin America.
Dec 8, 2025, 4:45 PM
Quarterly earnings call transcripts for FIRST SOLAR.
Ask Fintool AI Agent
Get instant answers from SEC filings, earnings calls & more