Earnings summaries and quarterly performance for Home Federal Bancorp, Inc. of Louisiana.
Executive leadership at Home Federal Bancorp, Inc. of Louisiana.
JR
James R. Barlow
Detailed
President and Chief Executive Officer
CEO
AC
Adalberto Cantu, Jr.
Detailed
Executive Vice President and Chief Banking Officer
DC
Donna C. Lewis
Detailed
Executive Vice President, Chief Risk Officer and BSA Officer
ML
Mary L. Jones
Detailed
Executive Vice President Retail and Chief Operations Officer
Board of directors at Home Federal Bancorp, Inc. of Louisiana.
Research analysts covering Home Federal Bancorp, Inc. of Louisiana.
Recent press releases and 8-K filings for HFBL.
Home Federal Bancorp, Inc. of Louisiana Reports Q2 2026 Results
HFBL
Earnings
Revenue Acceleration/Inflection
Share Buyback
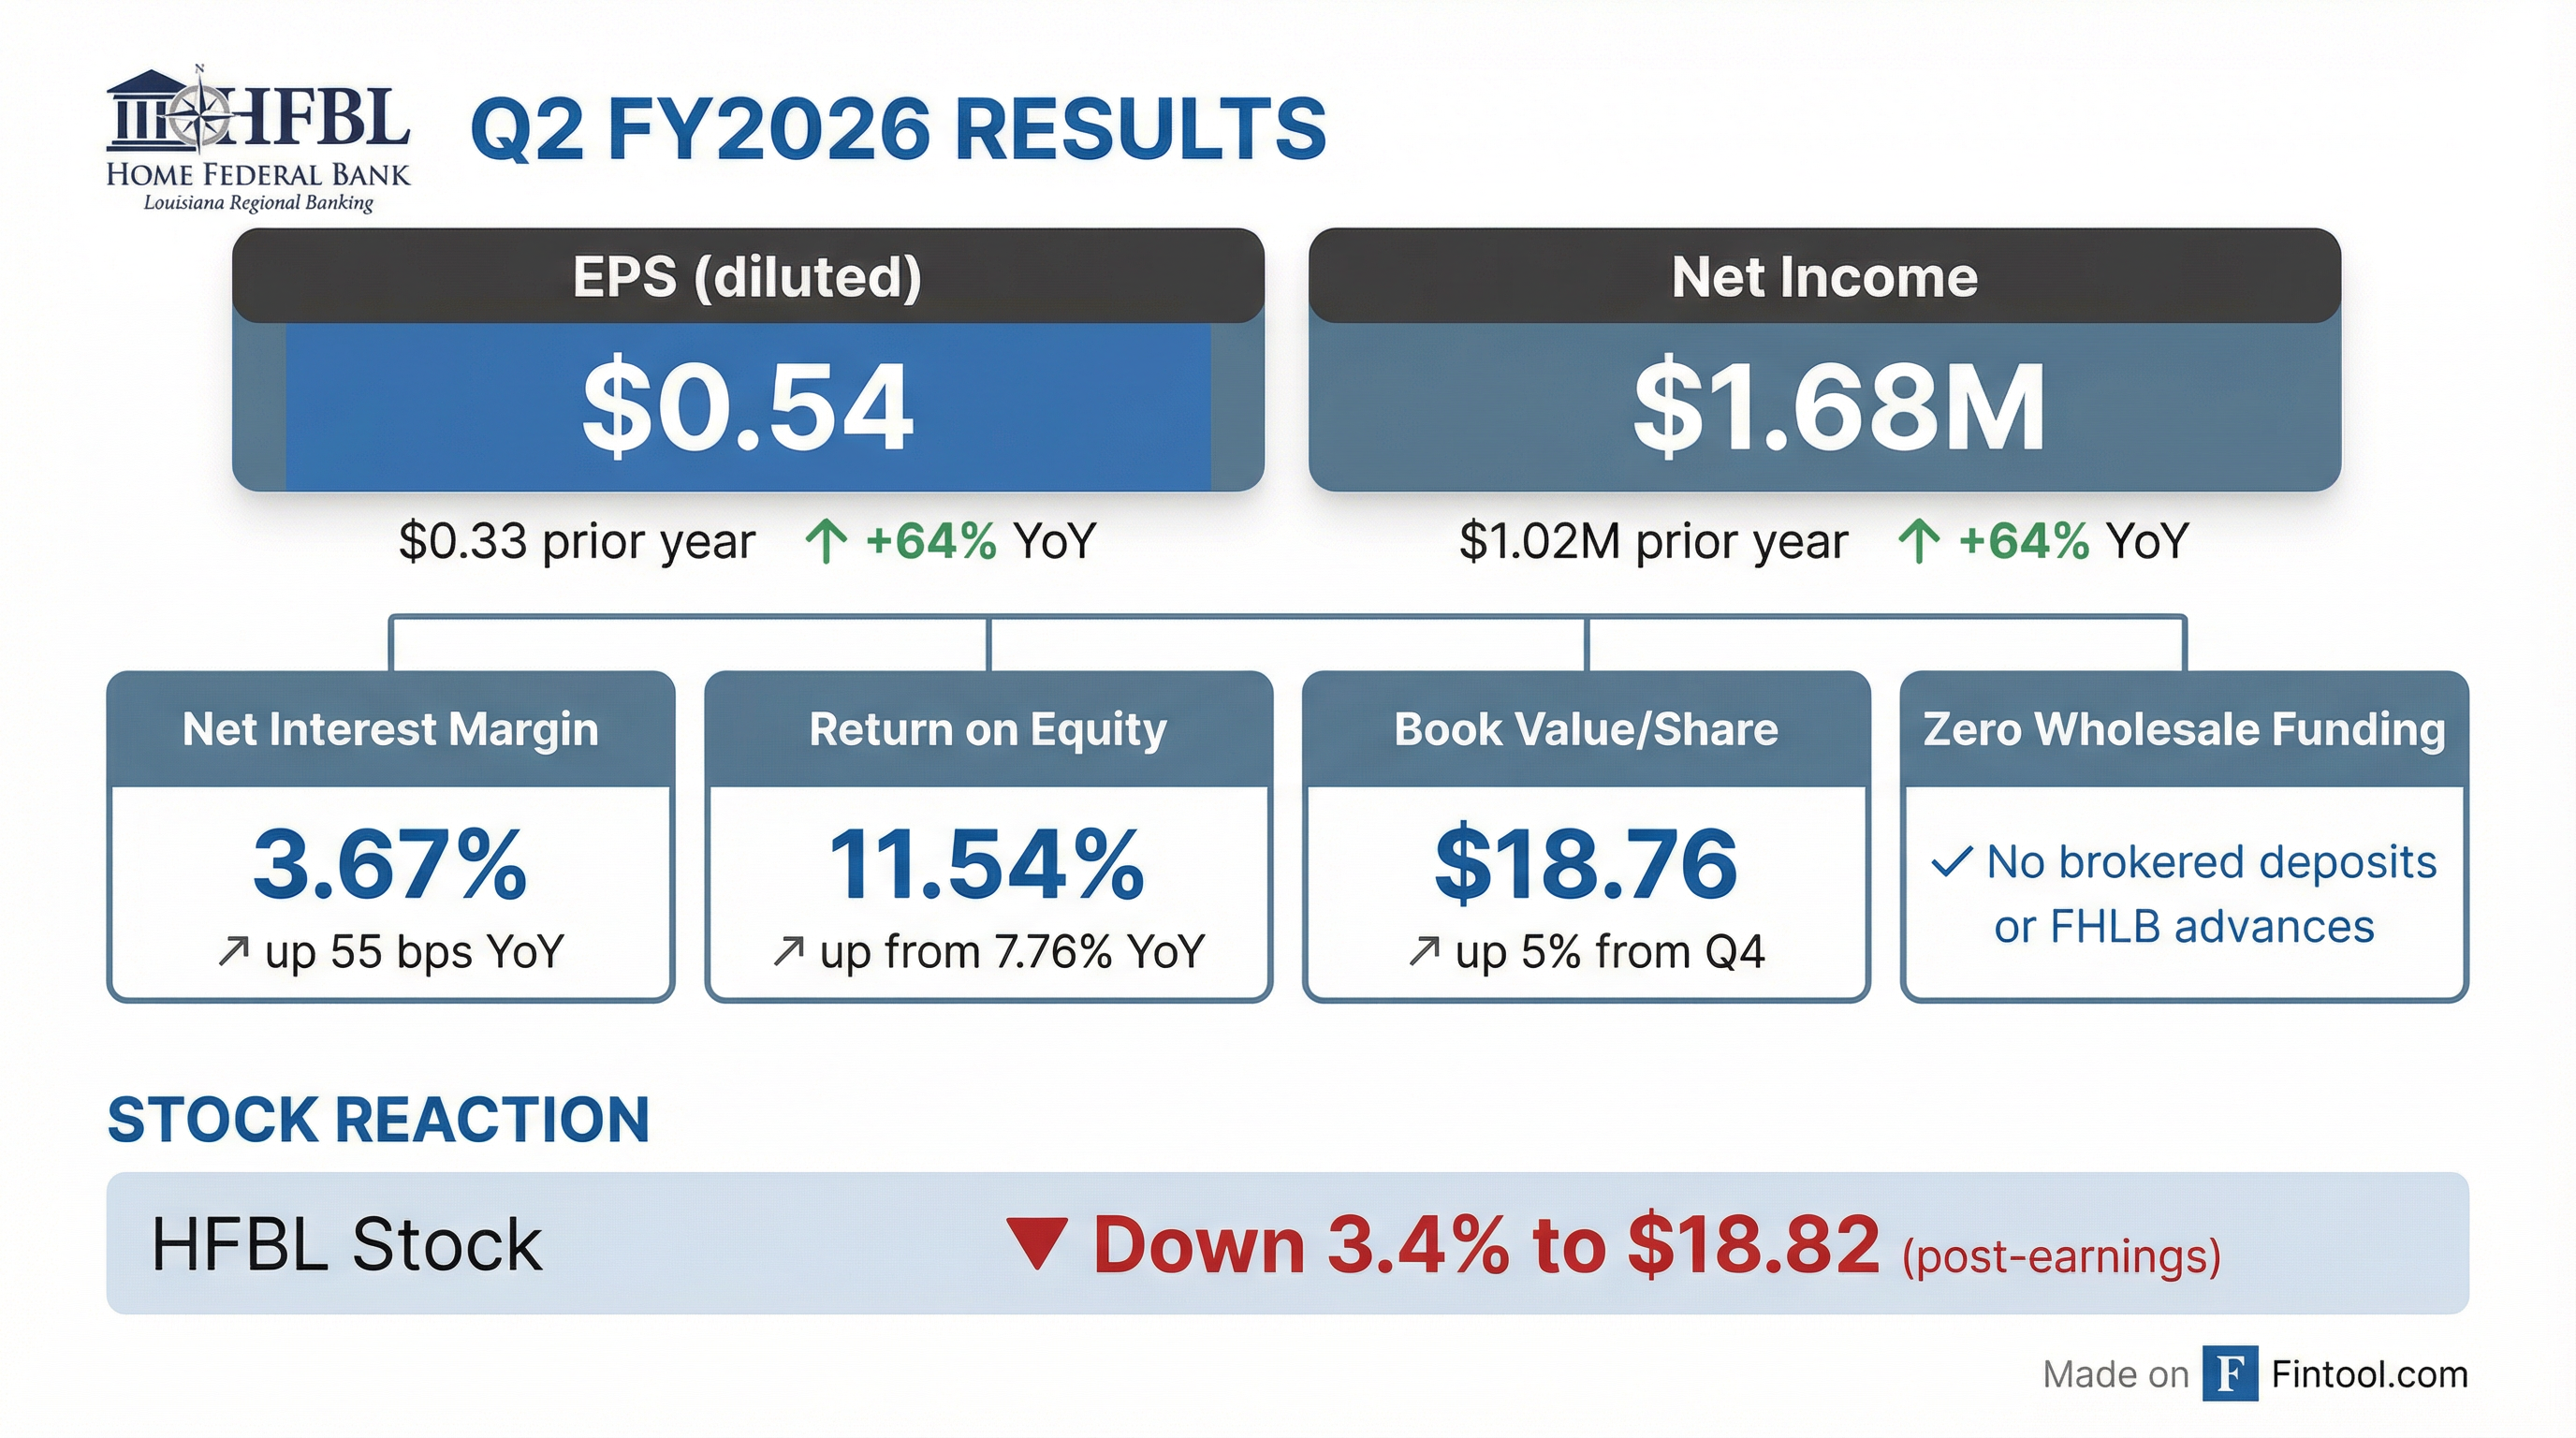
- Home Federal Bancorp, Inc. of Louisiana reported net income of $1.675 million for the three months ended December 31, 2025, with basic earnings per share of $0.55, compared to $1.020 million and $0.33, respectively, for the same period in 2024. For the six months ended December 31, 2025, net income was $3.274 million and basic EPS was $1.09.
- Book value per share increased to $18.76 at December 31, 2025, up from $17.90 at June 30, 2025.
- The net interest margin improved to 3.67% for the three months ended December 31, 2025, compared to 3.12% for the prior year period, and to 3.65% for the six months ended December 31, 2025, from 3.06% in the prior year.
- Total assets increased by $11.957 million (2.0%) to $621.449 million at December 31, 2025, and stockholders' equity grew by $2.544 million (4.6%) to $57.749 million.
- The company reported zero dependency on wholesale funding (no brokered deposits or FHLB advances) at December 31, 2025, and non-performing assets were 0.41% of total assets at period end.
Jan 28, 2026, 9:36 PM
Home Federal Bancorp of Louisiana Reports Q2 and H1 2026 Financial Results
HFBL
Earnings
Revenue Acceleration/Inflection
- Home Federal Bancorp, Inc. of Louisiana reported net income of $1.675 million and basic earnings per share of $0.55 for the three months ended December 31, 2025, compared to $1.020 million and $0.33, respectively, for the same period in 2024.
- For the six months ended December 31, 2025, net income increased to $3.274 million and basic earnings per share rose to $1.09, up from $1.961 million and $0.64 for the six months ended December 31, 2024.
- The company's net interest margin improved to 3.67% for the three months ended December 31, 2025, from 3.12% in the prior year, and to 3.65% for the six months ended December 31, 2025, from 3.06% in the prior year.
- Book value per share increased to $18.76 at December 31, 2025, from $17.90 at June 30, 2025.
- Total assets grew to $621.449 million at December 31, 2025, from $609.492 million at June 30, 2025, and non-performing assets decreased to $2.533 million at December 31, 2025, from $3.305 million at June 30, 2025.
Jan 28, 2026, 9:30 PM
Home Federal Bancorp, Inc. of Louisiana Declares Quarterly Cash Dividend and Approves Stock Repurchase Program
HFBL
Dividends
Share Buyback
- Home Federal Bancorp, Inc. of Louisiana's Board of Directors declared a quarterly cash dividend of $0.135 per share on October 15, 2025. This dividend is payable on November 10, 2025, to shareholders of record as of October 27, 2025.
- The Board of Directors also approved the company's fourteenth stock repurchase program on October 15, 2025.
- This program authorizes the repurchase of up to 100,000 shares, which is approximately 3.0% of the company's outstanding common stock, at a rate of 25,000 shares per quarter over four calendar quarters.
Oct 15, 2025, 9:06 PM
Home Federal Bancorp, Inc. of Louisiana Declares Dividend and Approves Stock Repurchase Program
HFBL
Dividends
Share Buyback
- Home Federal Bancorp, Inc. of Louisiana's Board of Directors declared a quarterly cash dividend of $0.135 per share on its common stock, payable on November 10, 2025, to shareholders of record as of October 27, 2025.
- The Board also approved the company's fourteenth stock repurchase program on October 15, 2025, authorizing the repurchase of up to 100,000 shares, which represents approximately 3.0% of the outstanding common stock. This program will allow for the repurchase of 25,000 shares per quarter over four calendar quarters, commencing after the completion of the thirteenth stock repurchase program.
Oct 15, 2025, 8:30 PM
Home Federal Bancorp Reports Q3 2025 Results
HFBL
Earnings
- Net income for the three-month period increased to $748K compared to $732K last year, while nine-month net income declined to $2.7M from $3.0M, with EPS of $0.24 and $0.88, respectively.
- Book value per share rose to $17.55 as of March 31, 2025, and other borrowings dropped to $4.0M (down from $7.0M), with no FHLB advances reported, supporting the company's solid balance sheet.
- Interest performance improved with an average interest rate spread of 2.66% and a net interest margin of 3.33%, up from 2.16% and 2.89% in the prior comparable period.
May 1, 2025, 12:00 AM
Ask Fintool AI Agent
Get instant answers from SEC filings, earnings calls & more