HOPE BANCORP (HOPE)·Q4 2025 Earnings Summary
Hope Bancorp Posts 42% Profit Jump, Guides to 25-30% PPNR Growth in 2026
January 27, 2026 · by Fintool AI Agent
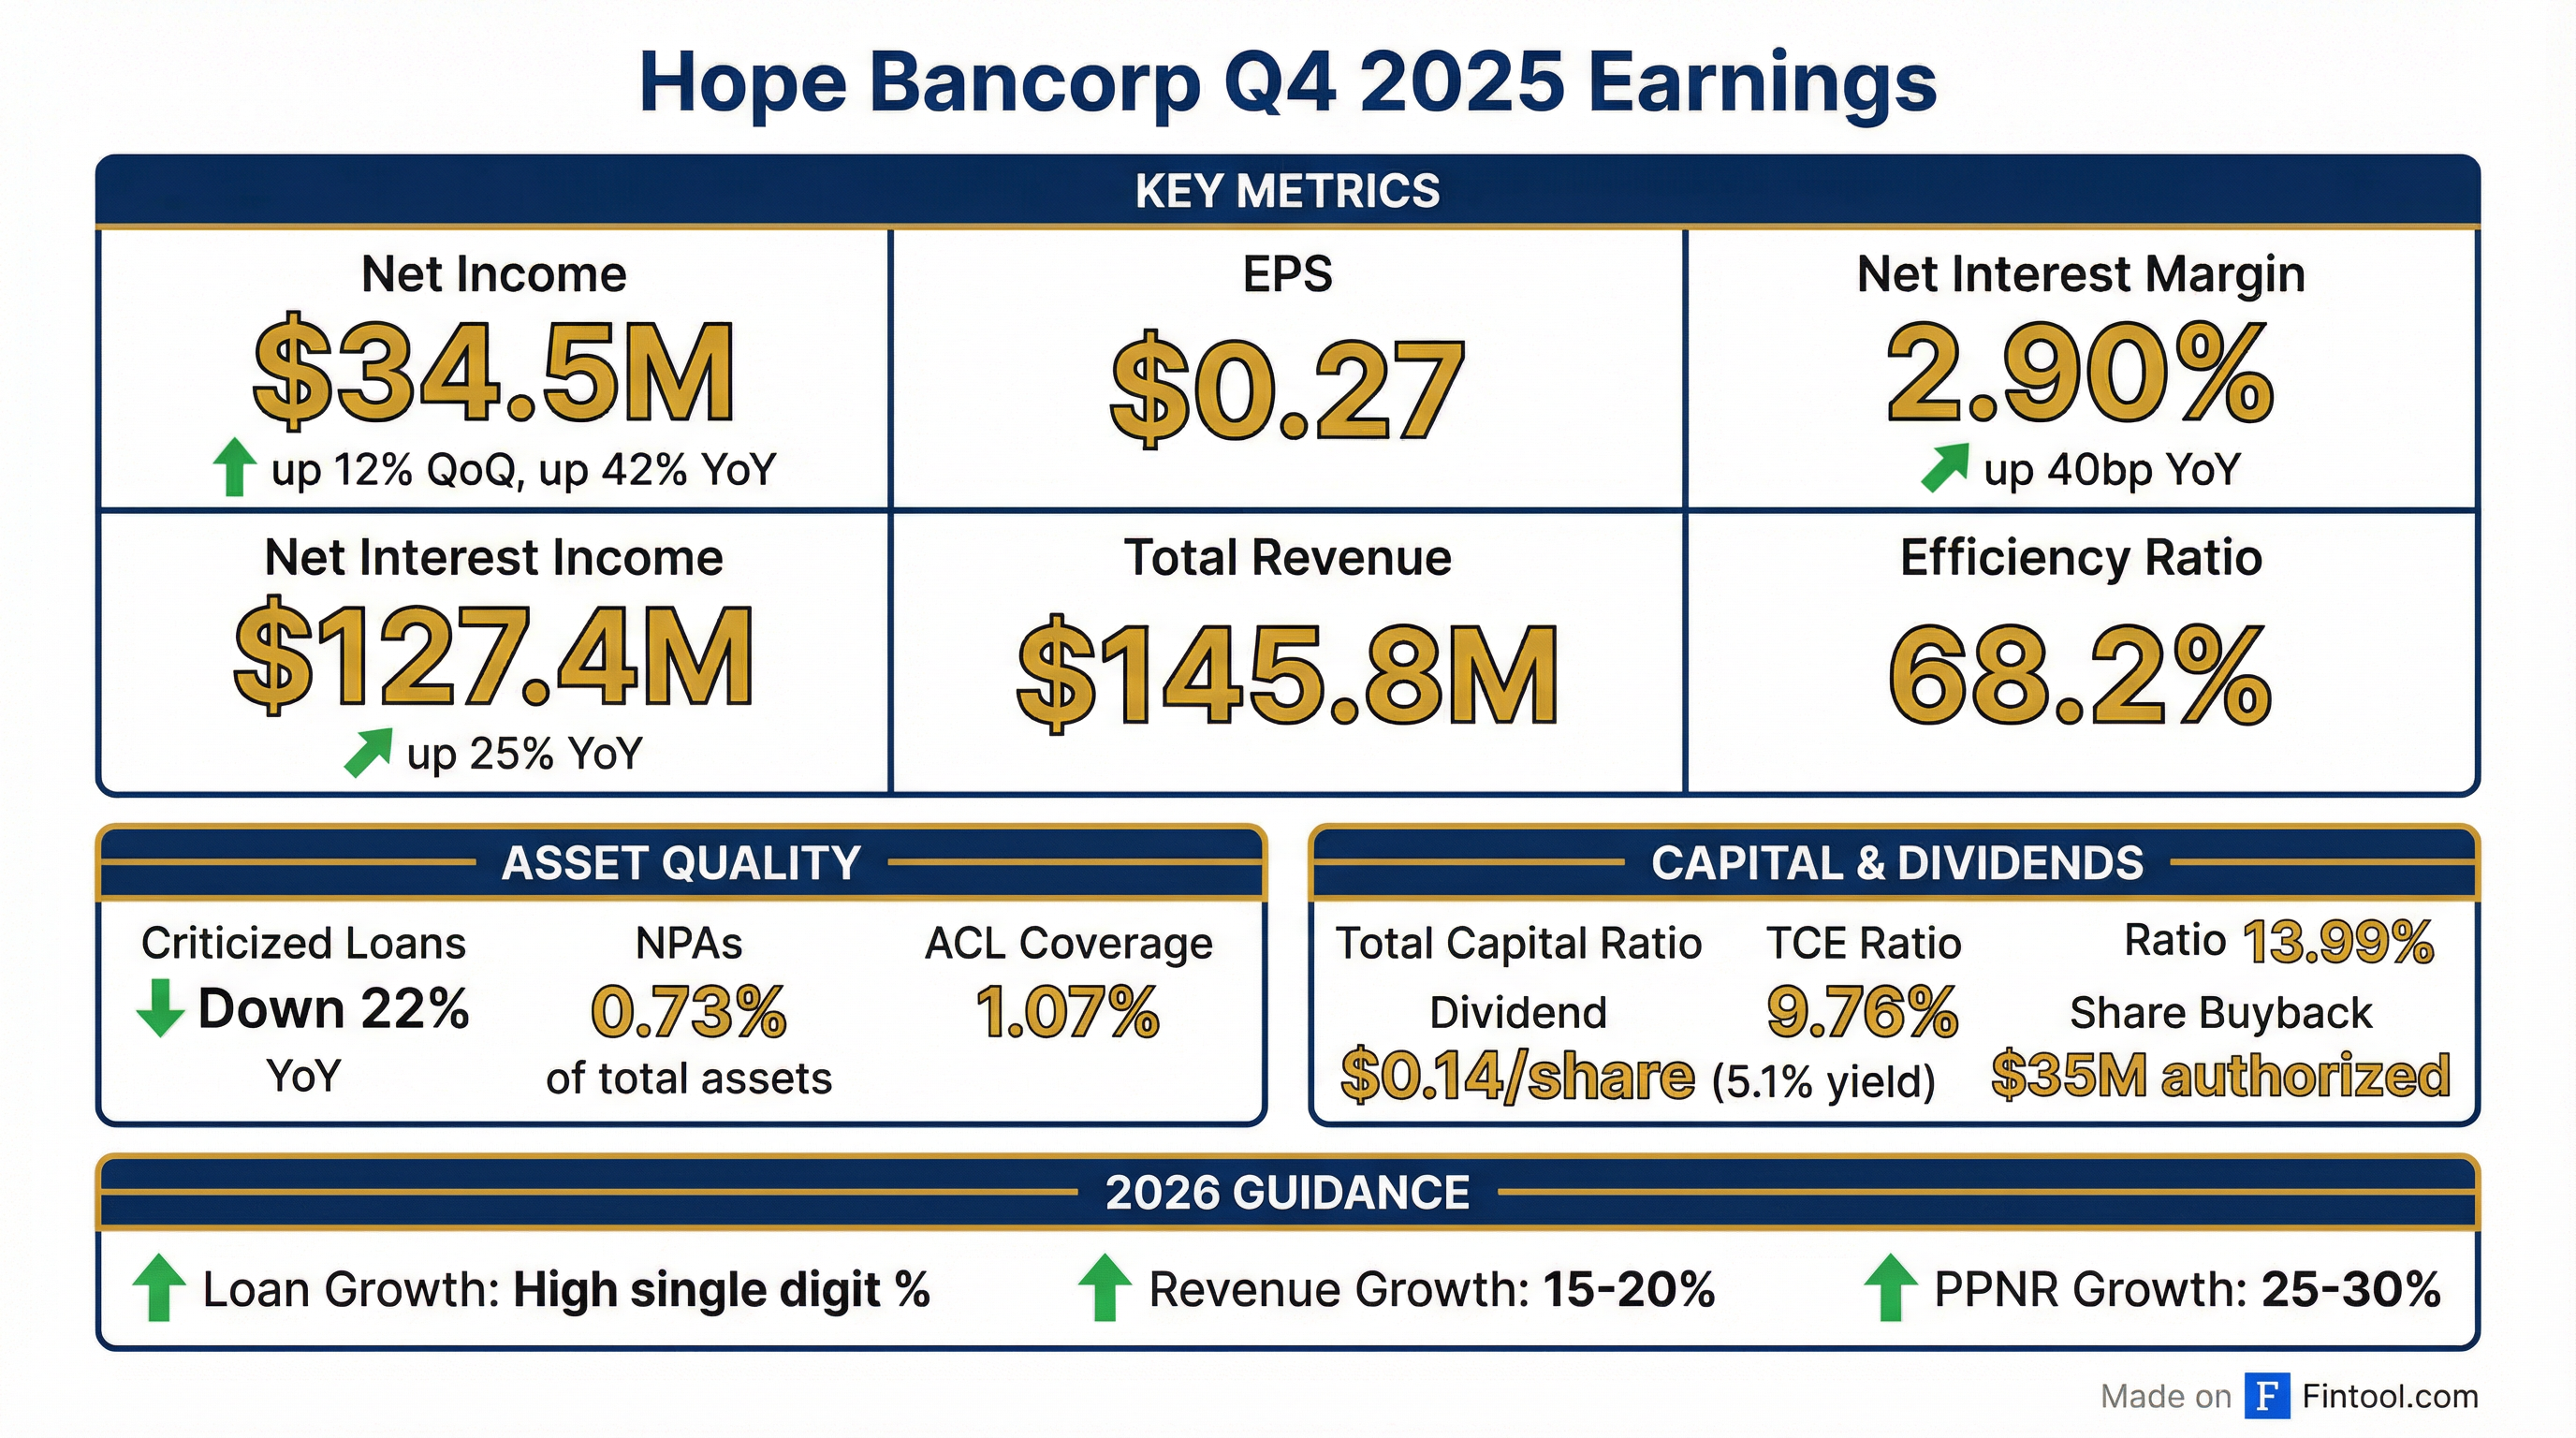
Hope Bancorp (NASDAQ: HOPE) delivered strong Q4 2025 results with net income surging 42% year-over-year to $34.5 million, or $0.27 per diluted share. The Korean-American regional bank, now the largest serving multicultural communities across the continental U.S. and Hawaii following its Territorial Bancorp acquisition, posted its fourth consecutive quarter of improving profitability metrics and issued bullish 2026 guidance calling for 25-30% pre-provision net revenue growth.
Did Hope Bancorp Beat Earnings?
Yes. Q4 2025 results exceeded expectations across key metrics:
Quarter-over-quarter, net income increased 12% from $30.8 million in Q3 2025. Year-over-year growth of 42% reflected the combined impact of lower funding costs, the Territorial Bancorp integration, and disciplined expense management.
Full Year 2025: GAAP net income totaled $61.6 million ($0.49 EPS), but this was impacted by $51.8 million in after-tax notable items including merger costs and a $38.9 million loss on securities portfolio repositioning. Excluding notable items, FY2025 net income was $113.3 million ($0.89 EPS), up 10% from the prior year.
What Drove the Quarter?
Net Interest Margin Expansion Continues
NIM expanded to 2.90%, up 1 basis point sequentially and 40 basis points year-over-year. The QoQ change reflected the following drivers:
- Cost of interest-bearing deposits: Down 17bps QoQ to 3.52%
- Average loan yield: Down to 4.02% (annualized)
- Net benefit: Funding cost reductions more than offset asset yield compression
Net interest income of $127.4 million increased 25% year-over-year, benefiting from deposit repricing discipline, improved funding mix, and higher investment securities yields from the 2025 portfolio repositioning.
Fee Income Gaining Momentum
Noninterest income jumped 19% QoQ to $18.4 million, driven by:
- Customer swap fees: Up 270% for FY2025 ($5.9M vs $1.6M in FY2024) — a key area of strategic focus
- Service fees on deposit accounts: $3.2M, flat QoQ
- SBA loan gains: $2.6M from $46M of guaranteed loan sales
Asset Quality Improving
Credit quality trends continued to strengthen:
Criticized loans declined for the fourth consecutive quarter, down 22% YoY, reflecting successful loan workouts and proactive risk management. The uptick in NPAs to 0.73% bears watching but remains manageable relative to reserve coverage.
What Did Management Guide?
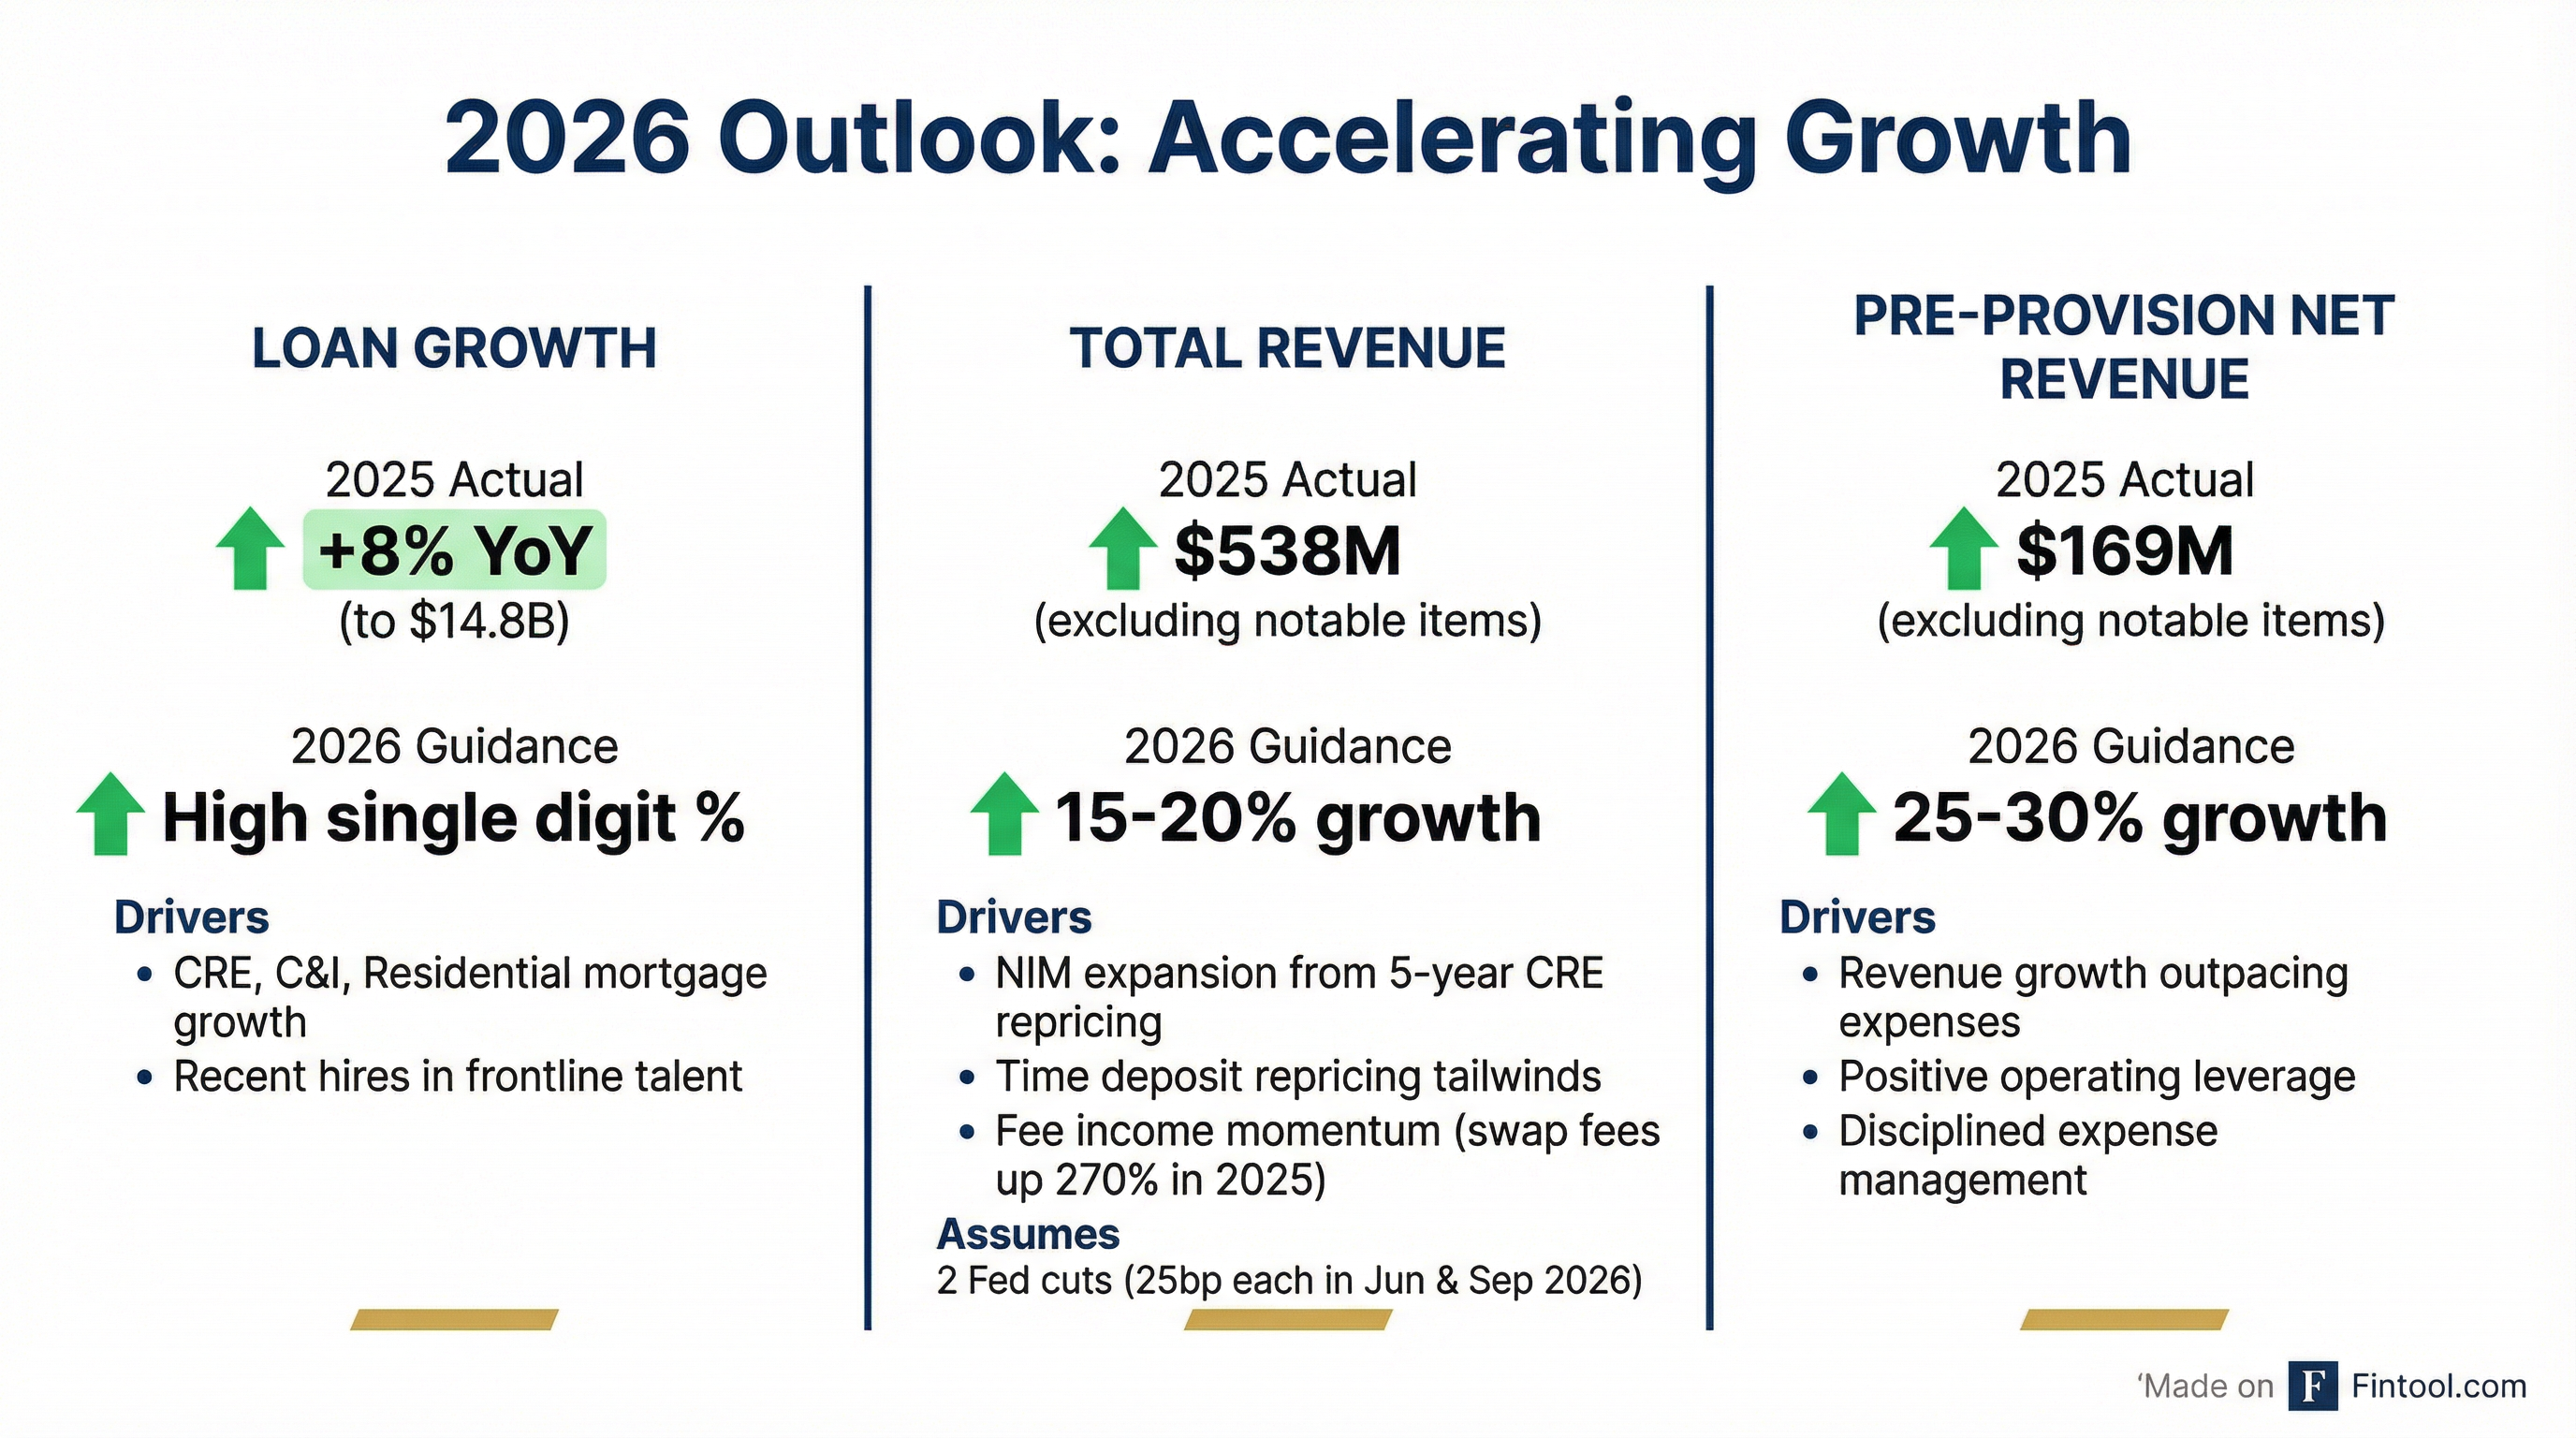
Management issued notably bullish 2026 guidance:
Key assumptions:
- Two 25bp Fed rate cuts (June and September 2026)
- Continued NIM expansion from 5-year CRE loan repricing to current market rates
- Time deposit repricing tailwinds
- Broad-based loan growth across CRE, C&I, and residential mortgage
Medium-term targets (2028+) include:
- Revenue growth >10% annually
- Efficiency ratio in the mid-50% range (vs. 68% currently)
- ROA of ~1.2%
Capital Returns: Dividend + Buyback
The board declared a quarterly dividend of $0.14 per share, payable February 20, 2026. At the current stock price, this equates to a 5.1% annualized dividend yield.
Additionally, the board reinstated the share repurchase program with $35 million still available, positioning the company to opportunistically return capital while maintaining strong capital levels for growth.
Capital Position:
Book value per share increased to $17.81 (TCE per share: $13.71).
What Changed From Last Quarter?
Positive shifts:
- NIM expansion continued (+1bp QoQ, +40bps YoY)
- Fee income execution improving (swap fees +270% for full year)
- Criticized loans declining for 4th straight quarter
- Share repurchase program reinstated
- Strong 2026 guidance issued
Items to monitor:
- NPAs increased to 0.73% from 0.61% (still covered 1.15x by reserves)
- Noninterest expense up 3% QoQ due to strategic hiring
- Deposits down 1% QoQ (seasonal, expected to return Q1)
CEO Commentary
"We delivered solid earnings growth in the fourth quarter of 2025, with net income up 12% from the third quarter of 2025, reflecting growth in net interest income, strength in customer fee revenue, and lower provisions for credit losses."
"For the full year 2025, we significantly lowered our cost of deposits, reduced reliance on brokered deposits, enhanced our earning assets mix, added experienced senior leadership as well as front line talent, and strengthened our asset quality with a steady decrease in criticized assets in each quarter of 2025."
— Kevin S. Kim, Chairman, President and CEO
How Did the Stock React?
HOPE shares closed at $11.78 on January 26, 2026, ahead of the earnings release. The stock has traded in a range of $10.96-$12.17 over the past month and is down approximately 2% from January 2024 levels.
Key valuation metrics:
- Market Cap: ~$1.5B
- P/E (trailing): ~23x GAAP, ~13x adjusted
- Price/TCE: 0.86x
- Dividend Yield: 5.1%
The stock trades at a discount to tangible book value, reflecting broader regional bank sector pressures, though the improving profitability trajectory and bullish guidance could support re-rating.
Loan Portfolio Composition
Total gross loans reached $14.8 billion, up 1% QoQ (4% annualized) and 8% YoY:
CRE Portfolio Detail
The $8.5 billion CRE portfolio is well-diversified across property types with conservative underwriting:
Key takeaway: Office exposure is minimal at just 2% of total loans with no central business district exposure, and the overall CRE portfolio carries low LTVs averaging in the low-40% range.
Q&A Highlights
CD Repricing Tailwind
CFO Julianna Balicka provided specific details on the deposit repricing opportunity:
- $6.3 billion in CDs repricing during 2026
- New branch CDs coming in at 3.75-3.80% range
- Institutional CDs repricing to approximately 3.70%
- Spot deposit cost as of December 31, 2025: 2.68%
This repricing dynamic supports management's NIM expansion guidance, as maturing CDs roll into materially lower rates.
Hawaii Integration Update
CEO Kevin Kim noted the Territorial Bancorp integration in Hawaii proceeded smoothly:
"Our focus in 2025 in Hawaii was to ensure the successful integration of the teams and add resources as necessary. During the transition period in 2025, we were pleased to see that we did not experience any meaningful deposit fluctuations and the reception by our customer base in Hawaii."
The company is now positioned to generate organic growth from the Hawaii franchise in 2026.
Hiring Strategy
Management confirmed ongoing investments in frontline talent to support revenue growth, with Q4 2025's expense run rate a reasonable baseline for 2026. Hiring is focused on revenue generation and related support capabilities.
Forward Catalysts
Near-term (2026):
- NIM expansion from CRE loan repricing and deposit cost reductions
- Fee income growth from expanded swap capabilities
- Integration synergies from Territorial Bancorp
- Potential share repurchase activity
Risks to monitor:
- CRE credit quality (though office exposure is minimal)
- Interest rate sensitivity if Fed pivot is delayed
- Deposit competition in California and Hawaii markets
- Integration execution on Territorial acquisition
Key Takeaways
- Strong quarter: 42% YoY profit growth with NIM expansion continuing
- Bullish 2026 outlook: 15-20% revenue growth, 25-30% PPNR growth guided
- Credit improving: Criticized loans down 22% YoY, fourth consecutive quarterly decline
- Capital returns resuming: 5.1% dividend yield plus $35M buyback authorized
- Territorial integration on track: Now largest regional bank serving multicultural communities
Data sourced from Hope Bancorp Q4 2025 8-K filing and Q4 2025 earnings conference call presentation dated January 27, 2026.
Related: HOPE Company Profile | Q3 2025 Earnings | Earnings Transcript